In the fast-evolving world of digital technology, the success of any mobile app depends on performance tracking and data-driven decision-making. With thousands of apps competing for user attention every day, developers and marketing teams need an effective way to monitor performance, user engagement, and revenue growth.
That’s where the Mobile App Performance KPI Scorecard in Excel comes in — a complete, ready-to-use performance monitoring template that helps teams track, analyze, and improve app performance across multiple KPIs in one place.
In this article, we’ll explore the structure, features, benefits, best practices, and common questions about this Excel-based KPI scorecard and how it can transform your mobile app management process.
Click to Purchases Mobile App Performance KPI Scorecard in Excel
What Is a Mobile App Performance KPI Scorecard in Excel?
A Mobile App Performance KPI Scorecard is an analytical tool designed to monitor critical app performance indicators (KPIs) such as downloads, active users, churn rate, crash frequency, and user retention.
Built entirely in Microsoft Excel, it provides a flexible, visual, and data-driven approach to measure Month-to-Date (MTD) and Year-to-Date (YTD) results against defined targets — empowering app teams to make informed decisions instantly.
Unlike complex analytics software, this Excel scorecard is simple, customizable, and doesn’t require coding or advanced technical expertise. It’s designed to bring professional-grade analytics within everyone’s reach.
Key Features of the Mobile App Performance KPI Scorecard in Excel
This ready-to-use Excel scorecard comes with four powerful worksheet tabs, each serving a unique purpose in performance management.
Let’s explore each in detail.
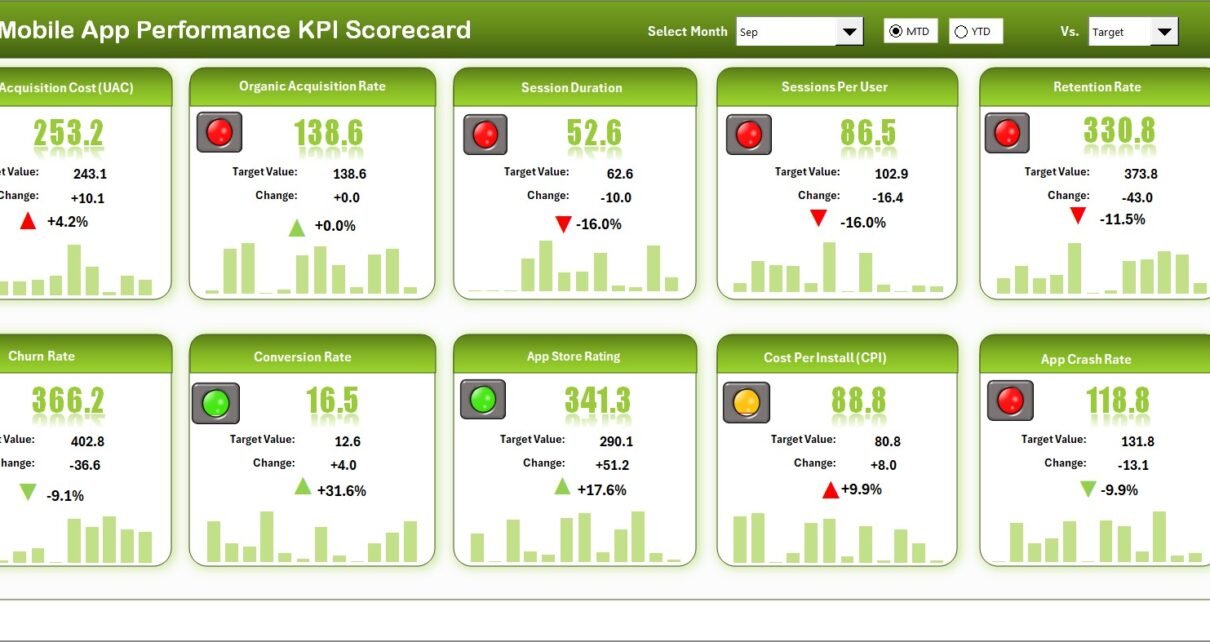
1️⃣ Scorecard Sheet — The Central Dashboard
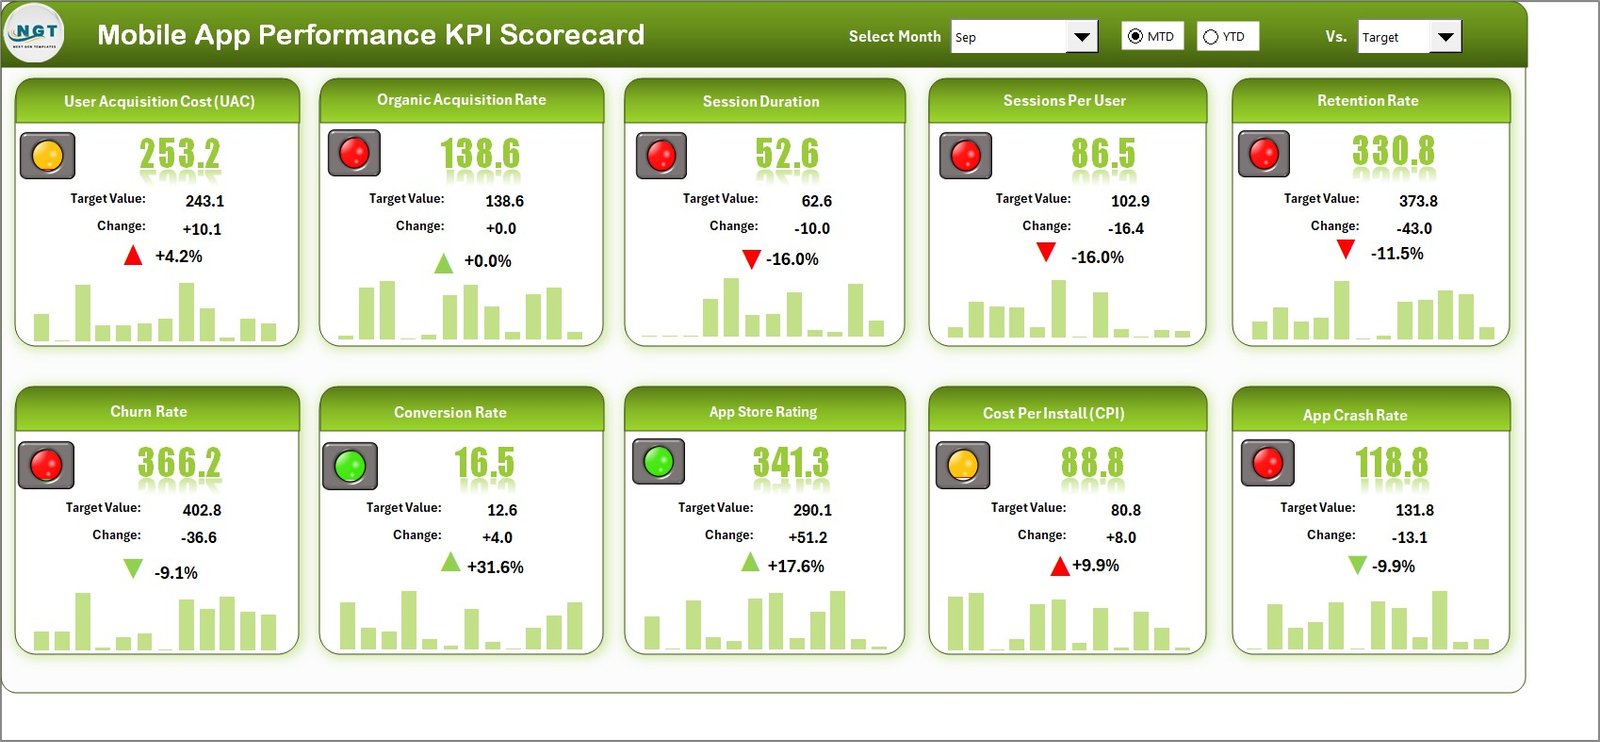
The Scorecard Sheet acts as the heart of the entire file. It’s the main dashboard where you can view KPI performance through interactive visuals and conditional formatting.
Key elements include:
-
Dropdown Menus: Select the desired month and view either MTD (Month-to-Date) or YTD (Year-to-Date) performance.
-
Actual vs Target Values: Instantly compare your app’s current performance against its goals.
-
Visual Indicators: Use color-coded icons (green for success, red for improvement needed) to show whether targets were met.
-
Comprehensive KPI Overview: All KPIs — such as app downloads, daily active users (DAU), revenue, crash rate, and user retention — appear together in one view, with actuals, targets, and percentage differences.
This sheet provides decision-makers with a one-stop snapshot of the app’s health and performance metrics.
2️⃣ KPI Trend Sheet — Analyze Growth Over Time
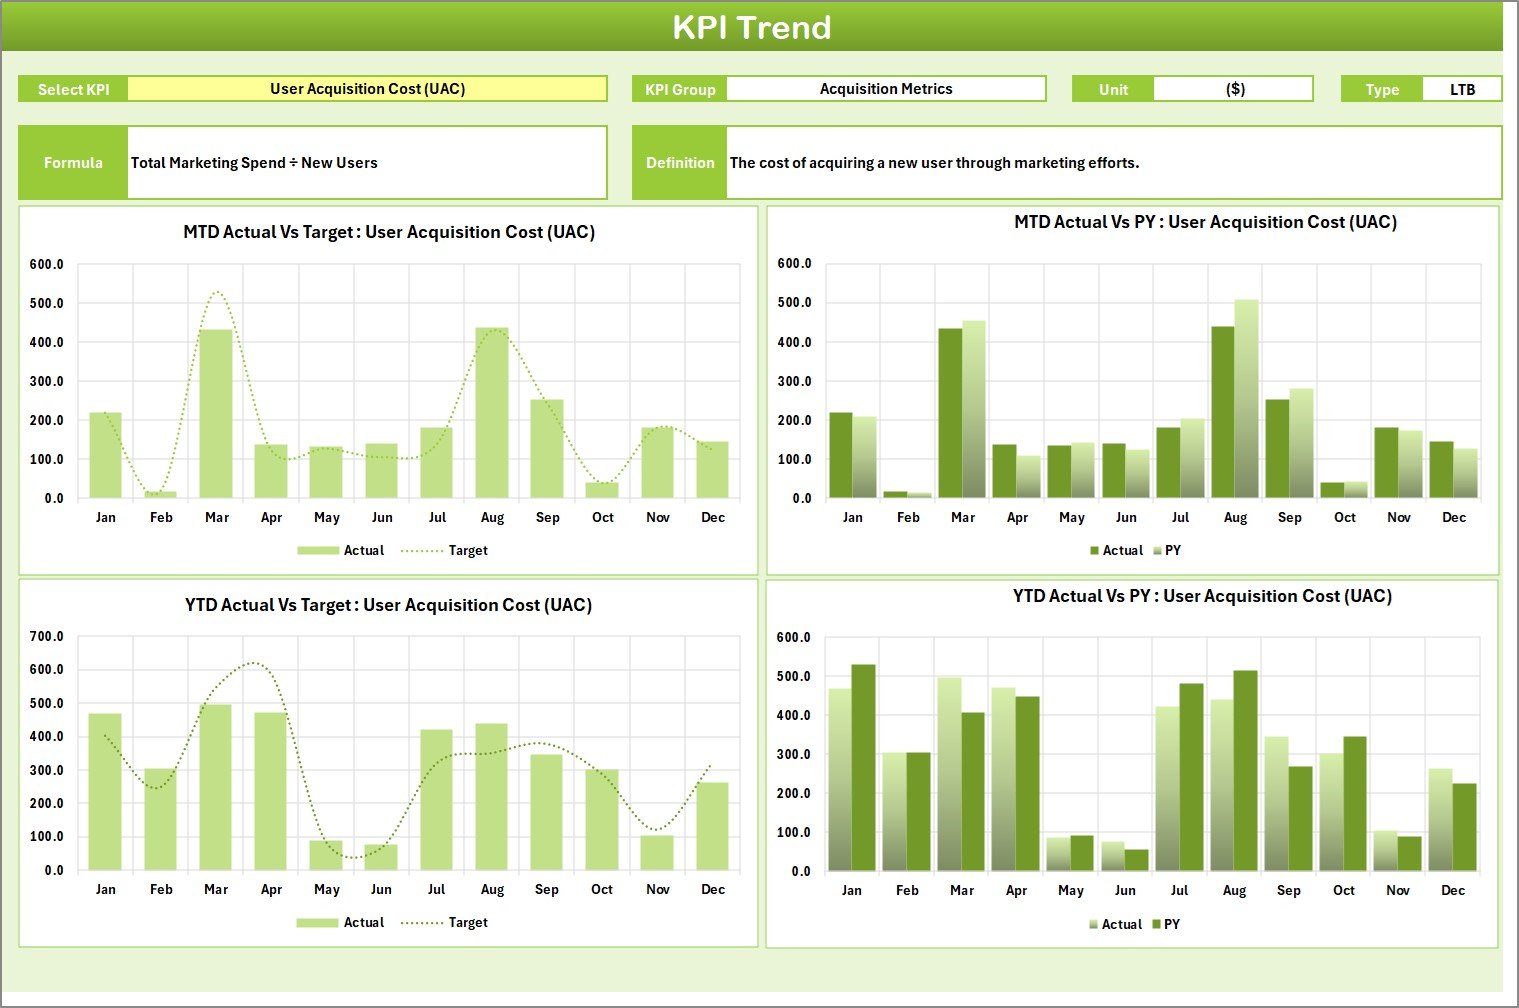
The KPI Trend Sheet gives deeper insights into how each KPI evolves month by month.
-
KPI Selection: Choose any KPI name from the dropdown menu (cell C3) to analyze trends.
-
KPI Metadata: Automatically displays the KPI Group, Unit, Type (LTB or UTB), Formula, and Definition for better understanding.
-
Trend Charts: View interactive charts that plot Actual, Target, and Previous Year (PY) data for both MTD and YTD — helping identify whether performance is improving, stable, or declining.
With this sheet, you can detect early warning signs and opportunities for growth before they impact your business outcomes.
Click to Purchases Mobile App Performance KPI Scorecard in Excel
3️⃣ Input Data Sheet — The Data Engine
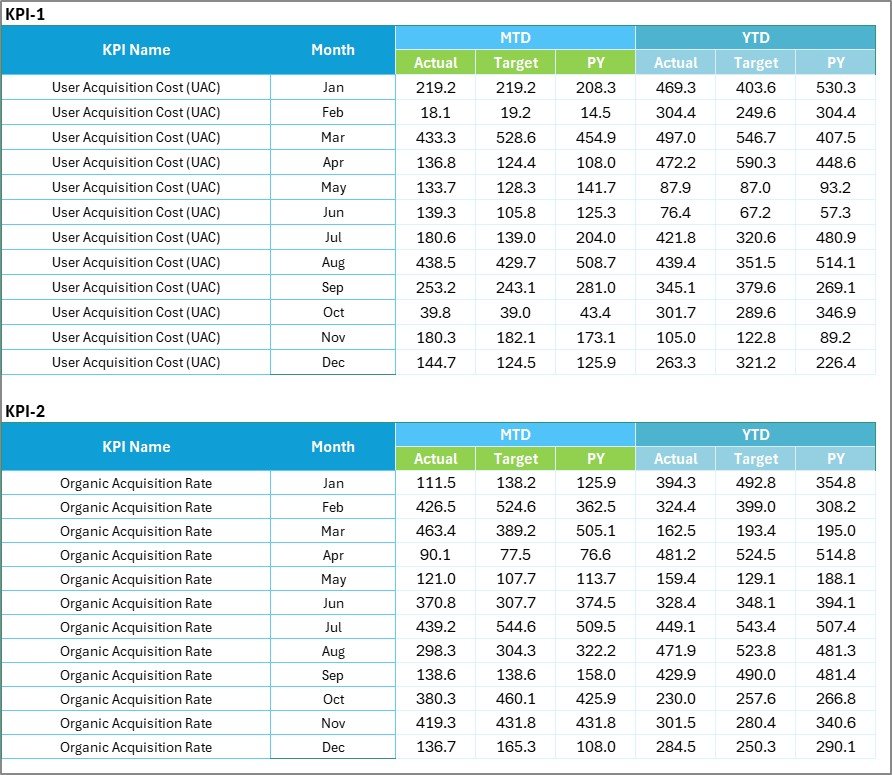
The Input Data Sheet is where you feed all performance numbers that power the scorecard.
Main characteristics:
-
Data Entry Fields: Enter KPI names, months, MTD actuals, YTD totals, and targets.
-
Ease of Use: Add new data monthly — Excel automatically refreshes the scorecard visuals.
-
Flexibility: Adjust KPIs, groups, or periods as needed without rebuilding the file.
This makes the scorecard an adaptable solution suitable for startups, enterprise-level apps, and everything in between.
4️⃣ KPI Definition Sheet — The Knowledge Base
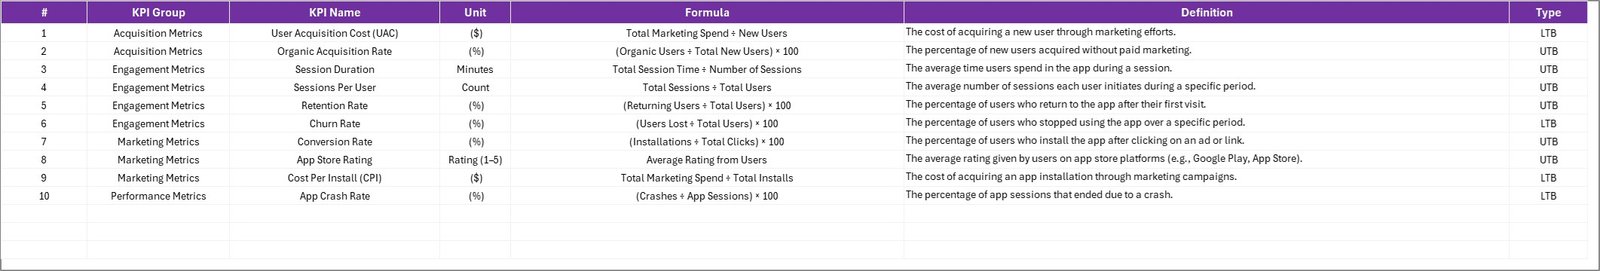
Every professional dashboard should include KPI documentation, and this sheet does just that.
Here, users define:
-
KPI Name
-
KPI Group (e.g., Acquisition, Engagement, Revenue, Performance)
-
Unit (e.g., %, Number, Count, USD)
-
Formula (short and easy to understand)
-
Definition (what the KPI measures and why it matters)
This ensures clarity, consistency, and transparency across all performance discussions.
Why Tracking Mobile App KPIs Matters
Mobile apps operate in highly competitive environments. Tracking KPIs helps app developers and business teams understand not just what is happening, but also why it’s happening.
By maintaining a KPI scorecard, you can:
✅ Identify Growth Opportunities: Know which metrics drive app downloads and user engagement.
✅ Optimize User Experience: Monitor app crashes, retention rates, and uninstalls to enhance usability.
✅ Control Costs: Keep track of revenue, conversion rates, and user acquisition expenses.
✅ Improve Decision-Making: Use real-time insights to refine marketing campaigns and update development strategies.
✅ Benchmark Progress: Compare current and previous months’ data to measure growth and stability.
Common Mobile App KPIs You Can Track
Your Mobile App Performance KPI Scorecard can include a wide range of metrics depending on your business goals. Here are the most essential ones:
1️⃣ Acquisition KPIs
-
App Downloads: Number of installs in a specific period.
-
Cost per Install (CPI): Total marketing cost ÷ number of installs.
-
App Store Conversion Rate: (Downloads ÷ Store Views) × 100
2️⃣ Engagement KPIs
-
Daily Active Users (DAU) and Monthly Active Users (MAU)
-
Session Duration: Average time spent per user session.
-
Screen Views per Session: Indicates depth of engagement.
3️⃣ Retention and Churn KPIs
-
User Retention Rate: Percentage of users returning after the first use.
-
Churn Rate: Percentage of users who stop using the app.
-
Average Session Frequency: How often users open the app each day/week.
4️⃣ Performance KPIs
-
Crash Rate: (Number of Crashes ÷ Total Sessions) × 100
-
App Load Time: Average seconds it takes to launch the app.
-
Error Reports: Frequency of errors or failed transactions.
5️⃣ Revenue KPIs
-
In-App Purchase Revenue: Total revenue generated from purchases.
-
Ad Revenue: Income from advertisements displayed in the app.
-
Customer Lifetime Value (CLV): Expected total revenue from a single user.
-
ARPU (Average Revenue per User): Total revenue ÷ Active users.
All these KPIs can be classified as UTB (Upper the Better) or LTB (Lower the Better) to make analysis simpler.
Click to Purchases Mobile App Performance KPI Scorecard in Excel
Advantages of Using the Mobile App Performance KPI Scorecard in Excel
This Excel-based scorecard brings several key benefits for mobile app teams:
1️⃣ Centralized Performance Tracking
All important KPIs are displayed in one place, reducing the need to toggle between different analytics tools.
2️⃣ Easy-to-Use Interface
With dropdowns, conditional formatting, and ready-made charts, anyone can use this template — no coding required.
3️⃣ Data Comparison Made Simple
Quickly compare Actual vs Target and Current vs Previous Year data to identify trends and areas for improvement.
4️⃣ Real-Time Insights
Update your data and instantly view results through interactive dashboards that refresh automatically.
5️⃣ Visual Alerts
Green and red color indicators instantly show whether performance is above or below target, making it easier to interpret data at a glance.
6️⃣ Scalability
Add more KPIs, months, or departments easily. This scorecard grows with your business.
7️⃣ Cost-Effective
Unlike paid analytics software, this Excel scorecard provides high-quality reporting without ongoing subscription fees.
How to Use the Mobile App Performance KPI Scorecard
1 Enter Data in the Input Sheet:
Fill in monthly actual and target values for each KPI.
2 Define KPIs Clearly:
In the KPI Definition sheet, ensure every KPI includes a formula and unit.
3 View Results in the Scorecard:
Go to the Scorecard tab and use dropdown menus to select your month and MTD/YTD mode.
4 Analyze KPI Trends:
Use the KPI Trend tab to explore changes over time using the trend charts.
5 Review and Share:
Once analysis is complete, you can share or export your Excel report as a PDF or image.
Click to Purchases Mobile App Performance KPI Scorecard in Excel
Best Practices for the Mobile App Performance KPI Scorecard
Follow these guidelines to make the most of your dashboard:
1️⃣ Keep KPIs Relevant
Choose KPIs that align with your business goals. Avoid cluttering your scorecard with too many metrics.
2️⃣ Update Data Regularly
Refresh your data every week or month to maintain accuracy.
3️⃣ Review Thresholds
Revisit your target values periodically to ensure they reflect realistic performance expectations.
4️⃣ Maintain Data Quality
Always check for errors or blank cells before analysis. Inaccurate data can mislead decision-making.
5️⃣ Visual Consistency
Use consistent color codes and icons for positive and negative performance indicators.
6️⃣ Document KPI Definitions
Always maintain clear descriptions and formulas to avoid confusion across teams.
7️⃣ Automate Where Possible
Use Excel formulas and pivot tables to automate calculations instead of doing them manually.
8️⃣ Secure Your File
Protect the file with passwords or share as a read-only version to prevent accidental edits.
Opportunities for Improvement
While the Mobile App Performance KPI Scorecard is powerful, you can make it even better:
-
Integrate it with Power BI for real-time visual dashboards.
-
Link Excel with Google Analytics or Firebase for automated data imports.
-
Add slicers for app version, region, or platform (iOS vs Android).
-
Include benchmarking metrics like competitor comparisons.
-
Build alert systems using conditional formatting or VBA to flag low-performing KPIs.
Who Can Benefit from This Scorecard?
-
App Developers: Track crash rates, load times, and performance stability.
-
Product Managers: Measure feature success and user retention.
-
Marketing Teams: Analyze campaign ROI and acquisition performance.
-
Finance Teams: Monitor revenue, ARPU, and ad income trends.
-
Executives: Get a bird’s-eye view of app performance in one dashboard.
Conclusion
The Mobile App Performance KPI Scorecard in Excel simplifies the complex process of performance monitoring for app-based businesses. It consolidates critical metrics — from downloads to revenue — in one easy-to-understand dashboard.
With built-in trend analysis, visual alerts, and MTD/YTD comparisons, you can stay on top of your app’s success and make data-backed decisions faster than ever.
If you’re looking to transform your app analytics into a streamlined, Excel-based reporting system, this scorecard is the ideal solution — simple, affordable, and effective.
Click to Purchases Mobile App Performance KPI Scorecard in Excel
Frequently Asked Questions (FAQs)
1 What is the Mobile App Performance KPI Scorecard in Excel?
It’s an Excel-based performance monitoring tool that tracks all critical app metrics like downloads, user engagement, revenue, and retention.
2 How many sheets are included in the template?
There are four worksheets — Scorecard, KPI Trend, Input Data, and KPI Definition.
3 Do I need advanced Excel skills to use it?
Not at all. It’s beginner-friendly, with dropdowns, pre-built formulas, and automatic visuals.
4 Can I add my own KPIs?
Yes. You can easily customize the scorecard by adding new KPIs in the definition sheet and entering corresponding data.
5 How often should I update the data?
Monthly updates are recommended for accurate MTD and YTD analysis.
6 Does it support visual indicators?
Yes, conditional formatting adds color-coded icons for quick performance assessment.
7 Is it compatible with Google Sheets?
Yes, you can import it into Google Sheets with minor adjustments to formulas.
8 Can I integrate it with other analytics tools?
You can link Excel to Power BI, Firebase, or Google Analytics for advanced visualization.
9 What are the most important KPIs for mobile apps?
Common KPIs include DAU, MAU, retention rate, churn rate, crash rate, in-app revenue, and CPI.
10 Where can I get this template?
You can download the Mobile App Performance KPI Scorecard in Excel from NextGenTemplates.com and start tracking your app performance instantly.
Click to Purchases Mobile App Performance KPI Scorecard in Excel
Visit our YouTube channel to learn step-by-step video tutorials