In today’s competitive business world, product marketing teams must constantly track performance, measure campaign effectiveness, and make data-driven decisions. Whether you are launching a new product, analyzing customer engagement, or evaluating ROI, having real-time visibility into marketing KPIs is essential.
That’s where the Product Marketing KPI Dashboard in Excel comes in.
It’s a ready-to-use Excel template designed to give marketers a complete picture of their performance — from sales growth and campaign reach to conversion rates and customer satisfaction.
Built entirely in Microsoft Excel, this dashboard provides a user-friendly interface for managing marketing metrics efficiently, without needing complex software or coding.
Click to Purchases Product Marketing KPI Dashboard in Excel
What Is a Product Marketing KPI Dashboard in Excel?
A Product Marketing KPI Dashboard is a structured Excel workbook that consolidates all key performance indicators related to product marketing. It helps marketing teams monitor progress against targets, identify trends, and make informed business decisions.
With dynamic dropdowns, conditional formatting, and automated charts, it transforms raw data into visually appealing, actionable insights.
The dashboard integrates MTD (Month-to-Date) and YTD (Year-to-Date) analyses, giving you both short-term and long-term visibility into your product performance.
Key Features of the Product Marketing KPI Dashboard
This Excel-based dashboard is thoughtfully organized into seven worksheets, each designed for a specific purpose.
Let’s explore the structure in detail:
1️⃣ Home Sheet – The Navigation Hub
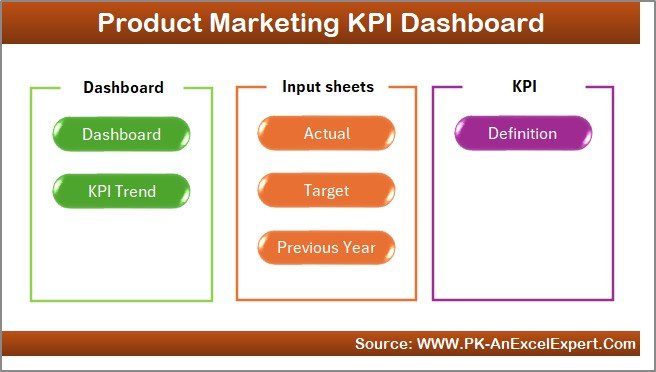
The Home Sheet is the index page where you can navigate to other sections using interactive buttons.
It includes six clickable buttons that instantly take you to corresponding sheets like Dashboard, KPI Trend, Actual Input, Target, Previous Year, and KPI Definition.
This layout ensures smooth navigation even for users who are not Excel experts.
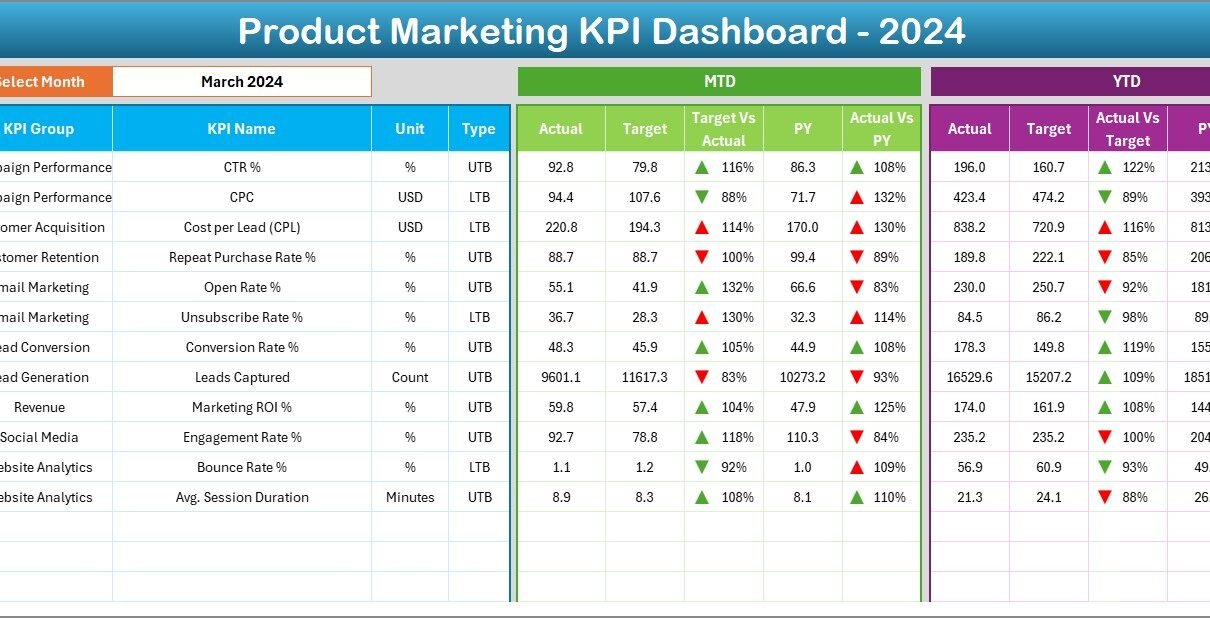
2️⃣ Dashboard Sheet – The Heart of Performance Analysis
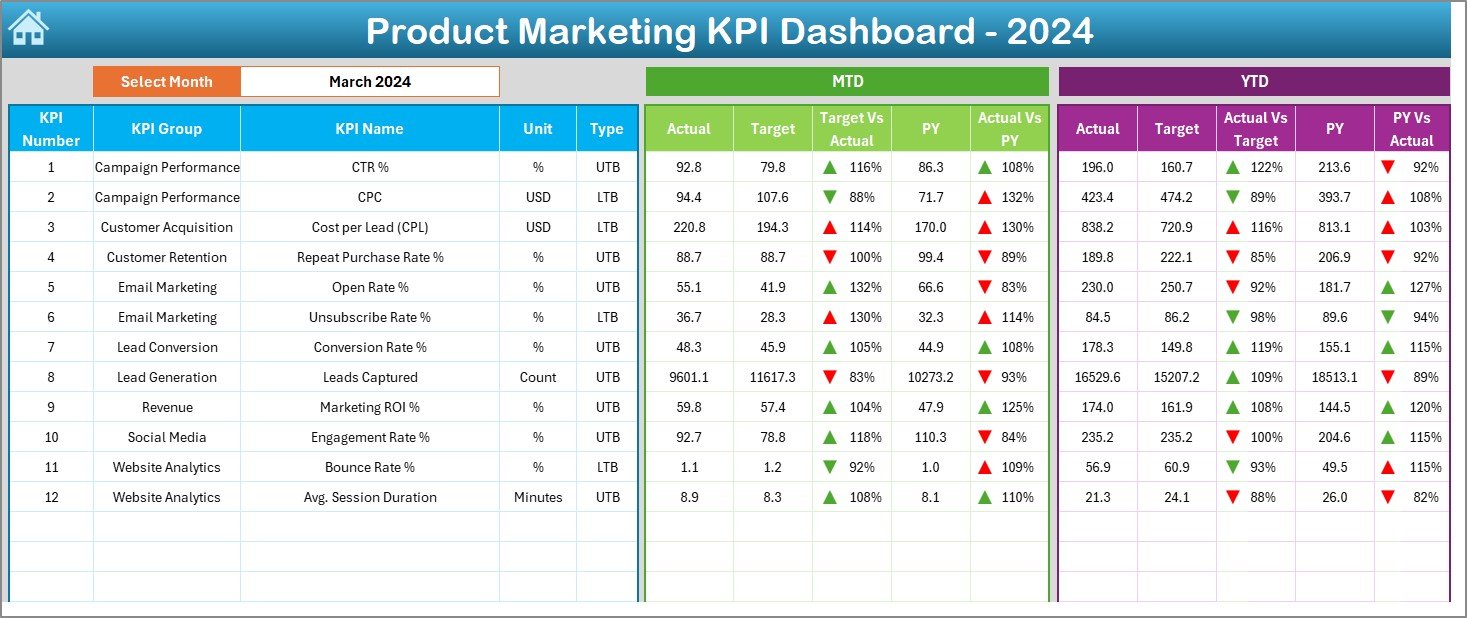
The Dashboard Sheet is the main analytical page where all your KPIs are displayed visually.
Key elements include:
-
📅 Month Selector: Choose the month from a dropdown in cell D3. The entire dashboard automatically updates for that period.
-
📈 Performance Cards: MTD and YTD figures for Actual, Target, and Previous Year data.
-
🎯 Target vs Actual Comparison: Automatic calculations show whether goals are met.
-
🔺🔻 Conditional Formatting: Up/down arrows indicate performance trends in green or red.
-
📊 Visual Representation: Charts and graphs display marketing trends clearly and attractively.
This sheet offers a one-page overview of all KPIs, making it ideal for reporting and presentation.
Click to Purchases Product Marketing KPI Dashboard in Excel
3️⃣ KPI Trend Sheet – Visualize KPI Movement Over Time
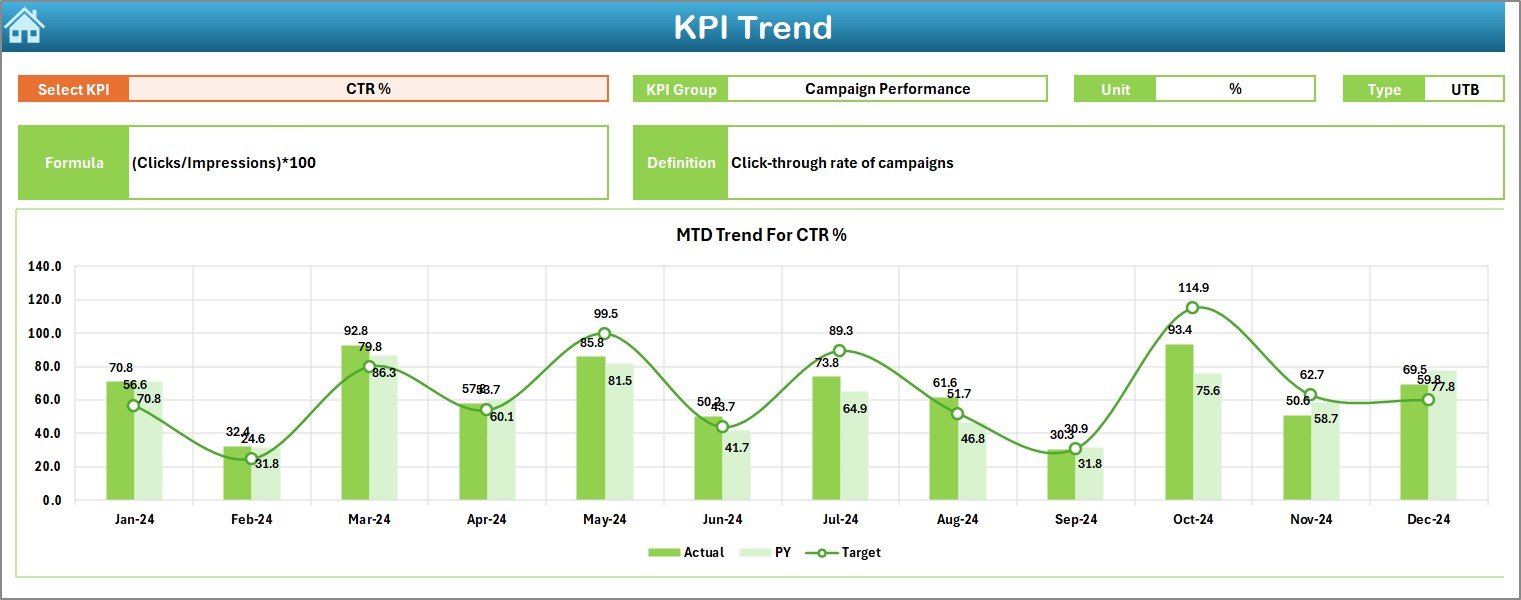
The KPI Trend Sheet is where users can dig deeper into each KPI’s performance.
-
Use the dropdown in cell C3 to select any KPI.
-
Instantly view:
-
KPI Group (e.g., Sales, Campaigns, Revenue)
-
Unit of Measure (% or Number)
-
KPI Type (Lower the Better or Upper the Better)
-
Formula Used
-
KPI Definition
-
Below these details, you’ll find dynamic MTD and YTD trend charts comparing Actual, Target, and Previous Year (PY) data.
This helps marketing managers identify progress patterns and seasonal fluctuations easily.
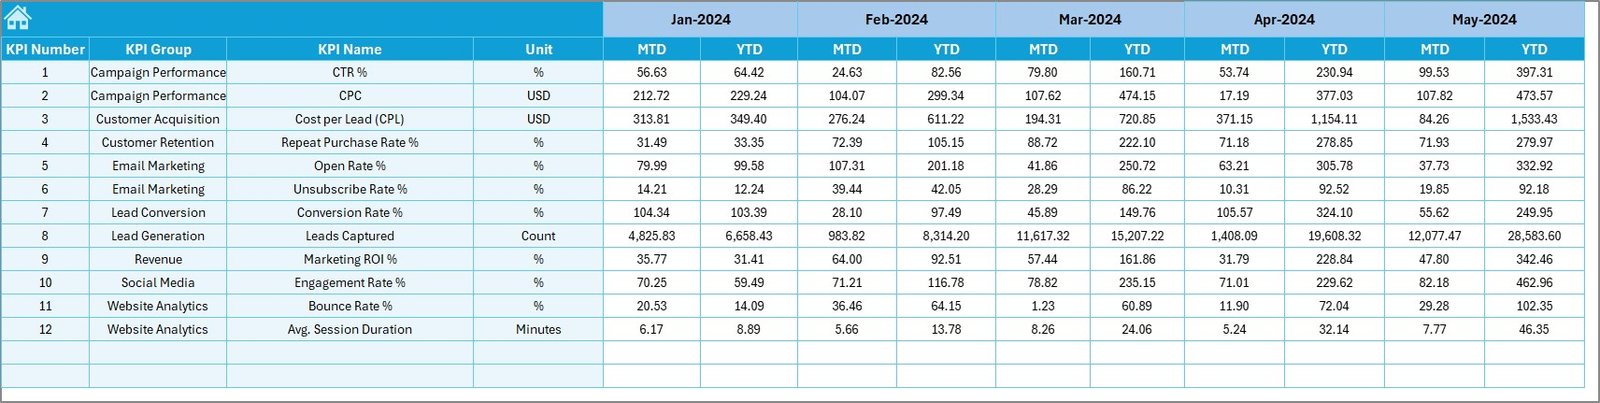
4️⃣ Actual Numbers Input Sheet – Capture Real-Time Performance
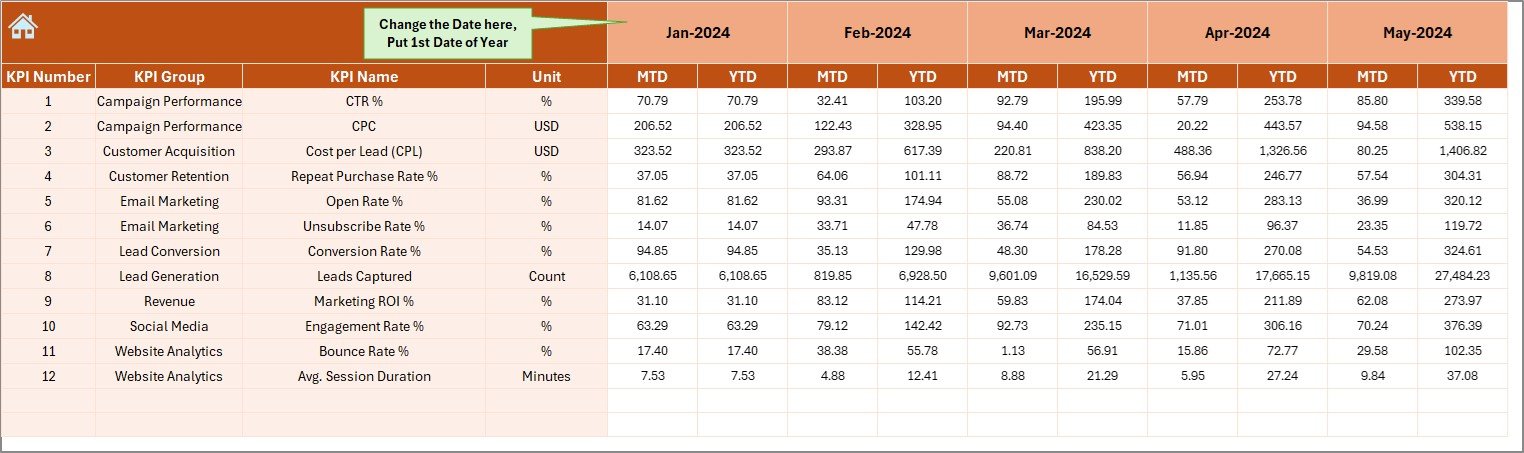
This sheet is where you enter the actual results for your KPIs.
Features:
-
Columns for KPI Name, Month, MTD Actual, and YTD Actual.
-
The month selection starts from cell E1 — simply enter the first month of the financial year.
-
Automatically integrates with the dashboard visuals.
Accurate data entry in this sheet keeps the entire system up to date.
5️⃣ Target Sheet – Set Performance Benchmarks
Every KPI must have a goal. In this sheet, you can define monthly and yearly targets for each metric.
Both MTD and YTD targets are captured here.
This sheet ensures that every performance indicator has a measurable benchmark for comparison.
6️⃣ Previous Year Numbers Sheet – Compare Historical Performance
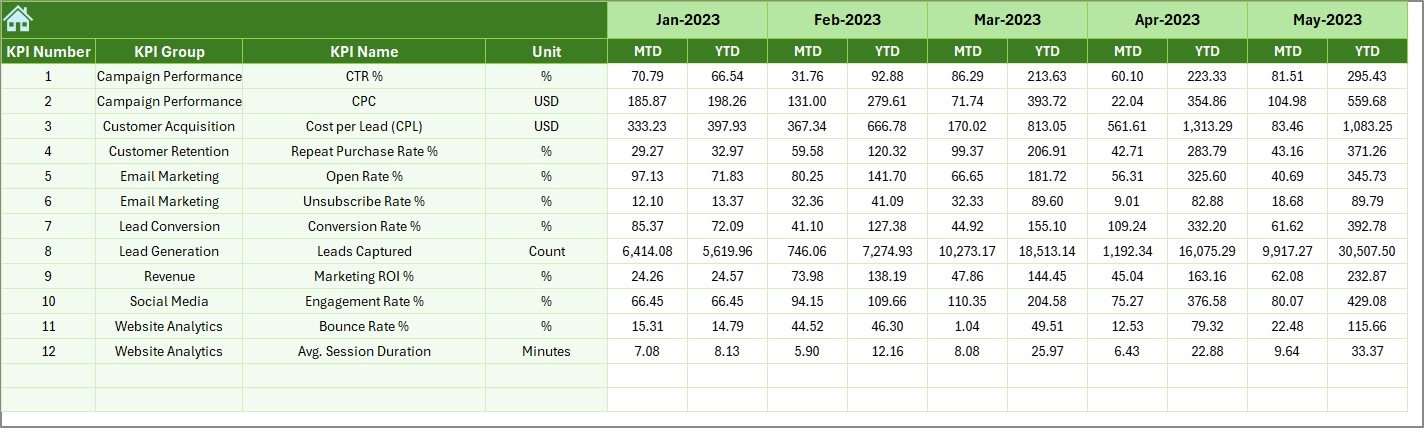
Benchmarking against the previous year’s results helps assess growth.
In this sheet, input last year’s MTD and YTD data for each KPI, following the same structure as current year sheets.
The dashboard automatically calculates CY vs PY comparisons for both MTD and YTD.
Click to Purchases Product Marketing KPI Dashboard in Excel
7️⃣ KPI Definition Sheet – Maintain Consistency and Clarity
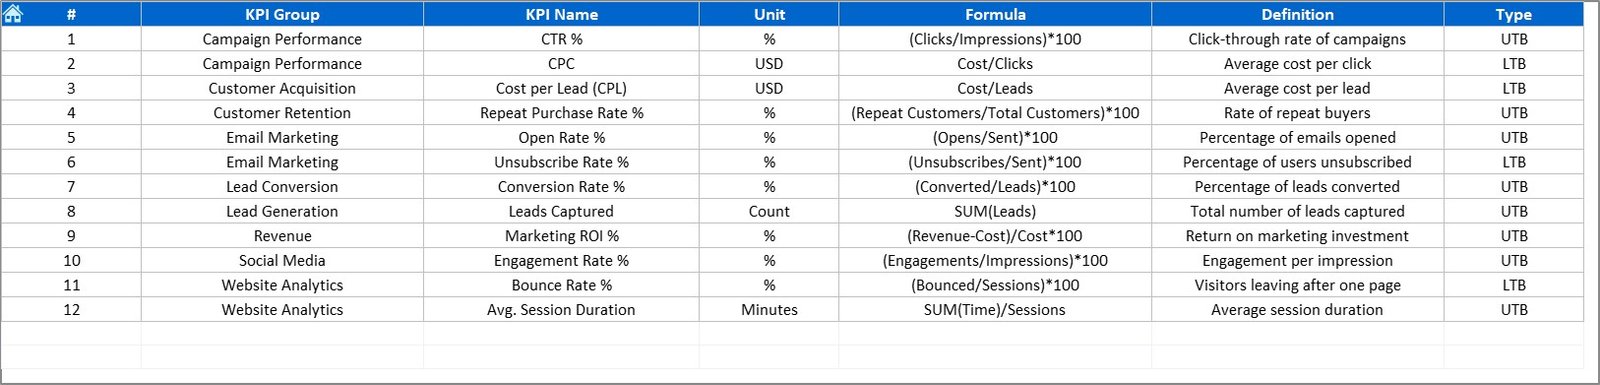
This is your reference library of all KPIs used in the dashboard.
Each row defines:
-
KPI Name
-
KPI Group
-
Unit of Measurement
-
Formula
-
Definition
-
Type (LTB or UTB)
Maintaining this sheet ensures uniform understanding across your marketing and analytics teams.
Click to Purchases Product Marketing KPI Dashboard in Excel
Benefits of the Product Marketing KPI Dashboard in Excel
Using this dashboard provides a structured way to track marketing success and optimize strategies.
1. Comprehensive Data Visibility
Get a holistic view of performance across campaigns, product lines, and time periods.
2. Real-Time Decision-Making
Instant updates allow teams to identify underperforming KPIs and take corrective actions quickly.
3. Easy to Use
No coding or Power BI expertise is required. Excel’s built-in formulas and visuals make it user-friendly.
4. Time-Saving Automation
All calculations — such as Target vs Actual and PY vs CY — are automated.
5. Visual Clarity
Conditional formatting and trend charts make complex data easy to interpret.
6. Adaptable Structure
Add or modify KPIs as your marketing strategies evolve.
Key KPIs to Track in Product Marketing
Below are examples of essential KPIs you can track using this Excel dashboard:
Marketing Performance KPIs
-
Campaign ROI (%) – Measures the return generated from marketing investment.
-
Cost per Lead ($) – Tracks how efficiently your campaigns generate leads.
-
Customer Acquisition Cost (CAC) – Calculates how much it costs to acquire a new customer.
-
Lead Conversion Rate (%) – Monitors the effectiveness of sales funnels.
-
Product Awareness (%) – Measures brand visibility within target markets.
Sales & Revenue KPIs
-
Revenue Growth (%) – Monitors increase in total product revenue over time.
-
Units Sold (Count) – Tracks the total number of items sold.
-
Average Order Value ($) – Measures revenue per transaction.
-
Sales by Region (%) – Compares performance across different territories.
Customer Experience KPIs
-
Customer Retention Rate (%) – Tracks how many existing customers stay loyal.
-
Net Promoter Score (NPS) – Measures customer satisfaction and likelihood to recommend.
-
Refund Rate (%) – Indicates product or service quality issues.
Tracking these KPIs helps identify which campaigns perform best and where improvements are needed.
Advantages of Using the Product Marketing KPI Dashboard
1️⃣ Clear Performance Measurement
Understand exactly how your marketing activities impact revenue, customer engagement, and product visibility.
2️⃣ Simplified Reporting
Generate monthly or quarterly reports in seconds using built-in charts and slicers.
3️⃣ Enhanced Accountability
Each KPI has clear ownership and measurable results.
4️⃣ Faster Insights
MTD and YTD views highlight performance trends instantly.
5️⃣ Cost-Effective Solution
Excel-based dashboards eliminate the need for expensive software.
6️⃣ Strategic Alignment
Aligns marketing efforts with company goals by visualizing actual vs target outcomes.
Click to Purchases Product Marketing KPI Dashboard in Excel
Best Practices for Using the Product Marketing KPI Dashboard
To make the most out of your Excel dashboard, follow these recommended practices:
1. Keep KPI Definitions Clear
Document each KPI’s purpose and formula in the KPI Definition sheet to avoid confusion.
2. Update Data Monthly
Enter new Actual and Target data consistently for accurate trend analysis.
3. Use Conditional Formatting Wisely
Highlight critical metrics (like below-target performance) with visual cues.
4. Focus on Key KPIs
Avoid overloading the dashboard with too many indicators — track the ones that matter most.
5. Validate Data Sources
Ensure Actual and Target data are pulled from reliable systems.
6. Use the Trend Sheet for Insights
Analyze MTD and YTD trends to adjust marketing campaigns proactively.
7. Share Reports Effectively
Convert your Excel dashboard to PDF or share it via OneDrive for stakeholder access.
How to Use the Dashboard Step by Step
-
Start with the KPI Definition Sheet – Define your KPIs, formulas, and units.
-
Enter Targets – Populate the Target Sheet for each KPI.
-
Input Actual Data – Update the Actual Numbers sheet monthly.
-
Add Previous Year Data – Maintain consistency for year-over-year comparisons.
-
Use the Dashboard Sheet – Select the desired month and analyze MTD/YTD visuals.
-
Explore Trends – Drill into individual KPIs on the KPI Trend Sheet.
-
Review and Optimize – Use insights to adjust campaigns and improve performance.
How the Dashboard Supports Decision-Making
The Product Marketing KPI Dashboard helps marketing leaders answer key questions such as:
-
Which product lines are performing above or below target?
-
How effective are current marketing campaigns?
-
Are we spending efficiently on promotions?
-
What trends can we leverage for future launches?
By consolidating marketing and sales data into one Excel workbook, it enables smarter, faster, and more informed decisions.
Conclusion
The Product Marketing KPI Dashboard in Excel is more than just a reporting template — it’s a comprehensive performance management tool. It allows marketers to measure, visualize, and optimize campaigns in one place.
With its intuitive structure, automated calculations, and dynamic charts, it saves time and improves accuracy.
Whether you are a startup tracking your first product launch or a large enterprise managing global campaigns, this dashboard helps you stay on top of your marketing performance.
Measure what matters, analyze intelligently, and accelerate your product success — all within Excel.
Frequently Asked Questions (FAQs)
1. Who should use the Product Marketing KPI Dashboard?
Marketing managers, product teams, and business analysts who want to monitor performance, ROI, and growth in real time.
2. Can I customize the KPIs?
Yes. You can easily add, remove, or modify KPIs in the Definition sheet.
3. Does this dashboard track both MTD and YTD?
Absolutely. It displays Month-to-Date and Year-to-Date results side by side for better analysis.
4. What is the data source for this dashboard?
The data source is an Excel file with dedicated sheets for Actual, Target, and Previous Year data.
5. Is this suitable for non-technical users?
Yes. The dashboard is built entirely in Excel — no advanced Power BI or VBA skills required.
Click to Purchases Product Marketing KPI Dashboard in Excel
Visit our YouTube channel to learn step-by-step video tutorials