In today’s fast-moving retail environment, the success of grocery delivery businesses depends on efficiency, speed, and customer satisfaction. With multiple delivery partners, regions, and payment modes, analyzing operational performance can become complex. That’s why the Grocery Delivery Services Dashboard in Excel is an essential tool for modern delivery businesses.
This ready-to-use Excel dashboard consolidates delivery data, profit analysis, and customer feedback into a single, interactive platform — helping managers and analysts make data-driven decisions with ease. In this article, we’ll explore its structure, features, benefits, and best practices to optimize your grocery delivery operations.
Click to Purchases Grocery Delivery Services Dashboard in Excel
What Is a Grocery Delivery Services Dashboard in Excel?
A Grocery Delivery Services Dashboard in Excel is a comprehensive performance management template designed to monitor and analyze all aspects of grocery delivery operations.
It combines delivery data, regional insights, customer ratings, and profitability metrics into visual dashboards with slicers and charts. Managers can quickly identify top-performing partners, track on-time deliveries, measure profit margins, and improve customer satisfaction.
The dashboard offers a page navigator, allowing users to move seamlessly between different analytical pages — all within one Excel file.
Structure of the Dashboard
The dashboard consists of five interactive analytical pages and two support sheets. Each page is designed to analyze a specific area of grocery delivery performance — from profitability to regional trends.
Page Navigator (Left Side Panel)
A unique feature of this dashboard is the Page Navigator located on the left side. It works like an interactive menu, allowing you to move between the dashboard’s key pages effortlessly:
-
Overview
-
Delivery Partner Analysis
-
Payment Mode Analysis
-
Region Analysis
-
Monthly Trends
This structure provides a clean and intuitive interface — users can focus on insights instead of searching through worksheets manually.
Click to Purchases Grocery Delivery Services Dashboard in Excel
1. Overview Page — The Performance Snapshot

The Overview Page is the main dashboard where you can see a high-level summary of your grocery delivery performance.
On the right-side slicer panel, users can filter data by Month, Region, Delivery Partner, or Payment Mode, instantly updating the visuals across the page.
Key Elements:
-
Five KPI Cards:
Display quick metrics such as:-
Total Orders
-
Total Revenue (USD)
-
Profit Margin (%)
-
On-Time Deliveries (%)
-
Average Customer Rating
-
-
Charts on the Page:
-
Profit by Payment Mode – Helps compare which payment options generate the most profit.
-
Delivered Delivery Status (%) – Shows the proportion of successful deliveries.
-
Returned Delivery Status (%) by Payment Mode – Analyzes failed or returned deliveries by payment type.
-
Order Value (USD) by Delivery Status – Highlights financial performance by status categories (Delivered, Returned, Cancelled).
-
This page provides a bird’s-eye view of operations, helping decision-makers quickly assess financial and operational health.
2. Delivery Partner Analysis — Comparing Partner Performance

Delivery partners play a crucial role in grocery delivery success. This page provides a dedicated view to analyze partner-level performance and efficiency.
Features:
-
Slicer Panel (Right Side):
Filter results by region, month, or delivery partner. -
Key Charts:
-
Order Value (USD) by Delivery Partner – Compares contribution of each partner to total sales.
-
Profit Margin (%) by Delivery Partner – Identifies which partners are most cost-effective.
-
Average Customer Rating by Delivery Partner – Reflects service quality and satisfaction levels.
-
Cancelled vs. Returned Deliveries by Partner – Highlights operational issues such as delays or mismanagement.
-
This analysis enables management to reward high-performing partners and coach those underperforming.
3. Payment Mode Analysis — Financial and Operational Insights

Payment methods can significantly influence transaction costs, speed, and customer satisfaction. This section focuses on comparing metrics across payment modes like Cash on Delivery (COD), Credit/Debit Cards, and Digital Wallets.
Charts Included:
-
Order Value (USD) by Payment Mode – Understand which modes drive higher sales volume.
-
Profit Margin (%) by Payment Mode – Compare profitability across payment options.
-
Delivery Time (Hours) by Payment Mode – Measure how payment methods affect delivery speed.
-
Average Customer Rating by Payment Mode – Discover which payment experience customers prefer.
These visuals help businesses refine payment strategies — for instance, encouraging faster, more profitable digital payments over slower COD transactions.
4. Region Analysis — Geographic Performance View
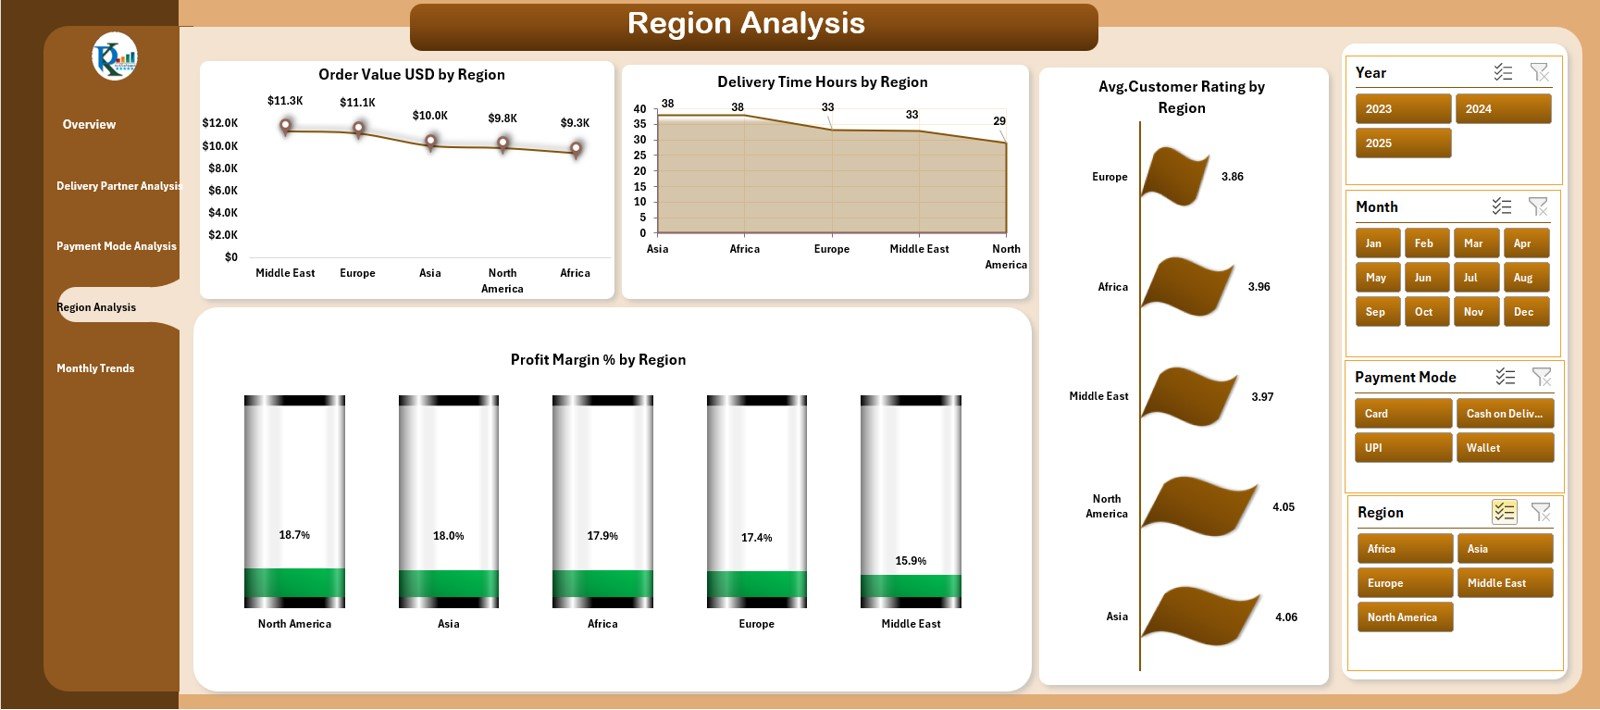
Every delivery region has unique dynamics — order density, delivery time, and profitability vary across locations. The Region Analysis Page provides regional comparisons to improve logistical planning.
Charts Included:
-
Order Value (USD) by Region – Identifies top-performing areas by revenue.
-
Delivery Time (Hours) by Region – Evaluates efficiency and helps allocate resources to slower regions.
-
Profit Margin (%) by Region – Measures profitability variation by geography.
-
Average Customer Rating by Region – Assesses service quality differences across locations.
Using this data, managers can optimize resource allocation, improve delivery networks, and enhance regional performance.
Click to Purchases Grocery Delivery Services Dashboard in Excel
5. Monthly Trends — Time-Based Analysis
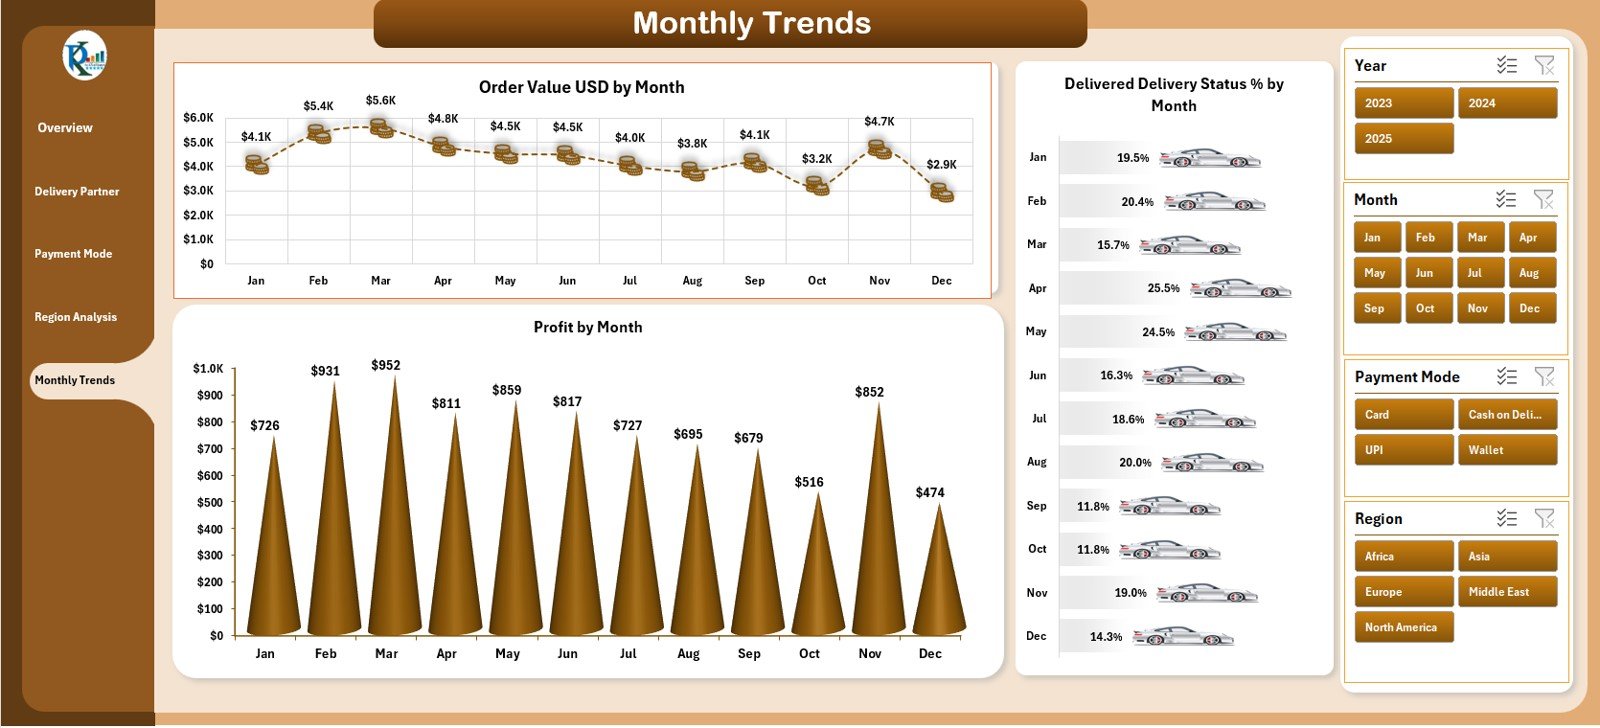
The Monthly Trends Page focuses on performance over time. It provides valuable insights into seasonality, operational improvements, and customer demand patterns.
Charts on the Page:
-
Order Value (USD) by Month – Tracks sales trends and peak periods.
-
Delivery Time (Hours) by Month – Identifies efficiency improvements or delays over time.
-
Profit Margin (%) by Month – Shows profitability growth or decline trends.
-
Average Customer Rating by Month – Measures customer satisfaction over the year.
This page helps in forecasting, budget planning, and target setting for upcoming months.
Support Sheets
1. Data Sheet
This sheet contains all transactional and performance data that powers the dashboard. Each record includes details such as:
-
Order ID
-
Customer Name
-
Delivery Partner
-
Region
-
Payment Mode
-
Order Value
-
Delivery Status
-
Profit Margin
-
Customer Rating
This raw data is the foundation for all pivot tables and charts in the dashboard.
2. Support Sheet
The Support Sheet stores master data lists used for dropdowns and slicers — such as:
-
Delivery Partners List
-
Regions
-
Payment Modes
-
Delivery Status Codes
It ensures consistent data entry and enhances dashboard automation.
Advantages of Grocery Delivery Services Dashboard in Excel
1. Complete Operational Visibility
The dashboard centralizes every critical metric — from delivery times to profit margins — into one view.
2. Real-Time Decision Support
Dynamic charts and slicers update instantly with each data refresh, giving managers quick insights into current performance.
3. Partner Accountability
Detailed partner analysis ensures fair performance evaluation and helps strengthen collaborations.
4. Financial Optimization
Comparing profit margins across payment modes and regions helps identify cost-saving opportunities.
5. Customer Satisfaction Monitoring
By tracking ratings and return rates, businesses can pinpoint customer pain points and resolve them proactively.
6. Region-Wise Planning
Regional insights guide expansion strategies, delivery zone optimization, and staffing.
7. Simple, Accessible Format
Built entirely in Excel, it requires no additional software or advanced skills to use.
Use Cases
-
Grocery Chains: To track online delivery performance and regional sales.
-
Logistics Firms: To analyze delivery partner efficiency.
-
Startups: To understand customer preferences and optimize payment modes.
-
Retail Managers: To monitor profit margins, delivery times, and satisfaction trends.
This dashboard is suitable for any business delivering perishable or daily-need goods where speed and accuracy are crucial.
Click to Purchases Grocery Delivery Services Dashboard in Excel
Best Practices for Using the Dashboard
1. Keep Data Updated
Regularly refresh the data sheet to ensure accuracy in reports and trends.
2. Use Consistent Data Formats
Maintain consistent date and numeric formats to avoid calculation errors.
3. Analyze Trends Monthly
Review performance at the end of every month to make proactive operational changes.
4. Compare Partners Fairly
Use delivery status, profit margin, and customer ratings together for balanced partner assessments.
5. Automate Data Input
If possible, connect Excel with your order management system to automate data entry.
6. Secure the File
Restrict editing access to sensitive financial or performance data.
7. Present Visually
Export charts to PowerPoint or PDF for executive reviews and performance meetings.
Why Choose Excel for Grocery Delivery Analytics?
-
Universal Compatibility: Every business uses Excel — no special tools required.
-
Customization Flexibility: Add or remove KPIs, charts, or pages as needed.
-
Offline Accessibility: Analyze data even without an internet connection.
-
Familiar Interface: Easy for non-technical users to interpret.
-
Cost-Effective: No licensing or additional software costs.
Excel’s built-in functions, slicers, and charts make it an excellent platform for operational dashboards.
Conclusion
The Grocery Delivery Services Dashboard in Excel is more than a reporting tool — it’s a strategic solution for data-driven business management. By consolidating KPIs related to delivery performance, profitability, and customer satisfaction, it helps grocery delivery companies stay efficient, competitive, and customer-focused.
Whether you’re managing hundreds of daily orders or optimizing a regional delivery network, this Excel dashboard empowers you to make faster, smarter, and more profitable decisions.
Frequently Asked Questions (FAQs)
1. What is a Grocery Delivery Services Dashboard?
It’s an Excel-based tool that tracks and visualizes performance metrics like delivery time, profit margin, and customer satisfaction.
2. Can this dashboard be customized for other delivery services?
Yes. You can easily adapt it for courier, meal, or e-commerce delivery businesses by updating KPIs and categories.
3. How often should I update the data?
It’s best to refresh data weekly or monthly depending on your delivery volume.
4. Do I need advanced Excel skills to use it?
No. The dashboard uses standard Excel features like slicers, charts, and pivot tables — all beginner-friendly.
5. Can I add new regions or delivery partners?
Yes. Simply update the Support Sheet to include new regions or partner names.
6. Does it calculate profit margins automatically?
Yes. Enter order values and costs, and Excel automatically calculates profit margins using embedded formulas.
7. Is it compatible with Excel online or Google Sheets?
While optimized for Excel desktop, it can work in Excel Online with limited interactivity.
Click to Purchases Grocery Delivery Services Dashboard in Excel
Visit our YouTube channel to learn step-by-step video tutorials