Additive manufacturing, commonly known as 3D printing, has transformed modern manufacturing. Industries such as aerospace, automotive, healthcare, and consumer goods increasingly rely on additive manufacturing to produce complex components quickly and efficiently. However, managing additive manufacturing operations requires careful monitoring of production costs, machine performance, material usage, and quality metrics.
Because additive manufacturing environments generate large volumes of operational data, businesses must organize this information effectively. Without a centralized analytics system, managers struggle to identify production issues, monitor efficiency, or track cost trends.
Therefore, organizations need a powerful analytics solution that converts manufacturing data into actionable insights. This is exactly where the Additive Manufacturing Dashboard in Power BI becomes extremely valuable.
Click to Purchases Additive Manufacturing Dashboard in Power BI
The Additive Manufacturing Dashboard in Power BI is a dynamic business intelligence solution designed to help manufacturers monitor production performance, analyze costs, track build quality, and evaluate operational efficiency across different plants, departments, materials, and shifts.
Because Power BI offers interactive visualization, real-time insights, and powerful data modeling, organizations can quickly detect inefficiencies and make data-driven decisions.
In this comprehensive guide, you will learn everything about the Additive Manufacturing Dashboard in Power BI, including its features, benefits, dashboard pages, best practices, and frequently asked questions.
What Is an Additive Manufacturing Dashboard in Power BI?
An Additive Manufacturing Dashboard in Power BI is a data visualization and performance monitoring tool that consolidates production data from multiple sources and displays it in an interactive dashboard.
Instead of reviewing multiple spreadsheets or manual reports, managers can view all critical manufacturing metrics in one centralized dashboard.
The dashboard typically tracks key metrics such as:
-
Production cost
-
Build time
-
Quality performance
-
Maintenance expenses
-
Production output
-
Department performance
-
Material usage
Because the dashboard uses interactive slicers and filters, users can easily drill down into specific plants, departments, shifts, or product categories.
As a result, decision-makers gain clear visibility into manufacturing performance, which helps them optimize operations and reduce costs.
Why Do Manufacturers Need an Additive Manufacturing Dashboard?
Additive manufacturing operations involve several complex processes. Companies must track machine performance, material consumption, production output, and maintenance activities.
However, many organizations still rely on manual reporting systems. Consequently, data remains scattered across multiple files and systems.
This situation often leads to several problems:
-
Delayed performance reporting
-
Lack of operational transparency
-
Difficulty identifying production bottlenecks
-
Limited ability to monitor quality metrics
-
Inefficient cost management
Therefore, organizations need a structured analytics solution.
An Additive Manufacturing Dashboard in Power BI solves these challenges by providing real-time insights, automated reporting, and interactive analytics.
Key Features of the Additive Manufacturing Dashboard in Power BI
The Additive Manufacturing Dashboard in Power BI includes five analytical pages that provide a comprehensive overview of manufacturing performance.
Each page focuses on a specific aspect of production operations.
Let us explore these pages in detail.
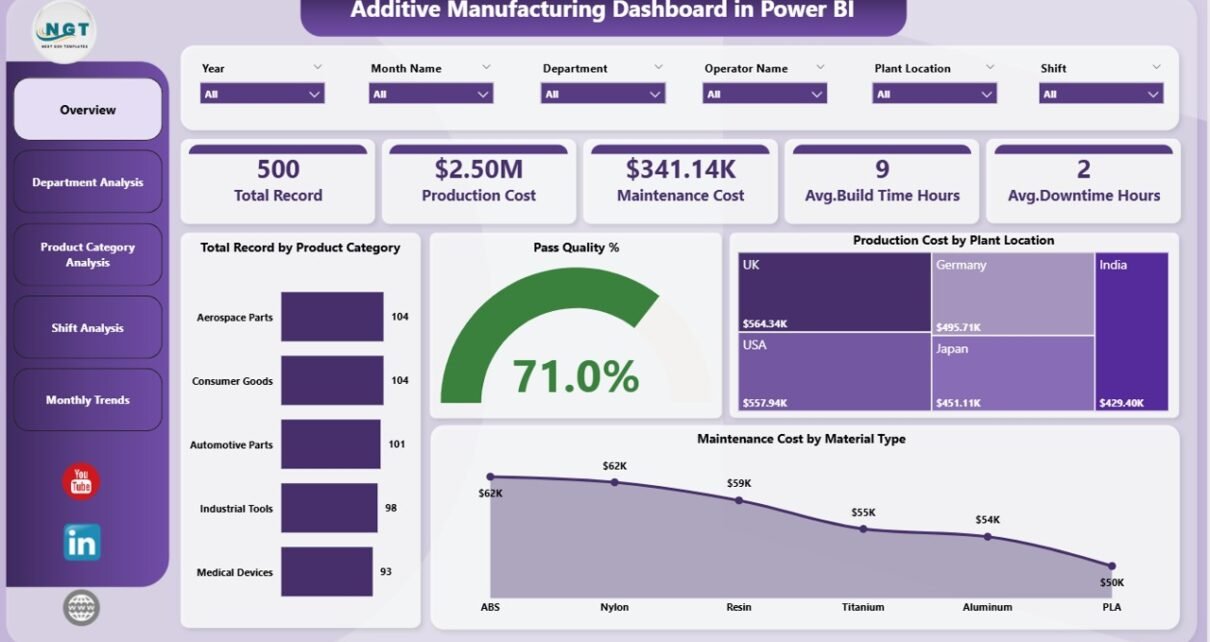
1. Overview Page – How Can You Monitor Overall Manufacturing Performance?
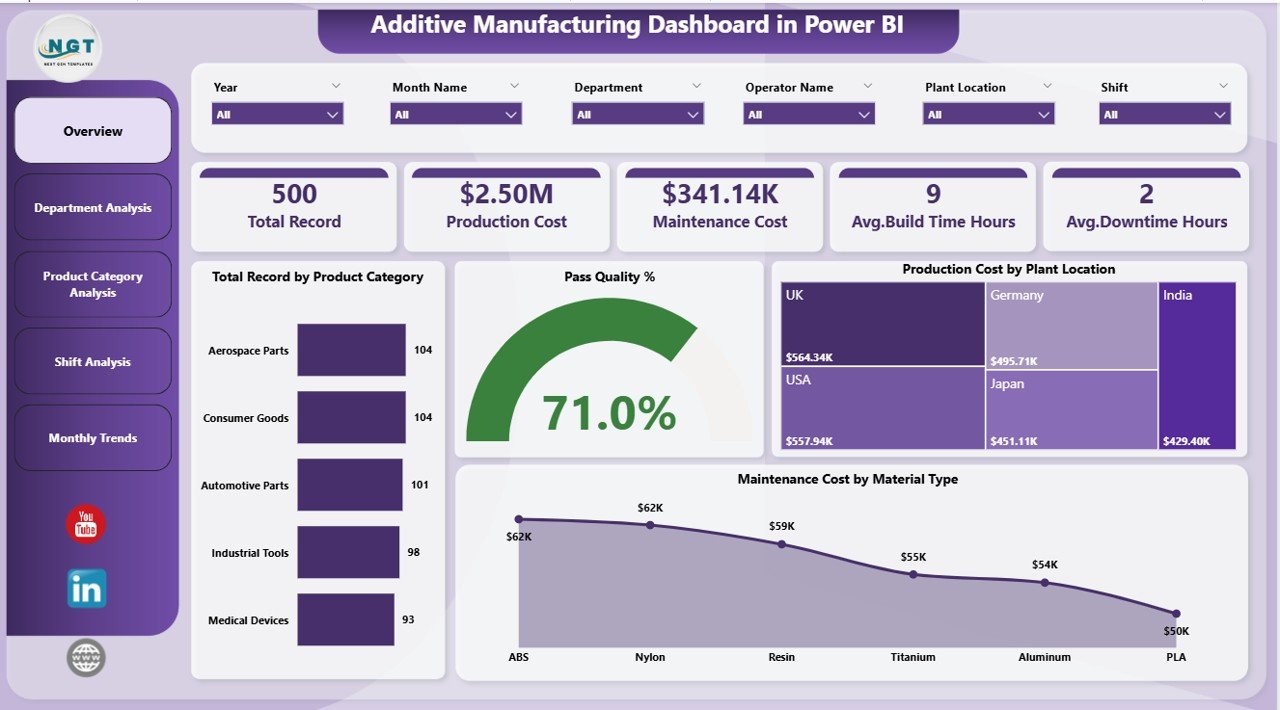
The Overview Page acts as the central monitoring interface of the dashboard. It provides a high-level summary of manufacturing performance metrics.
Because this page displays the most important KPIs, managers can quickly understand the overall operational status.
Key KPI Cards on the Overview Page
The dashboard includes five important KPI cards:
-
Total Record by Product Category
Displays the number of production records associated with each product category. -
Pass Quality %
Shows the percentage of products that successfully passed quality inspections. -
Production Cost by Plant Location
Displays total manufacturing cost across different plant locations. -
Maintenance Cost by Material Type
Highlights maintenance expenses associated with different materials used in production. -
Total Production Records
Represents the total number of manufacturing activities recorded in the system.
Why Is the Overview Page Important?
The Overview Page helps managers:
-
Understand overall production performance quickly
-
Monitor quality performance
-
Identify cost trends
-
Detect potential operational issues
Because this page consolidates the most critical KPIs, it acts as a manufacturing command center.
2. Department Analysis – How Can You Evaluate Department Performance?

Different departments contribute to additive manufacturing operations. Therefore, managers must monitor department-level performance to ensure operational efficiency.
The Department Analysis Page focuses on analyzing manufacturing activities across departments.
Charts Included in Department Analysis
The dashboard includes three important charts:
-
Total Record by Department
Displays production activity distribution across departments. -
Maintenance Cost by Department
Shows maintenance expenses associated with each department. -
Production Cost by Department
Highlights manufacturing cost variations across departments.
Why Is Department Analysis Important?
Department-level analytics helps organizations:
-
Identify high-cost departments
-
Monitor maintenance efficiency
-
Optimize departmental productivity
-
Improve operational coordination
Consequently, managers can implement targeted improvement strategies.
Click to Purchases Additive Manufacturing Dashboard in Power BI
3. Product Category Analysis – How Can You Analyze Product Performance?
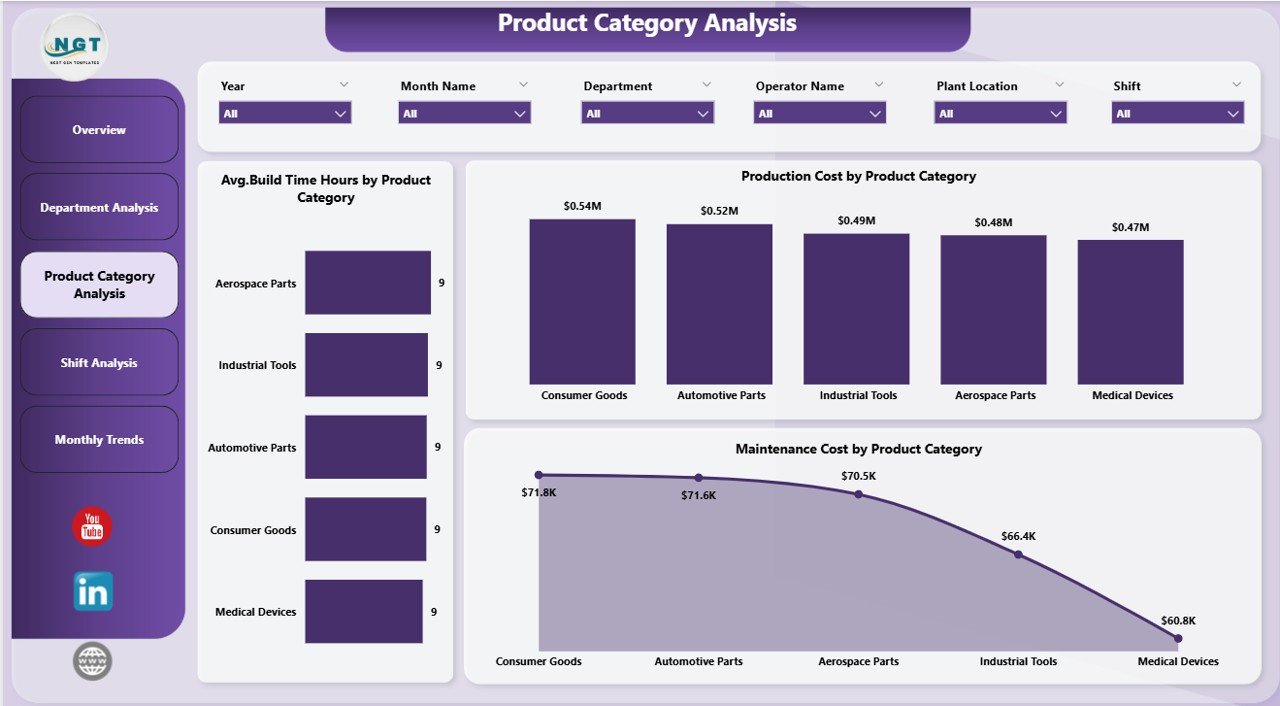
Manufacturers often produce multiple product categories using additive manufacturing technology.
Each product category may require different materials, machine configurations, and build times. Therefore, product-level performance monitoring becomes essential.
The Product Category Analysis Page provides insights into manufacturing metrics for each product category.
Charts Included in Product Category Analysis
This page includes three key analytical charts:
-
Average Build Time (Hours) by Product Category
Displays how long each product category takes to build. -
Maintenance Cost by Product Category
Shows maintenance expenses related to each product category. -
Production Cost by Product Category
Highlights cost variations across different product categories.
Benefits of Product Category Analysis
This analysis helps organizations:
-
Identify expensive product categories
-
Optimize production planning
-
Monitor build efficiency
-
Improve product cost management
As a result, companies can improve profitability.
4. Shift Analysis – How Does Production Performance Change Across Shifts?
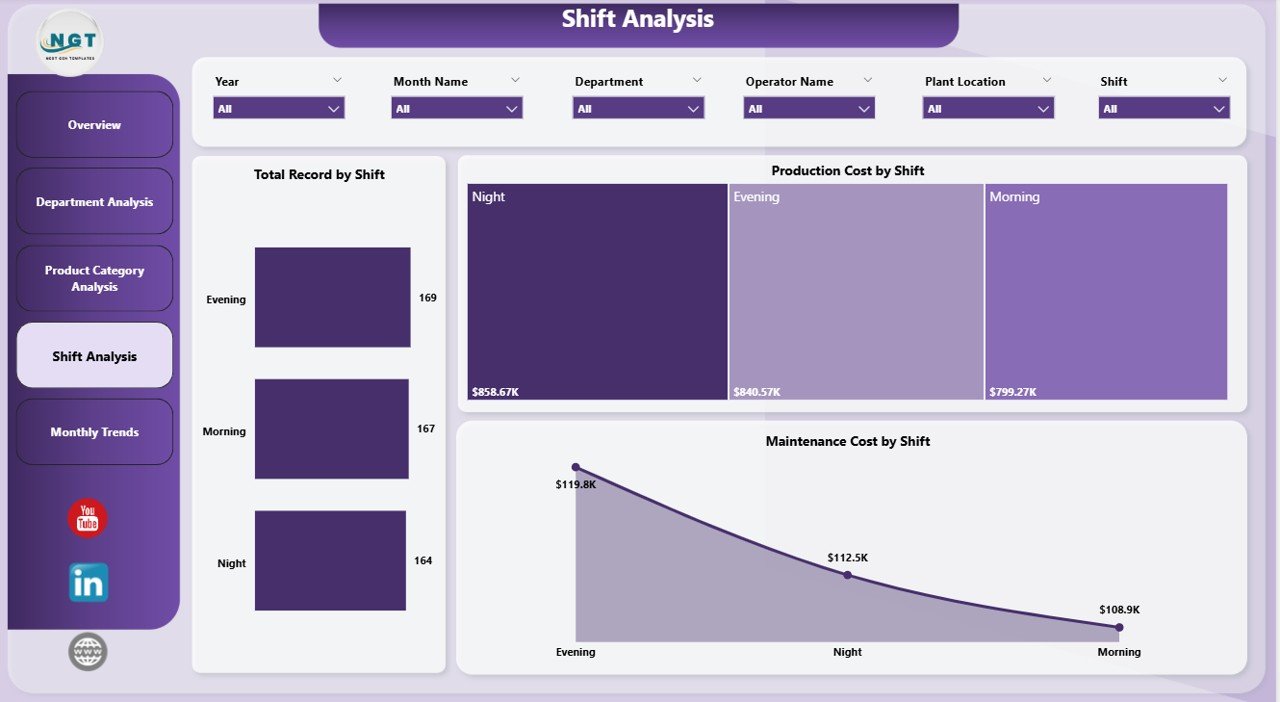
Manufacturing facilities often operate in multiple shifts. Because workforce availability and machine usage vary across shifts, performance may differ significantly.
The Shift Analysis Page allows managers to analyze production data based on operational shifts.
Charts Included in Shift Analysis
This page contains three important charts:
-
Total Record by Shift
Displays production activity during each shift. -
Maintenance Cost by Shift
Shows maintenance expenses incurred during different shifts. -
Production Cost by Shift
Highlights cost distribution across shifts.
Why Shift Analysis Matters
Shift-based analytics helps manufacturers:
-
Identify inefficient shifts
-
Improve workforce allocation
-
Optimize machine utilization
-
Reduce operational costs
Therefore, organizations can enhance manufacturing productivity.
5. Month Analysis – How Can You Track Monthly Production Trends?
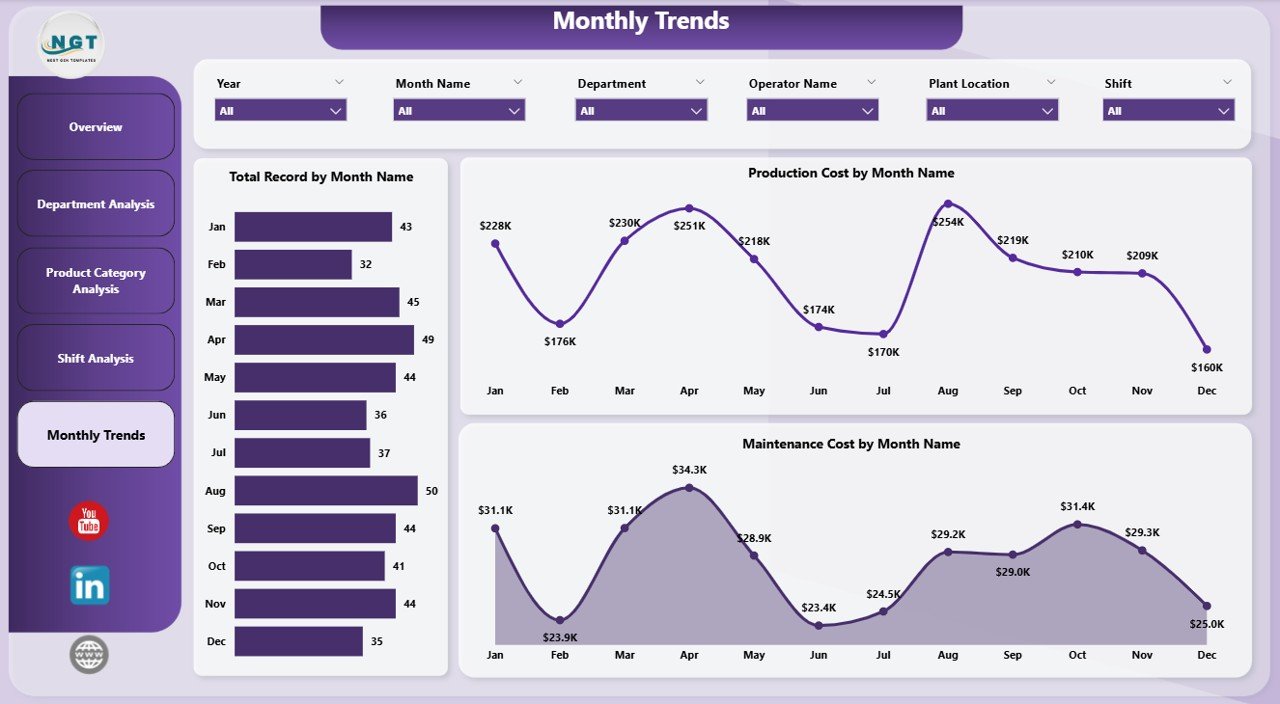
Production performance often fluctuates across months due to demand cycles, machine maintenance schedules, and operational changes.
The Month Analysis Page helps managers analyze manufacturing trends over time.
Charts Included in Month Analysis
This page includes three charts:
-
Total Record by Month
Displays production activity trends across months. -
Maintenance Cost by Month
Shows maintenance expenditure trends over time. -
Production Cost by Month
Highlights monthly manufacturing cost variations.
Why Monthly Analysis Is Important
Monthly trend analysis helps organizations:
-
Identify seasonal demand patterns
-
Monitor cost fluctuations
-
Improve production planning
-
Evaluate operational improvements
As a result, businesses can develop long-term manufacturing strategies.
Click to Purchases Additive Manufacturing Dashboard in Power BI
Advantages of the Additive Manufacturing Dashboard in Power BI
The Additive Manufacturing Dashboard in Power BI offers numerous operational and strategic advantages.
Improved Production Visibility
Managers can monitor production metrics across plants, departments, and shifts from one centralized dashboard.
Faster Decision-Making
Because the dashboard provides real-time insights, decision-makers can quickly respond to operational issues.
Better Cost Management
The dashboard highlights production and maintenance costs across multiple dimensions. Consequently, companies can identify cost-saving opportunities.
Enhanced Quality Monitoring
Quality metrics such as Pass Quality % help manufacturers maintain production standards.
Interactive Data Analysis
Power BI enables users to filter, drill down, and explore data interactively.
Therefore, users gain deeper operational insights.
Best Practices for the Additive Manufacturing Dashboard in Power BI
Organizations should follow several best practices to maximize the value of the dashboard.
Define Clear KPIs
Manufacturers should define measurable KPIs such as:
-
Production efficiency
-
Build time
-
Maintenance cost
-
Machine utilization
-
Quality performance
Maintain Clean Data
Reliable analytics depends on high-quality data. Therefore, organizations must ensure accurate and consistent data collection.
Update Data Regularly
Manufacturing data changes frequently. Consequently, dashboards should update automatically or periodically.
Use Interactive Filters
Slicers and filters help users analyze specific segments of data quickly.
Monitor Key Trends
Managers should regularly review monthly and shift-based trends to identify operational issues early.
How Does This Dashboard Support Decision-Making?
Click to Purchases Additive Manufacturing Dashboard in Power BI
The Additive Manufacturing Dashboard in Power BI supports strategic and operational decisions in several ways.
Production Planning
Managers can evaluate production trends and allocate resources effectively.
Cost Optimization
The dashboard highlights cost variations across plants, materials, and departments.
Maintenance Planning
Maintenance cost analysis helps organizations schedule preventive maintenance.
Quality Improvement
Quality metrics help identify production issues early.
Operational Efficiency
Shift and department analysis enables managers to optimize workforce productivity.
Future Trends in Additive Manufacturing Analytics
Additive manufacturing analytics continues to evolve rapidly. Several emerging trends will further enhance dashboard capabilities.
Integration with IoT Sensors
Manufacturing machines increasingly generate real-time data using IoT sensors.
AI-Based Predictive Maintenance
Artificial intelligence can predict machine failures before they occur.
Real-Time Production Monitoring
Future dashboards will display real-time machine performance metrics.
Advanced Cost Modeling
Manufacturers will analyze production costs with greater accuracy.
Because of these innovations, Power BI dashboards will play a critical role in smart manufacturing environments.
Conclusion
Additive manufacturing continues to revolutionize modern production processes. However, managing complex manufacturing operations requires accurate data monitoring and advanced analytics.
The Additive Manufacturing Dashboard in Power BI provides a powerful solution for monitoring production performance, analyzing costs, and tracking quality metrics.
Because the dashboard includes five analytical pages — Overview, Department Analysis, Product Category Analysis, Shift Analysis, and Month Analysis — it offers a comprehensive view of manufacturing performance.
Moreover, the dashboard helps organizations:
-
Improve operational visibility
-
Reduce production costs
-
Monitor build quality
-
Optimize manufacturing processes
Therefore, manufacturers that implement this dashboard can transform raw production data into meaningful insights and strategic decisions.
Frequently Asked Questions (FAQs)
What is additive manufacturing?
Additive manufacturing refers to the process of creating objects layer by layer using digital design files. It is commonly known as 3D printing.
Why should manufacturers use Power BI dashboards?
Power BI dashboards help manufacturers visualize complex production data and identify operational trends quickly.
What KPIs are important in additive manufacturing?
Common additive manufacturing KPIs include:
-
Production cost
-
Build time
-
Machine utilization
-
Pass quality percentage
-
Maintenance cost
Can Power BI integrate with manufacturing systems?
Yes. Power BI can connect with ERP systems, manufacturing databases, Excel files, and cloud data sources.
How often should manufacturing dashboards update?
Ideally, manufacturing dashboards should update daily or in real-time, depending on operational requirements.
Visit our YouTube channel to learn step-by-step video tutorials