In today’s highly competitive digital world, advertising decisions must rely on data instead of assumptions. Businesses invest large budgets across multiple channels such as social media, search engines, display ads, and email campaigns. However, many marketing teams still struggle to measure campaign performance effectively. As a result, companies often fail to identify which campaigns generate real revenue.
Therefore, organizations increasingly adopt business intelligence tools to track advertising performance in real time. One of the most powerful solutions available today is the Advertising Dashboard in Power BI.
This comprehensive guide explains everything you need to know about the Advertising Dashboard in Power BI, including its structure, features, benefits, analysis capabilities, best practices, and frequently asked questions.
What Is an Advertising Dashboard in Power BI?
An Advertising Dashboard in Power BI is an interactive analytics solution that helps businesses monitor, analyze, and optimize advertising campaigns using visual reports and real-time insights.
Instead of reviewing multiple spreadsheets and marketing reports separately, decision-makers can analyze all advertising metrics in one centralized dashboard. Consequently, teams gain clarity and make faster marketing decisions.
The dashboard combines advertising data such as:
- Campaign performance
- Revenue generated
- Advertising costs
- Conversion metrics
- Click performance
- ROI indicators
Because Power BI automatically updates visuals when data changes, organizations always work with accurate and current insights.
Why Do Businesses Need an Advertising Dashboard?
Marketing teams manage multiple campaigns simultaneously. Without structured analytics, tracking performance becomes confusing and time-consuming. Therefore, businesses need a centralized reporting system.
An Advertising Dashboard helps organizations:
- Monitor advertising ROI instantly
- Compare channel performance easily
- Track campaign success continuously
- Identify profitable regions quickly
- Improve marketing budget allocation
Moreover, leaders can quickly detect underperforming campaigns and adjust strategies before wasting resources.
Key Features of the Advertising Dashboard in Power BI
This dashboard contains five interactive pages inside the Power BI Desktop application. Each page focuses on a different analytical perspective, which ensures deep performance analysis.
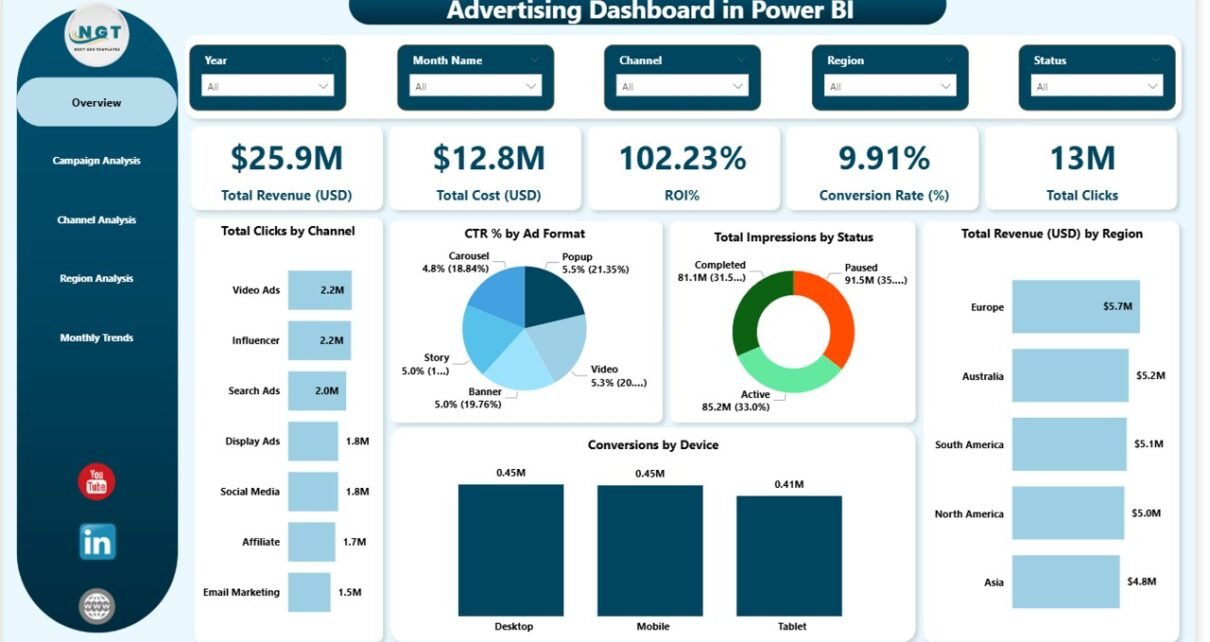
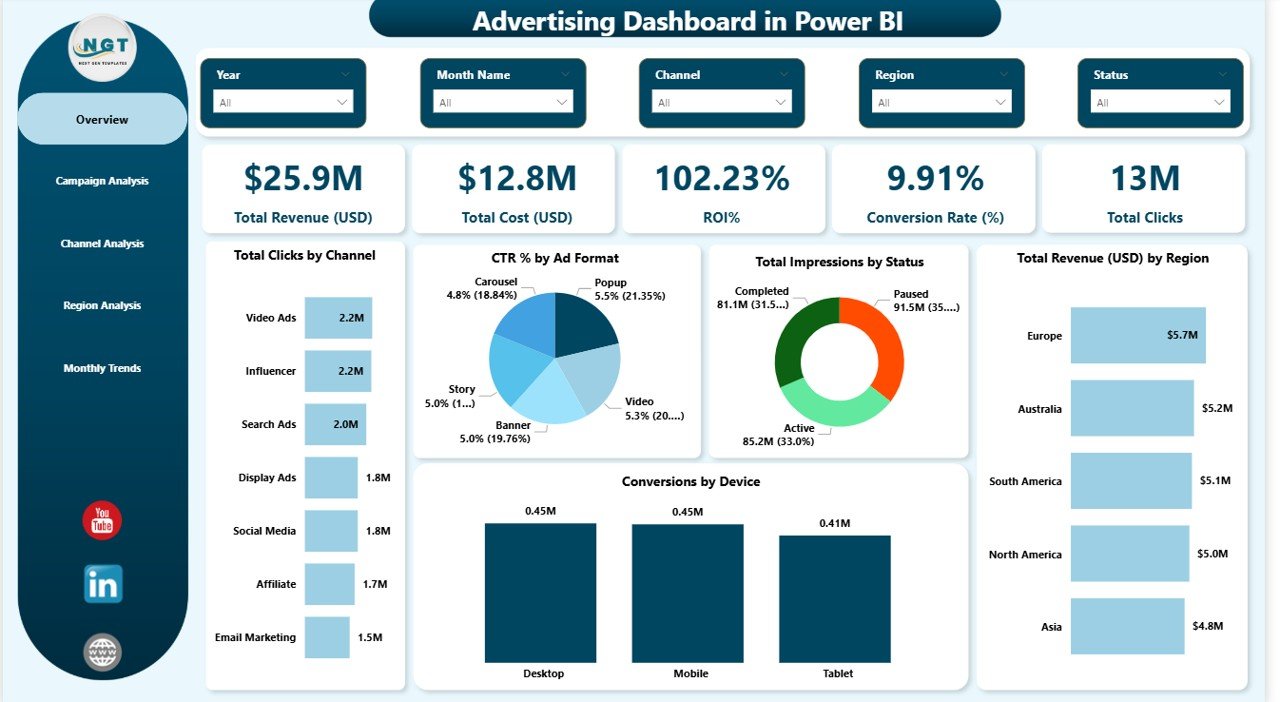
Overview Page – How Does It Provide a Complete Performance Snapshot?
The Overview Page acts as the main dashboard interface. It provides a high-level summary of advertising performance using slicers and KPI cards.
KPI Cards Included
The dashboard displays five essential performance indicators:
- Total Revenue (USD) – Measures earnings generated from advertising campaigns.
- Total Cost (USD) – Shows total advertising expenditure.
- ROI (%) – Evaluates campaign profitability.
- Conversion Rate (%) – Tracks user actions after interaction.
- Total Clicks – Indicates audience engagement level.
Because these KPIs appear at the top, users quickly understand overall performance.
Charts Available on Overview Page
The page includes multiple visual analytics:
- Total Clicks by Channel
- CTR (%) by Ad Format
- Total Impressions by Status
- Total Revenue (USD) by Region
- Conversion by Device
As a result, users instantly identify which platforms and devices drive results.
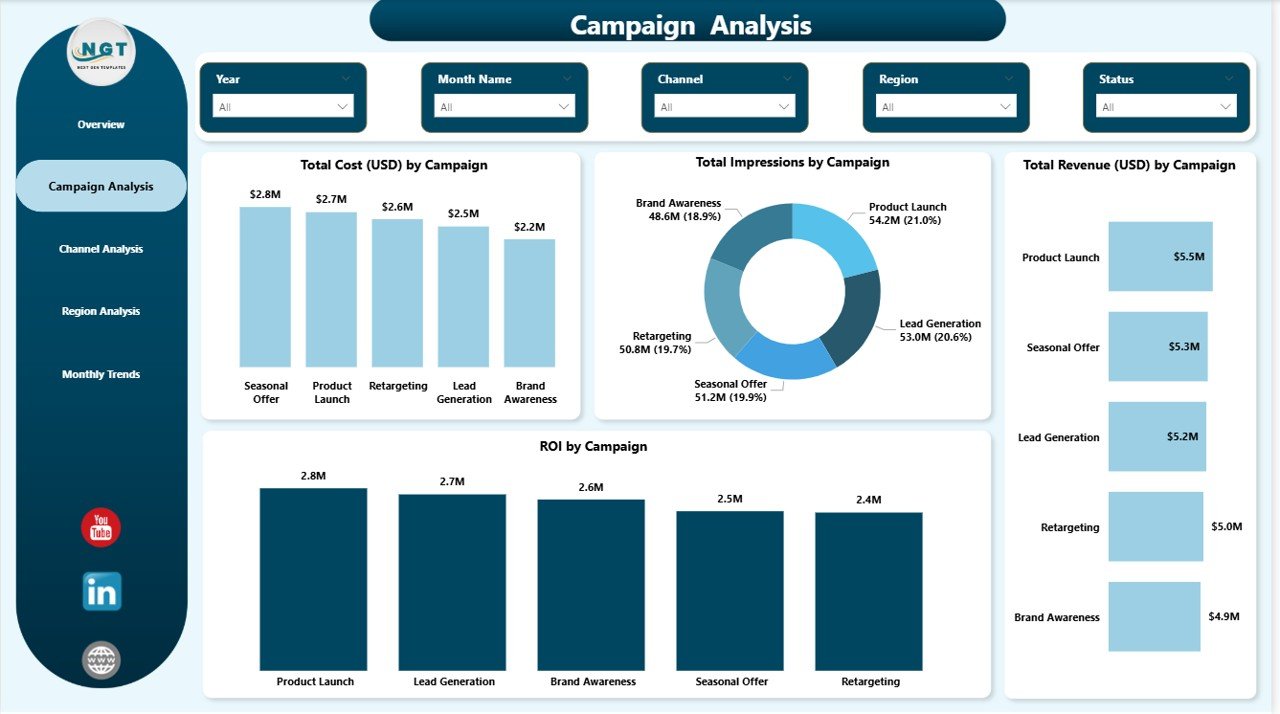
Campaign Analysis – How Can You Measure Campaign Success?
The Campaign Analysis Page focuses on evaluating individual marketing campaigns.
Visual Reports Included
- Total Cost (USD) by Campaign
- Total Impressions by Campaign
- Total Revenue (USD) by Campaign
- ROI (%) by Campaign
Therefore, marketers can compare campaign performance side by side.
This analysis helps answer important questions:
- Which campaign generates the highest ROI?
- Which campaign consumes the most budget?
- Which campaigns require optimization?
Consequently, teams improve campaign planning and execution.
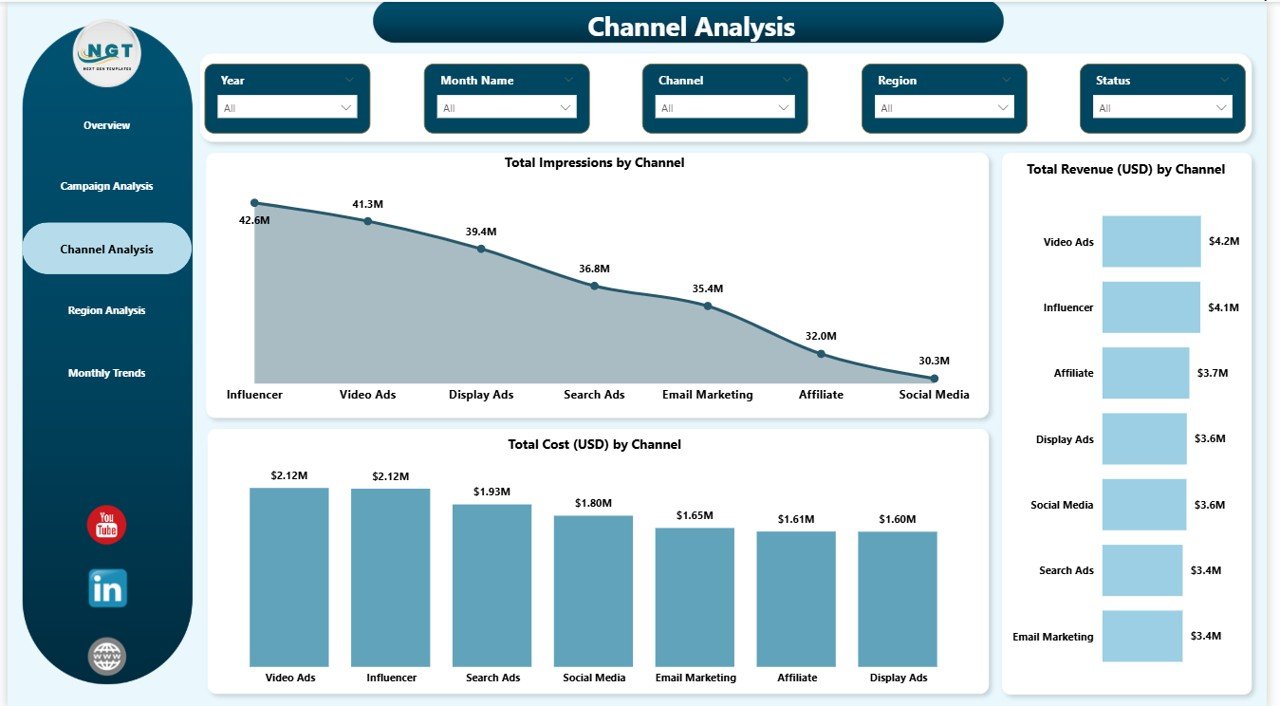
Channel Analysis – Which Marketing Channels Perform Best?
Different advertising channels deliver different outcomes. Hence, analyzing channel-level performance becomes essential.
Charts Included
- Total Impressions by Channel
- Total Revenue by Channel
- Total Cost by Channel
Using this page, marketers quickly determine whether search ads, social media, or display ads provide better results.
Additionally, businesses can shift budgets toward high-performing channels to maximize profitability.
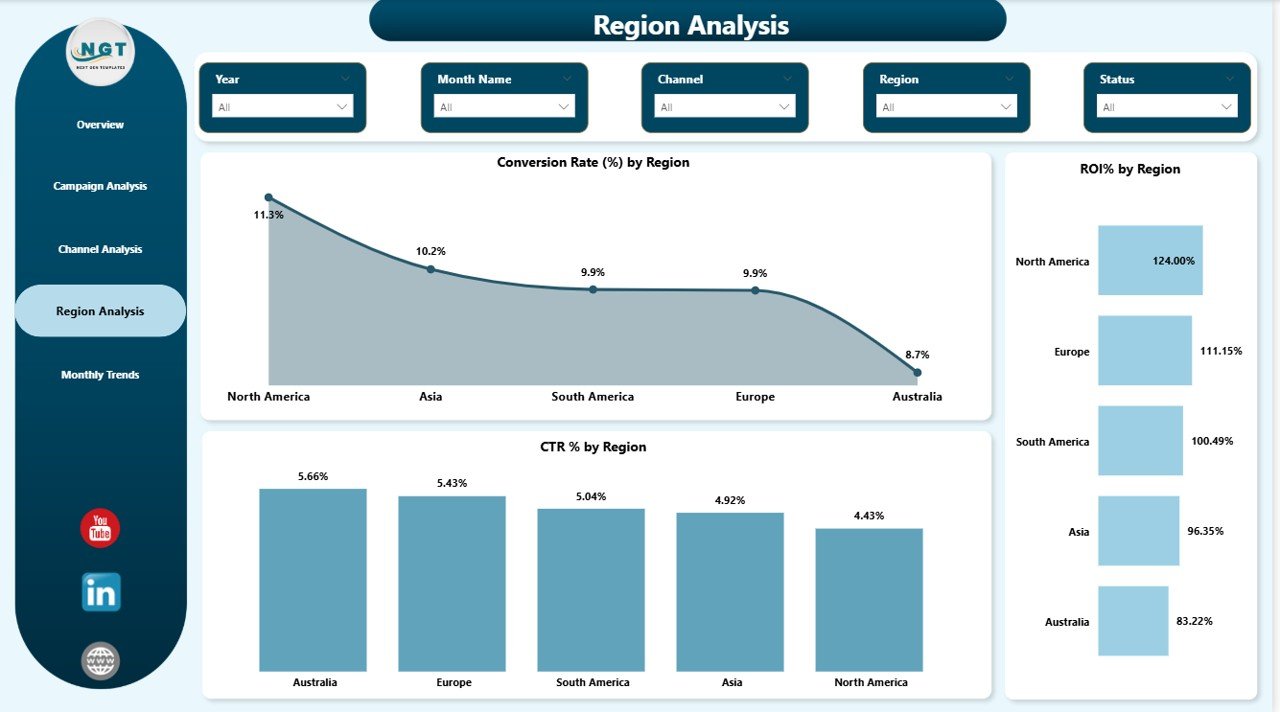
Region Analysis – Where Does Advertising Perform the Best?
Geographic performance plays a crucial role in advertising strategy. Therefore, the Region Analysis Page provides location-based insights.
Key Metrics Visualized
- Conversion Rate (%) by Region
- ROI (%) by Region
- CTR (%) by Region
Because regional trends vary significantly, companies can customize campaigns based on audience behavior.
For example:
- Increase ads in high-performing regions
- Optimize messaging in low-performing locations
- Adjust regional budgets strategically
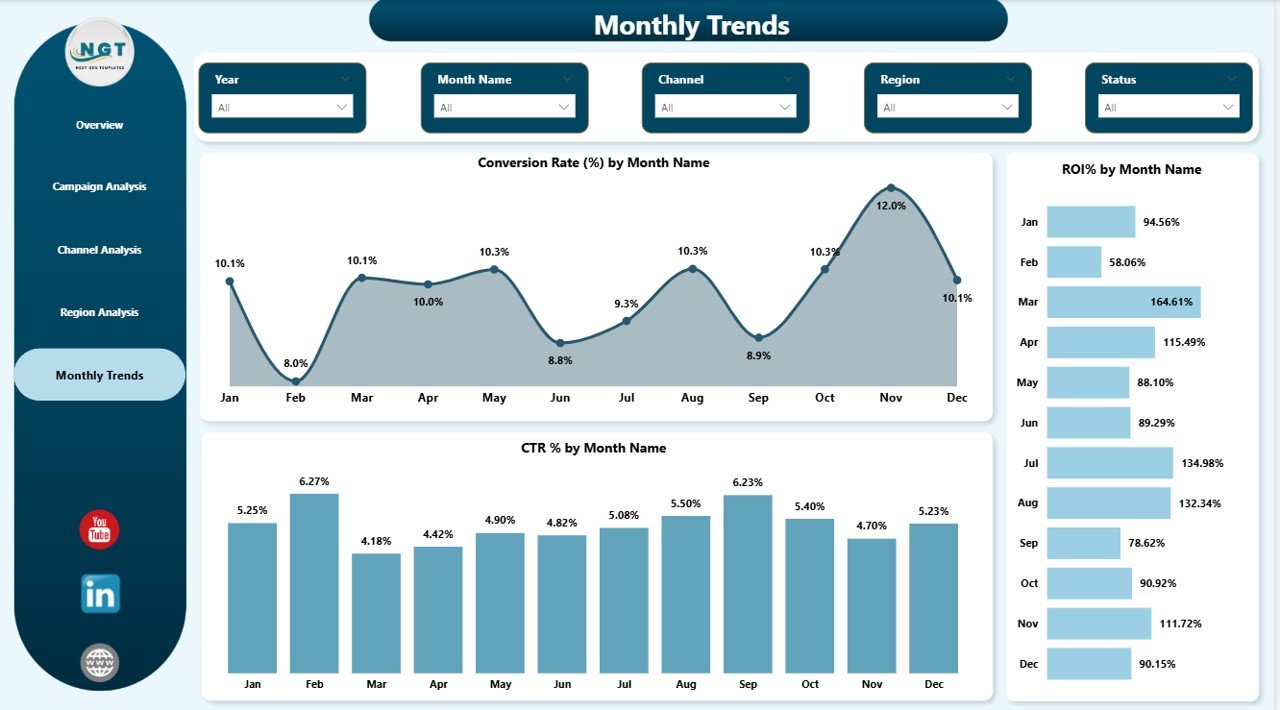
Monthly Trends – How Can You Track Performance Over Time?
Advertising success depends on consistent monitoring. Thus, the Monthly Trends Page analyzes performance trends across months.
Charts Included
- Conversion Rate (%) by Month
- ROI (%) by Month
- CTR (%) by Month
This page helps organizations:
- Identify seasonal trends
- Measure campaign improvement over time
- Forecast future performance
Consequently, marketing teams create long-term data-driven strategies.
What Metrics Does an Advertising Dashboard Track?
A well-designed advertising dashboard monitors several essential KPIs.
Engagement Metrics
- Clicks
- Click-Through Rate (CTR)
- Impressions
Performance Metrics
- Conversion Rate
- Campaign Revenue
- Device Performance
Financial Metrics
- Advertising Cost
- Revenue Generated
- Return on Investment (ROI)
Together, these metrics provide a complete performance picture.
How Does Power BI Improve Advertising Analytics?
Power BI transforms raw advertising data into actionable insights.
Key Capabilities
- Interactive filtering using slicers
- Real-time data visualization
- Automated report updates
- Cross-filtering between visuals
- Easy sharing with teams
Moreover, Power BI integrates with multiple marketing platforms, which simplifies data consolidation.
Advantages of Advertising Dashboard in Power BI
Using an Advertising Dashboard delivers several business advantages.
Better Decision Making
Managers analyze performance instantly and make informed decisions.
Time Savings
Automated reporting eliminates manual data preparation.
Improved Budget Optimization
Businesses invest more in profitable campaigns.
Performance Transparency
Teams clearly understand campaign results.
Real-Time Insights
Users monitor campaign performance continuously.
Enhanced Collaboration
Teams share dashboards across departments easily.
How Can Businesses Use This Dashboard Effectively?
Organizations across industries can benefit from advertising analytics.
Marketing Agencies
- Monitor multiple client campaigns
- Compare performance quickly
E-commerce Businesses
- Track ad-driven revenue
- Improve customer acquisition
Startups
- Optimize limited marketing budgets
- Identify high-performing channels
Enterprises
- Analyze global campaign performance
- Improve ROI tracking
Best Practices for the Advertising Dashboard in Power BI
To maximize dashboard value, organizations should follow proven best practices.
Define Clear KPIs
Select metrics aligned with marketing goals.
Maintain Clean Data
Ensure consistent naming and accurate campaign tracking.
Use Interactive Filters
Allow users to explore insights dynamically.
Monitor Performance Regularly
Review dashboards weekly or daily.
Focus on Actionable Insights
Avoid unnecessary visuals and prioritize meaningful metrics.
Standardize Campaign Tracking
Use consistent campaign naming conventions.
How to Implement an Advertising Dashboard in Power BI?
Creating a successful dashboard involves structured steps.
Step 1: Collect Advertising Data
Gather data from Google Ads, Meta Ads, and other platforms.
Step 2: Prepare Data
Clean and organize datasets for analysis.
Step 3: Import Data into Power BI
Load data using Power BI connectors.
Step 4: Create Data Relationships
Connect campaign, channel, and regional tables.
Step 5: Design Visualizations
Build KPI cards and charts.
Step 6: Add Slicers
Enable filtering by campaign, channel, or period.
Step 7: Publish Dashboard
Share reports through Power BI Service.
Common Challenges in Advertising Analytics (And Solutions)
Data Fragmentation
Different platforms store data separately.
Solution: Use Power BI integrations.
Delayed Reporting
Manual reporting slows decision-making.
Solution: Automate dashboard refresh.
Poor KPI Selection
Irrelevant metrics create confusion.
Solution: Focus on ROI-driven KPIs.
Future Trends in Advertising Analytics
Advertising analytics continues to evolve rapidly.
AI-Powered Insights
AI predicts campaign performance automatically.
Predictive Analytics
Businesses forecast conversions and revenue.
Real-Time Personalization
Campaigns adapt based on live user behavior.
Cross-Channel Attribution
Companies measure complete customer journeys.
Power BI supports these innovations through advanced analytics features.
Conclusion
The Advertising Dashboard in Power BI provides a powerful solution for modern marketing analytics. Instead of relying on scattered reports, organizations gain a centralized platform to monitor revenue, costs, conversions, and ROI.
Because the dashboard includes Overview, Campaign Analysis, Channel Analysis, Region Analysis, and Monthly Trends pages, users achieve both high-level and detailed insights. Moreover, interactive visuals help teams make faster and smarter decisions.
Ultimately, businesses that adopt data-driven advertising strategies improve performance, reduce wasteful spending, and maximize marketing ROI.
Frequently Asked Questions (FAQs)
What is the main purpose of an Advertising Dashboard in Power BI?
It helps businesses monitor advertising performance, track ROI, and optimize campaigns using interactive data visualizations.
Who can use this dashboard?
Marketing managers, analysts, agencies, startups, and enterprises can all use it.
Does Power BI update advertising data automatically?
Yes, Power BI supports scheduled data refresh, which keeps reports updated.
Can this dashboard track multiple advertising platforms?
Yes, Power BI integrates data from various platforms into one dashboard.
Why is ROI important in advertising analytics?
ROI shows whether advertising spending generates profitable results.
Is Power BI suitable for beginners?
Yes. Its visual interface makes analytics easy even for non-technical users.
How often should businesses review advertising dashboards?
Teams should review performance daily or weekly for best results.
Watch the step-by-step video tutorial:
Visit our YouTube channel to learn step-by-step video tutorials