Managing agricultural biotechnology operations requires clarity, speed, and accuracy. However, teams often struggle because data remains scattered across multiple Excel files, reports, and emails. As a result, decision-making slows down, and strategic opportunities get delayed. Therefore, organizations increasingly rely on a Agri-Biotech Dashboard in Excel to gain centralized visibility across research, trials, regulatory approvals, vendors, and financial performance.
In this comprehensive and SEO-friendly article, you will learn what an Agri-Biotech Dashboard in Excel is, why it matters, how it works, and how each dashboard page supports smarter decisions. Moreover, this guide explains advantages, best practices, real-world use cases, and frequently asked questions, all in clear and easy language.
Click to Purchases Agri-Biotech Dashboard in Excel
What Is an Agri-Biotech Dashboard in Excel?
An Agri-Biotech Dashboard in Excel is a ready-to-use analytical template built in Microsoft Excel that converts raw agricultural biotechnology data into visual KPIs, charts, and insights.
Instead of reviewing thousands of rows of data, stakeholders can instantly monitor:
-
R&D investments
-
Regulatory approvals
-
Crop-wise performance
-
Trial phase outcomes
-
Vendor efficiency
-
Monthly trends
Because Excel supports pivot tables, slicers, and charts, this dashboard remains flexible, transparent, and easy to maintain. Moreover, teams can customize it without advanced technical skills.
Why Do Agri-Biotech Organizations Need a Dashboard in Excel?
Agri-biotech organizations operate in a highly regulated, data-intensive environment. Therefore, leaders must track performance across research, compliance, and commercialization at the same time. However, manual reporting creates delays and errors.
An Agri-Biotech Dashboard in Excel solves these challenges by:
-
Centralizing critical biotech data
-
Improving decision-making speed
-
Enhancing regulatory visibility
-
Tracking profitability across crops and regions
-
Supporting R&D and trial optimization
As a result, leadership teams stay proactive instead of reactive.
Click to Purchases Agri-Biotech Dashboard in Excel
How Does an Agri-Biotech Dashboard in Excel Work?
The dashboard works by connecting structured data sheets with pivot tables and pivot charts. After data refresh, all visuals update automatically. Therefore, users always see the latest performance metrics.
Core Components of the Dashboard
-
Data Sheet – Stores raw transactional data
-
Support Sheet – Contains helper tables and mappings
-
Dashboard Pages – Display KPIs, charts, and slicers
-
Page Navigator – Allows smooth navigation across pages
Because everything runs inside Excel, teams avoid complex software dependencies.
Key Features of the Agri-Biotech Dashboard in Excel
This dashboard comes with powerful yet user-friendly features, designed for biotech professionals.
🔹 Page Navigator for Easy Navigation
A page navigator on the left side allows users to switch between analytical pages instantly. Therefore, users save time and avoid confusion.
🔹 Interactive Slicers
Each page includes right-side slicers that filter data dynamically by:
-
Crop
-
Trial phase
-
Vendor
-
Country
-
Month
-
Regulatory status
As a result, analysis becomes fast and interactive.
🔹 KPI Cards for Instant Insights
The dashboard uses visual KPI cards to highlight performance at a glance.
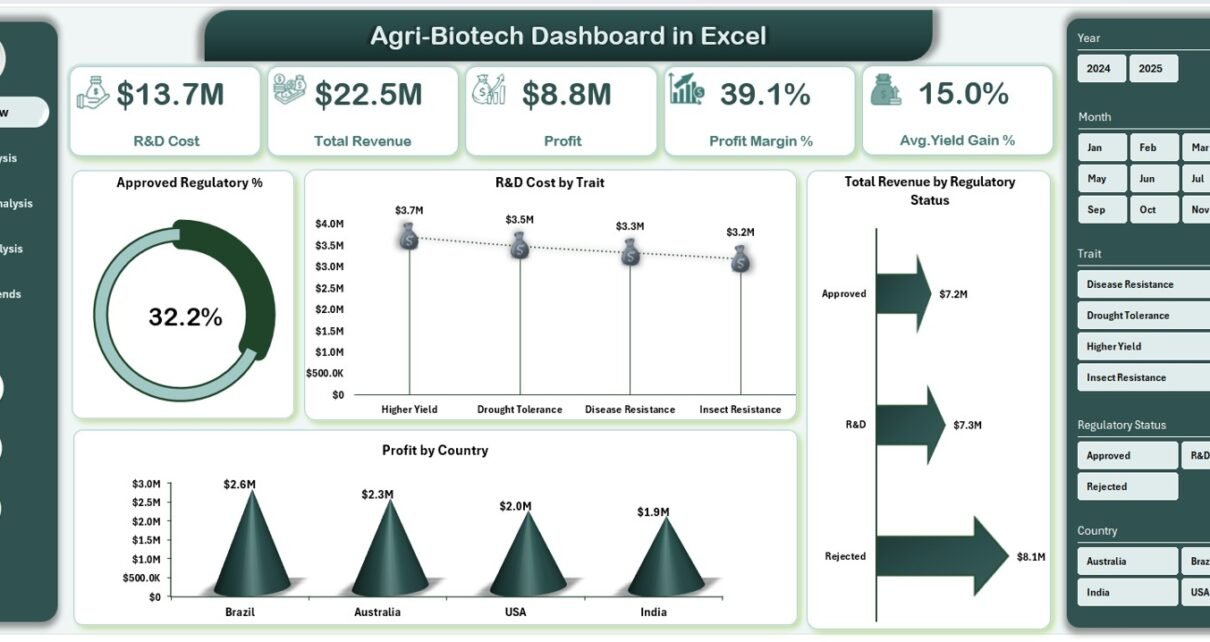
Overview Page: What Does the Main Dashboard Show?
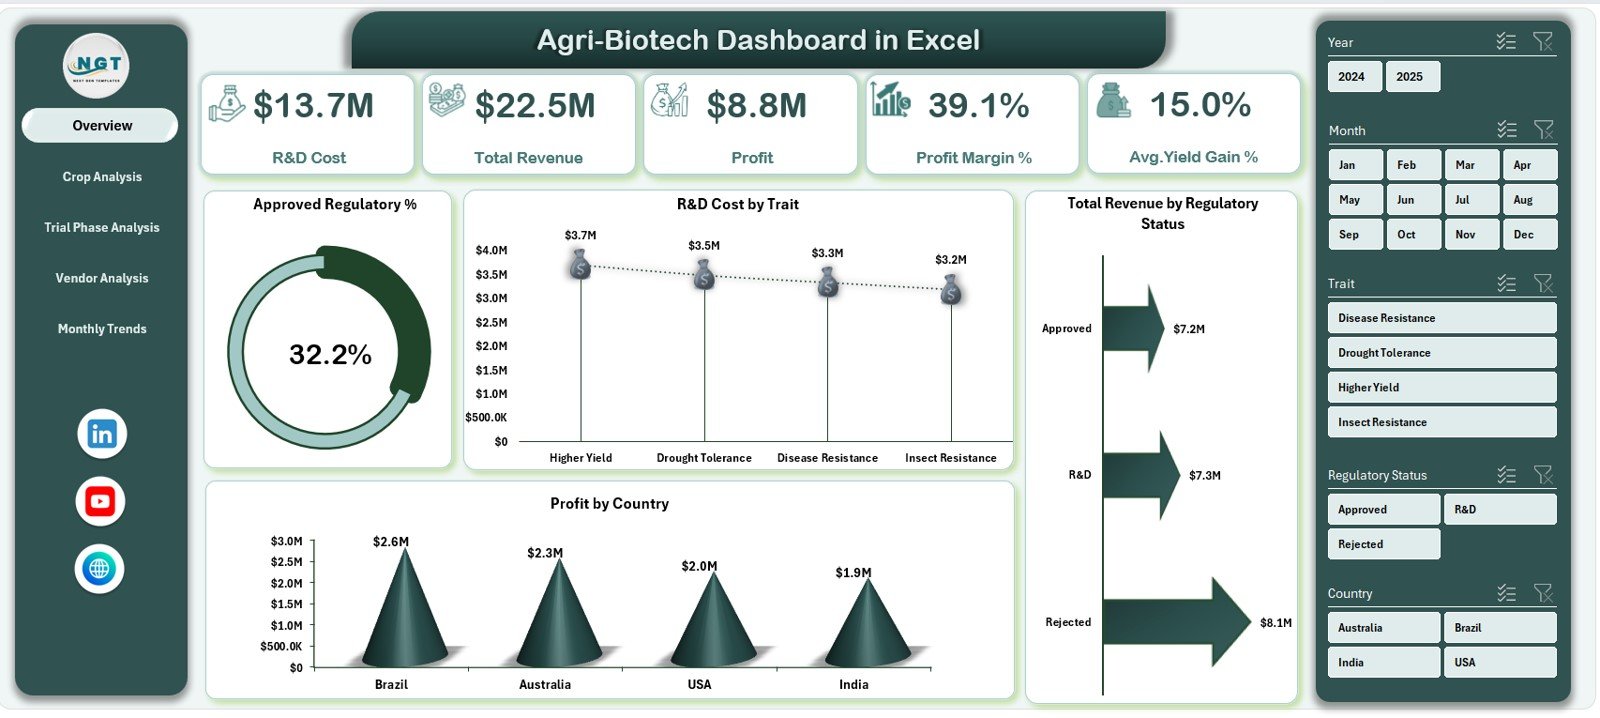
The Overview Page acts as the control center of the Agri-Biotech Dashboard in Excel. It summarizes key financial and operational metrics.
KPI Cards on the Overview Page
The page displays five critical KPI cards:
-
R&D Cost
-
Total Revenue
-
Profit
-
Profit Margin %
-
Average Yield Gain %
Because these KPIs appear at the top, leadership can instantly assess performance.
Charts on the Overview Page
The Overview Page includes four insightful charts:
-
Approved Regulatory % – Shows compliance success
-
R&D Cost by Trait – Highlights investment distribution
-
Total Revenue by Regulatory Status – Connects compliance to revenue
-
Profit by Country – Identifies high-performing regions
Together, these visuals create a clear performance snapshot.
Crop Analysis Page: How Do Different Crops Perform?
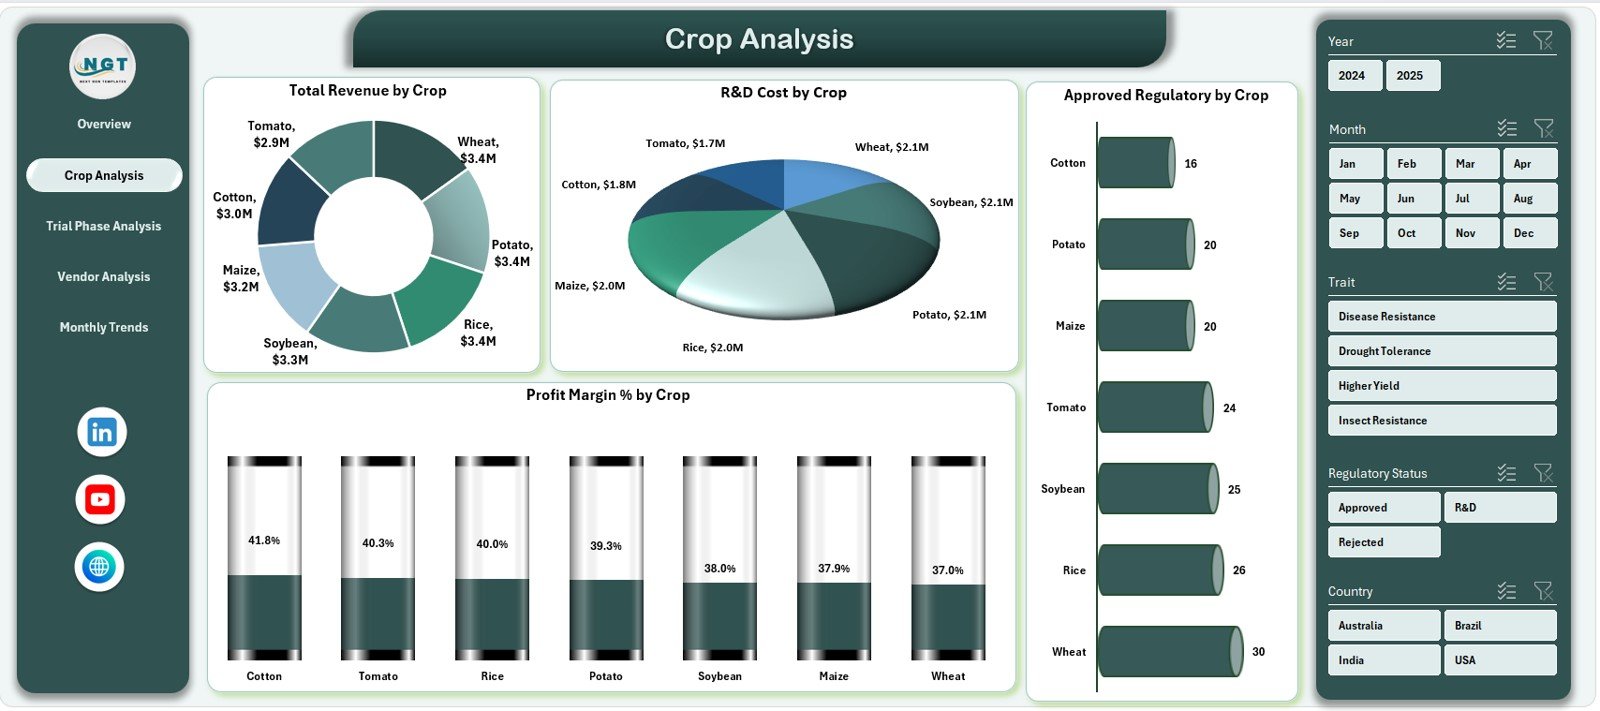
The Crop Analysis Page focuses on crop-wise performance across revenue, cost, and profitability.
Charts on the Crop Analysis Page
This page includes four detailed charts:
-
Total Revenue by Crop
-
R&D Cost by Crop
-
Approved Regulatory % by Crop
-
Profit Margin % by Crop
Because of these visuals, teams can:
-
Identify high-value crops
-
Optimize R&D investments
-
Focus on crops with faster approvals
-
Improve profit margins
Trial Phase Analysis Page: Which Trial Stages Perform Best?
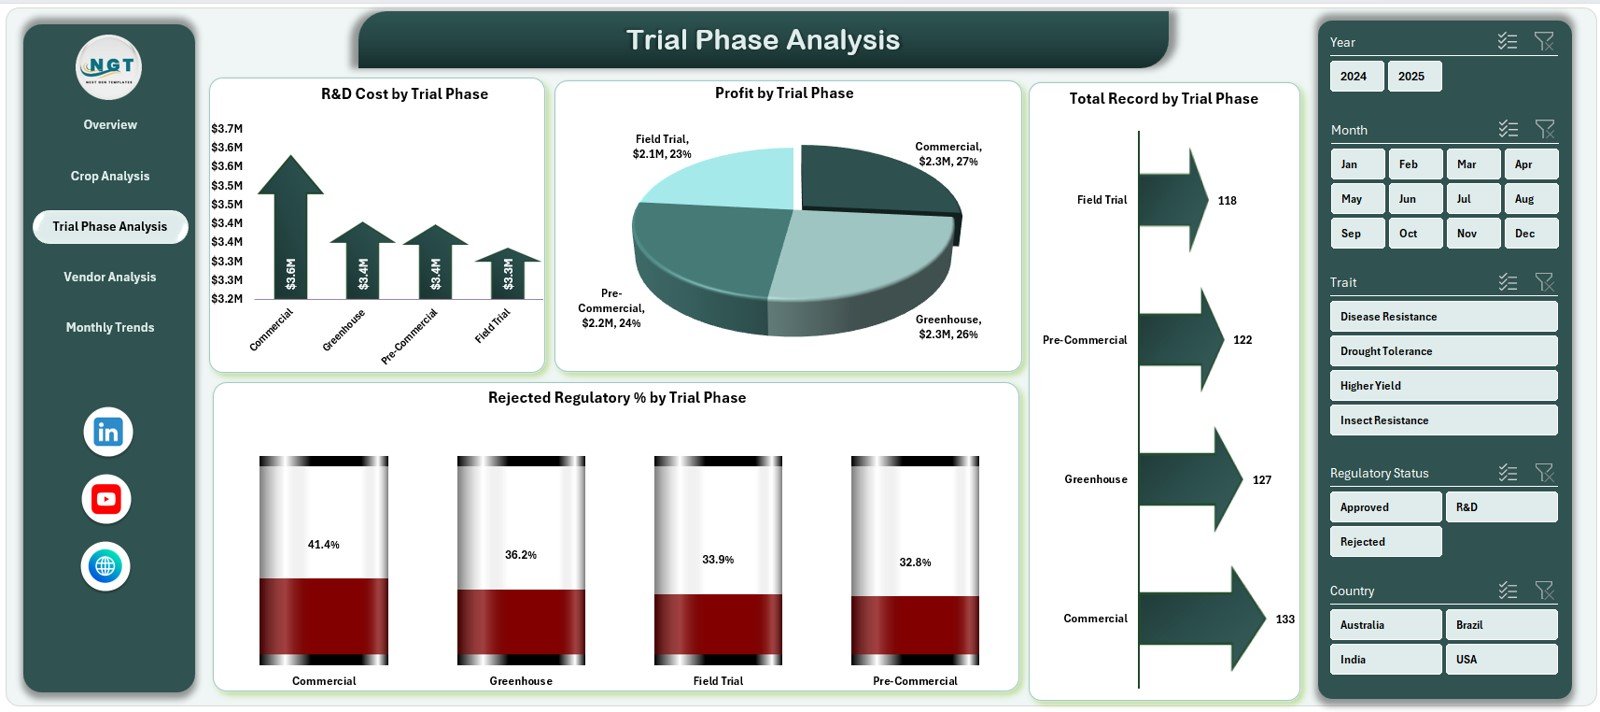
Trial phases play a crucial role in biotech success. Therefore, the Trial Phase Analysis Page tracks performance across research stages.
Charts on the Trial Phase Analysis Page
This page displays four key charts:
-
R&D Cost by Trial Phase
-
Profit by Trial Phase
-
Total Records by Trial Phase
-
Rejected Regulatory % by Trial Phase
As a result, R&D leaders can:
-
Detect costly trial stages
-
Reduce regulatory rejections
-
Improve phase-wise efficiency
Vendor Analysis Page: Which Vendors Deliver the Best Results?
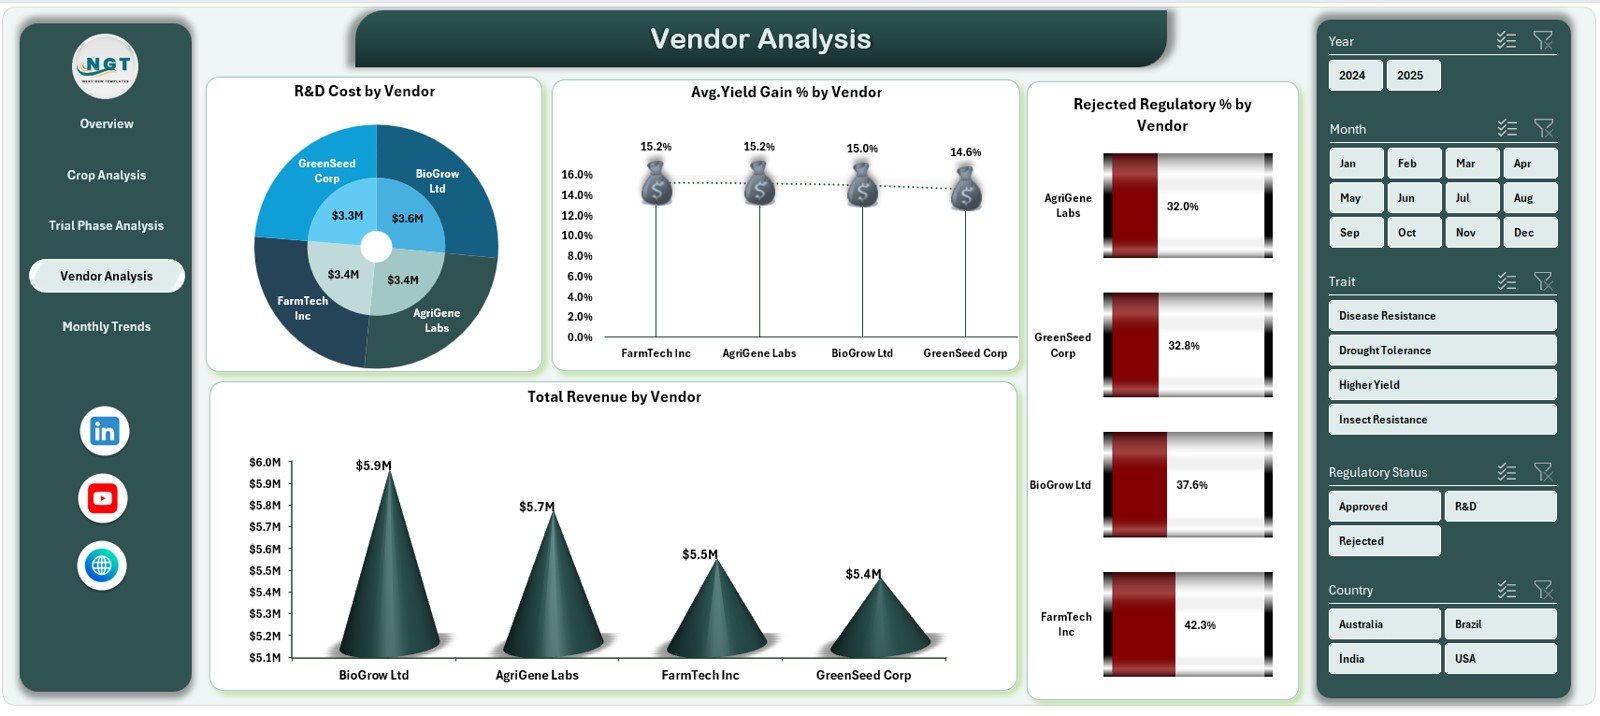
Vendors significantly influence R&D costs, yield improvements, and regulatory outcomes. Therefore, the Vendor Analysis Page evaluates vendor performance objectively.
Charts on the Vendor Analysis Page
The page includes four powerful charts:
-
R&D Cost by Vendor
-
Average Yield Gain % by Vendor
-
Rejected Regulatory % by Vendor
-
Total Revenue by Vendor
Because of this analysis, organizations can:
-
Select high-performing vendors
-
Reduce regulatory risks
-
Negotiate better contracts
-
Improve yield outcomes
Monthly Trends Page: How Does Performance Change Over Time?
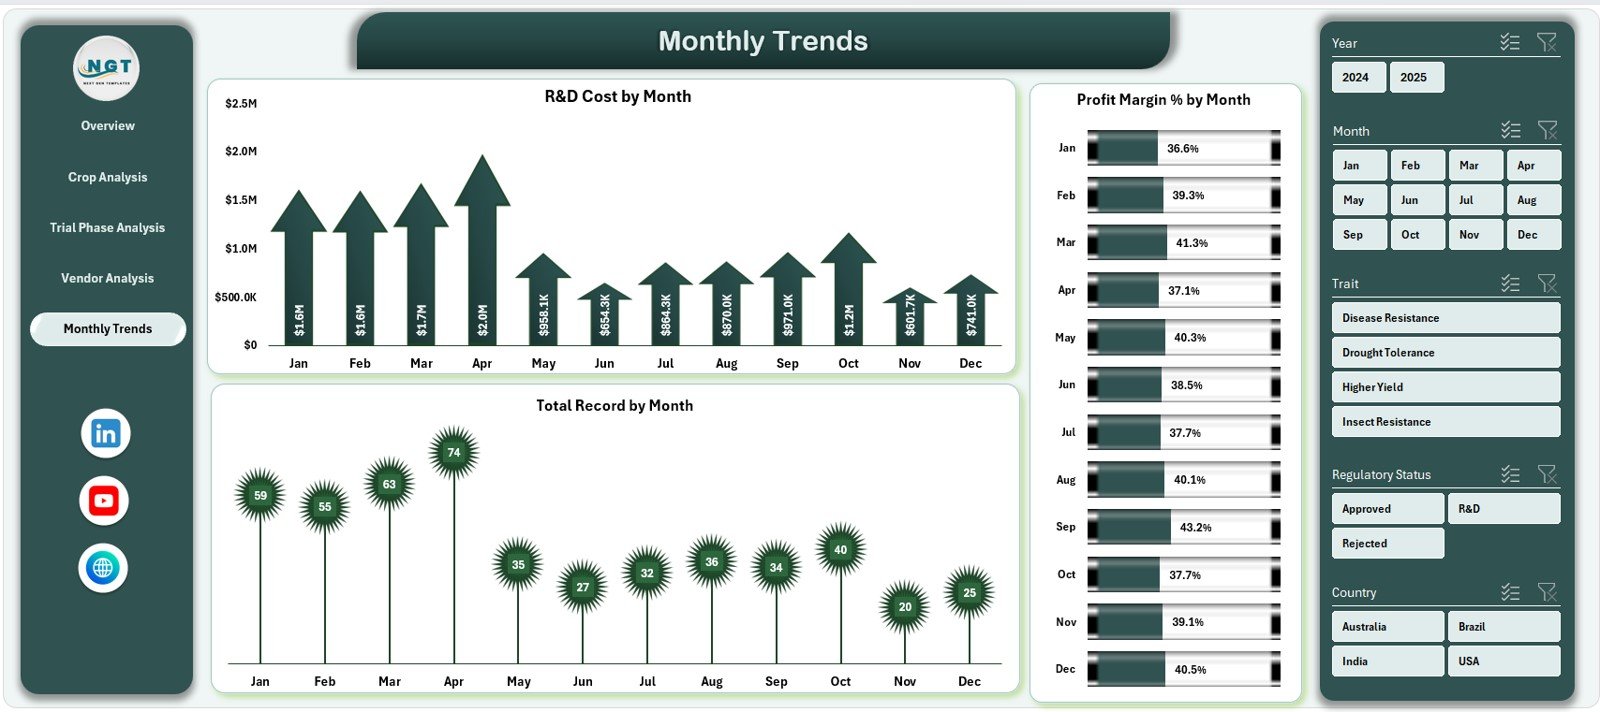
Tracking trends helps organizations anticipate risks and opportunities. Therefore, the Monthly Trends Page focuses on time-based analysis.
Charts on the Monthly Trends Page
This page includes three trend charts:
-
R&D Cost by Month
-
Profit Margin % by Month
-
Total Records by Month
As a result, leaders can:
-
Monitor seasonality
-
Control monthly costs
-
Track performance consistency
What Data Does the Agri-Biotech Dashboard Use?
The dashboard relies on structured and clean data.
Data Sheet
The Data Sheet contains transactional records such as:
-
Crop name
-
Trait
-
Trial phase
-
Vendor
-
Country
-
Regulatory status
-
R&D cost
-
Revenue
-
Profit
-
Yield gain %
-
Date
Support Sheet
The Support Sheet helps with:
-
Lookup tables
-
KPI definitions
-
Calculations
-
Data validation
Because of this structure, pivot tables work smoothly.
Click to Purchases Agri-Biotech Dashboard in Excel
Advantages of Agri-Biotech Dashboard in Excel
Using an Agri-Biotech Dashboard in Excel delivers multiple strategic advantages.
✅ Centralized Performance Monitoring
All biotech KPIs appear in one place. Therefore, teams avoid fragmented reports.
✅ Faster Decision-Making
Interactive visuals reduce analysis time. As a result, decisions happen faster.
✅ Cost and Profit Visibility
Clear R&D cost and profit metrics improve financial planning.
✅ Regulatory Compliance Tracking
Approval and rejection trends stay visible at all times.
✅ Vendor and Crop Optimization
Data-driven insights support better vendor and crop strategies.
Who Can Use an Agri-Biotech Dashboard in Excel?
This dashboard suits a wide range of users, including:
-
Agri-biotech companies
-
Seed and genetics firms
-
R&D managers
-
Regulatory compliance teams
-
Financial controllers
-
Strategy and leadership teams
Because Excel remains widely used, adoption stays easy.
Click to Purchases Agri-Biotech Dashboard in Excel
Best Practices for the Agri-Biotech Dashboard in Excel
To maximize value, follow these best practices.
🔹 Keep Data Clean and Consistent
Ensure consistent naming for crops, vendors, and phases. Therefore, pivot tables work accurately.
🔹 Refresh Data Regularly
Update the data sheet frequently to keep insights current.
🔹 Use Slicers Effectively
Apply slicers for targeted analysis instead of manual filtering.
🔹 Track Both Cost and Yield
Balance R&D cost metrics with yield gain insights for better decisions.
🔹 Review Monthly Trends
Monitor trends regularly to detect risks early.
How Does This Dashboard Support Strategic Planning?
This dashboard supports strategy by:
-
Highlighting profitable crops
-
Identifying inefficient trial phases
-
Reducing regulatory risks
-
Improving vendor selection
-
Supporting long-term R&D planning
Therefore, leadership gains confidence in every decision.
Conclusion: Why Should You Use an Agri-Biotech Dashboard in Excel?
An Agri-Biotech Dashboard in Excel transforms complex biotechnology data into clear, actionable insights. Instead of spending hours on manual reports, teams focus on strategy, optimization, and innovation.
Because the dashboard combines financial, regulatory, crop, vendor, and trend analysis, it becomes an essential decision-support tool. Moreover, Excel’s flexibility ensures easy customization and scalability.
If your organization wants better visibility, faster decisions, and improved performance, this dashboard offers a practical and powerful solution.
Frequently Asked Questions (FAQs)
❓ What is the main purpose of an Agri-Biotech Dashboard in Excel?
The main purpose involves centralizing biotech data and converting it into visual insights for faster and better decision-making.
❓ Can non-technical users use this dashboard?
Yes, the dashboard uses Excel features like slicers and pivot charts, which most users already understand.
❓ Does the dashboard support regulatory analysis?
Yes, it tracks approved and rejected regulatory percentages across crops, trial phases, and vendors.
❓ Can I customize KPIs and charts?
Absolutely. Users can add, modify, or remove KPIs and charts based on business needs.
❓ How often should data be updated?
You should update data monthly or weekly, depending on reporting needs.
❓ Is this dashboard suitable for large datasets?
Yes, Excel pivot tables handle large datasets efficiently when data stays structured.
Click to Purchases Agri-Biotech Dashboard in Excel
Visit our YouTube channel to learn step-by-step video tutorials