Agricultural exports play a major role in the global economy. Countries export a wide range of agricultural products such as grains, fruits, vegetables, spices, dairy products, and processed food items. However, managing export operations can become very complex. Agro export companies deal with multiple suppliers, shipment modes, export destinations, ports, and regional markets.
Therefore, companies must constantly track export costs, profit margins, shipment performance, and regional demand. When businesses rely on scattered spreadsheets or manual reports, they often struggle to identify trends and make quick decisions.
As a result, organizations need a centralized analytics solution that converts raw export data into meaningful insights. This is exactly where the Agro Export Companies Dashboard in Power BI becomes extremely useful.
Table of Contents
ToggleClick to Purchases Agro Export Companies Dashboard in Power BI
The Agro Export Companies Dashboard in Power BI is an interactive data visualization tool that helps export managers monitor export costs, analyze profitability, track shipment modes, and evaluate regional performance. Moreover, Power BI provides dynamic charts, filters, and slicers that allow users to explore complex export data easily.
In this comprehensive guide, we will explore everything about the Agro Export Companies Dashboard in Power BI, including its features, dashboard pages, advantages, best practices, and frequently asked questions.
What is an Agro Export Companies Dashboard in Power BI?
An Agro Export Companies Dashboard in Power BI is a business intelligence solution that visualizes export-related data using interactive charts, graphs, and KPIs.
Instead of reviewing static reports, managers can analyze export performance in real time. They can monitor export costs, evaluate profits by region, analyze shipment modes, and identify high-performing export destinations.
Because Power BI allows users to apply filters and slicers, decision-makers can quickly drill down into specific regions, products, or shipment types. Consequently, businesses gain better control over export operations and financial performance.
Why Do Agro Export Companies Need a Dashboard?
Agro export companies manage multiple operational activities simultaneously. They must track shipments, monitor export costs, maintain profit margins, and analyze global demand.
However, traditional reporting methods often create several problems.
For example:
-
Data remains scattered across multiple spreadsheets.
-
Managers struggle to identify profitable export regions.
-
Export costs become difficult to monitor.
-
Decision-making becomes slower.
Therefore, a Power BI dashboard solves these challenges by transforming complex datasets into visual insights.
With a dashboard, companies can:
-
Monitor export performance instantly
-
Analyze profitability by product and region
-
Track shipment modes and logistics costs
-
Identify high-demand export destinations
As a result, businesses can make faster and smarter decisions.
Key Features of the Agro Export Companies Dashboard in Power BI
The Agro Export Companies Dashboard in Power BI includes five interactive pages that allow users to analyze export operations from multiple perspectives.
Let us explore each dashboard page in detail.
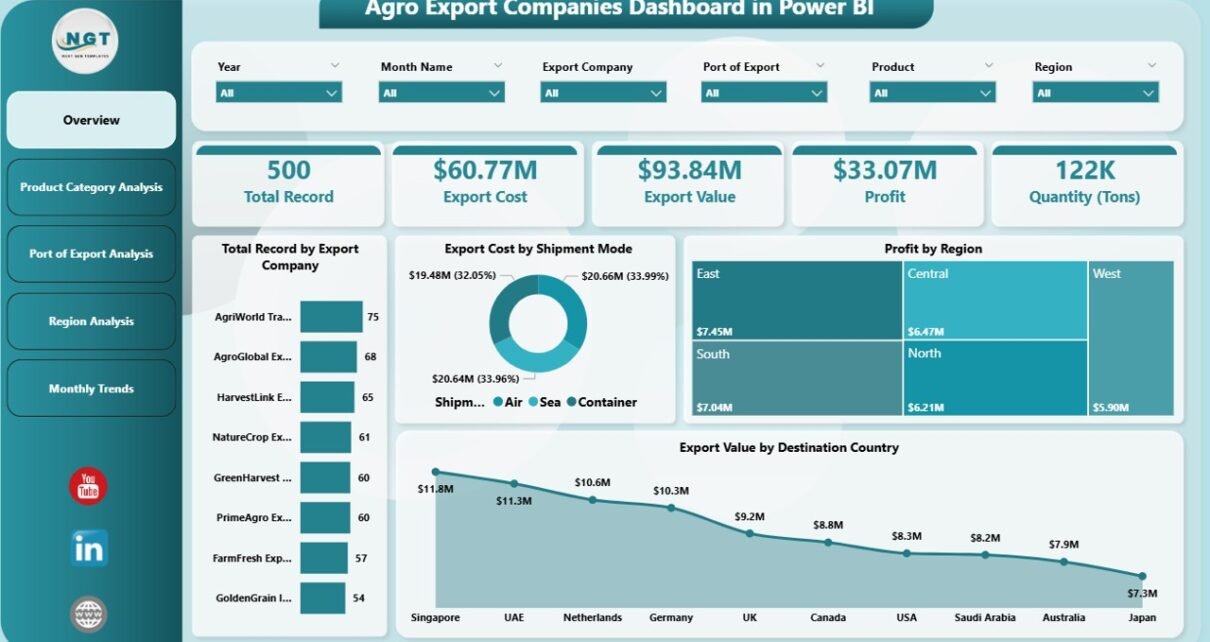
1. Overview Page
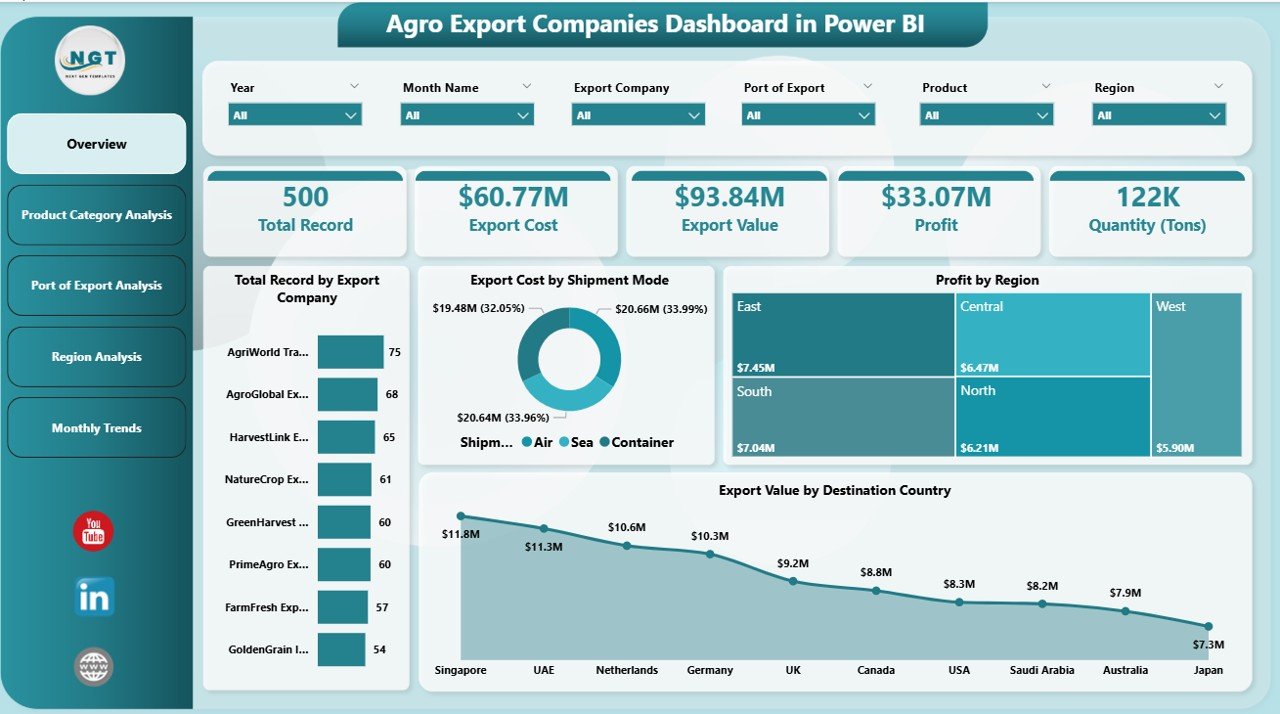
The Overview Page acts as the central control panel of the dashboard. It provides a quick snapshot of export operations and overall performance.
This page contains slicers that allow users to filter data by different parameters such as company, region, product category, or shipment mode.
The Overview Page includes the following KPI cards:
-
Total Record by Export Company
-
Export Cost by Shipment Mode
-
Profit by Region
-
Export Value by Destination Country
These KPI indicators help decision-makers understand the current export situation instantly.
In addition, the overview visuals highlight important export patterns and trends. As a result, managers can quickly identify areas that require attention.
Click to Purchases Agro Export Companies Dashboard in Power BI
2. Product Category Analysis
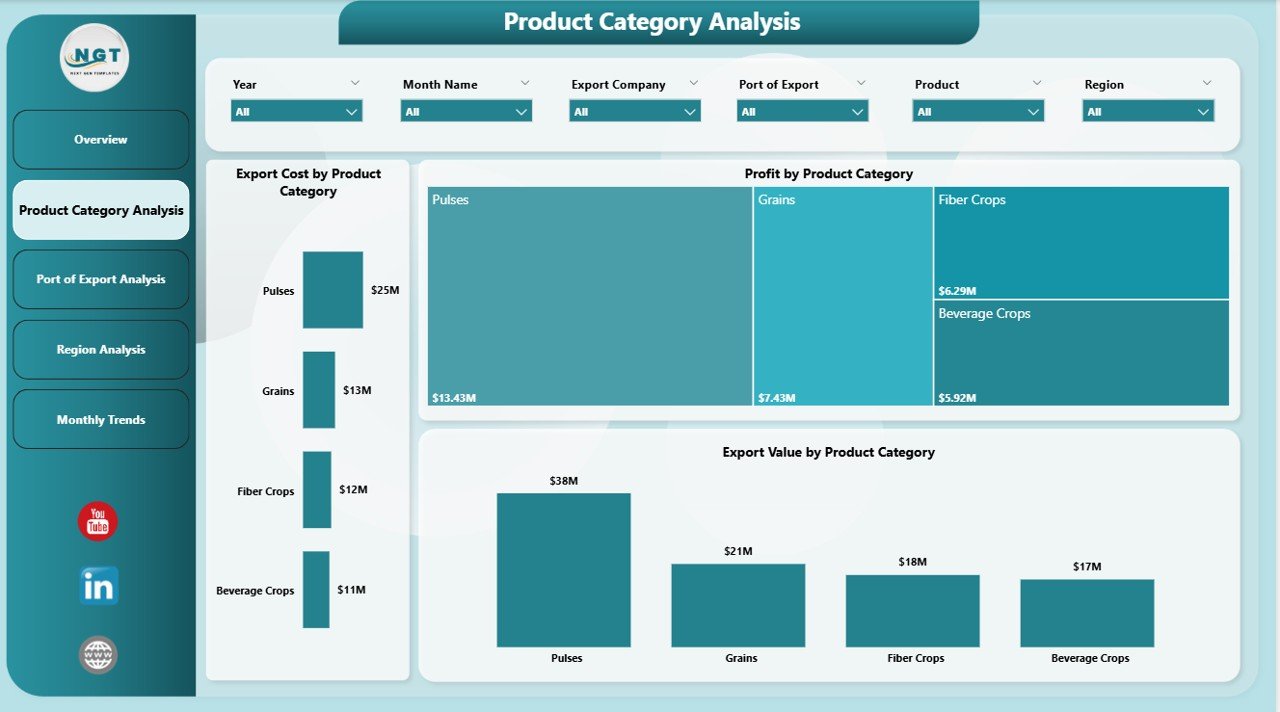
The Product Category Analysis Page focuses on export performance by agricultural product categories.
Since agro export companies deal with multiple products such as grains, spices, fruits, and vegetables, analyzing product-level profitability becomes extremely important.
This page includes the following charts:
-
Export Cost by Product Category
-
Profit by Product Category
-
Export Value by Product Category
These charts allow users to identify:
-
Which products generate the highest revenue
-
Which products involve higher export costs
-
Which categories produce better profit margins
Therefore, companies can optimize their export strategies and focus on the most profitable agricultural products.
3. Port of Export Analysis
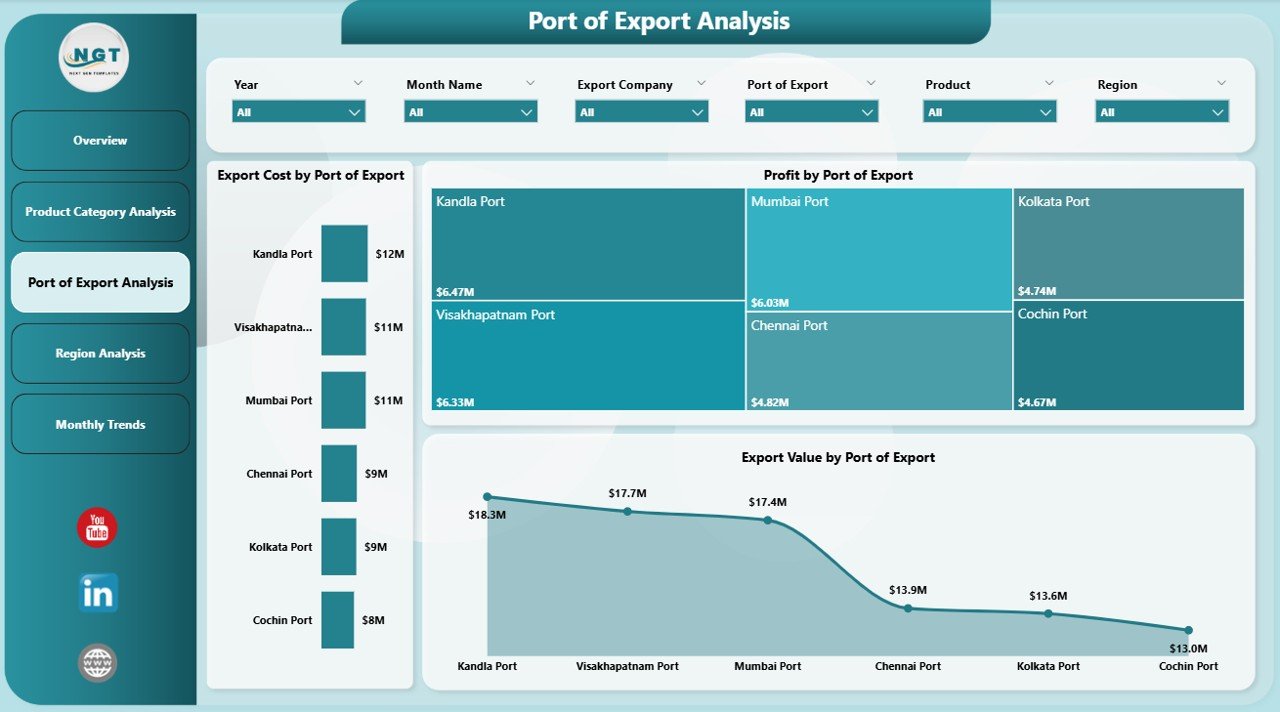
Export logistics plays a critical role in agricultural trade. Different ports handle different shipment volumes and transportation costs.
The Port of Export Analysis Page helps companies evaluate export performance based on port locations.
This page includes the following visualizations:
-
Export Cost by Port of Export
-
Profit by Port of Export
-
Export Value by Port of Export
With this analysis, companies can identify:
-
Which ports handle the largest export volumes
-
Which ports generate higher profits
-
Which ports involve higher shipping costs
Consequently, logistics managers can improve shipment planning and reduce transportation expenses.
Click to Purchases Agro Export Companies Dashboard in Power BI
4. Region Analysis
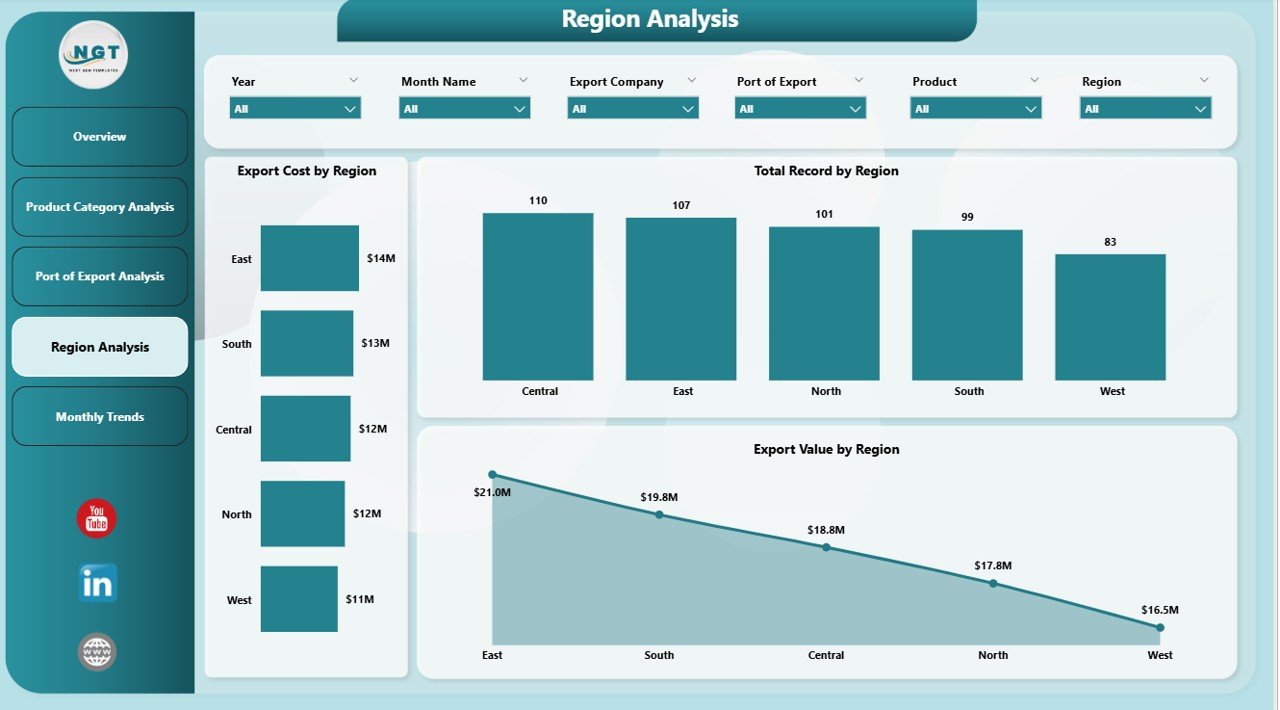
The Region Analysis Page provides insights into export performance across different global regions.
Since agricultural demand varies across countries and regions, companies must continuously monitor regional export trends.
This page includes the following charts:
-
Export Cost by Region
-
Profit by Region
-
Export Value by Region
Using this analysis, businesses can determine:
-
Which regions generate the highest export revenue
-
Which regions produce the highest profit margins
-
Which regions involve higher operational costs
Therefore, companies can adjust their market strategies and focus on high-growth export markets.
5. Month Analysis
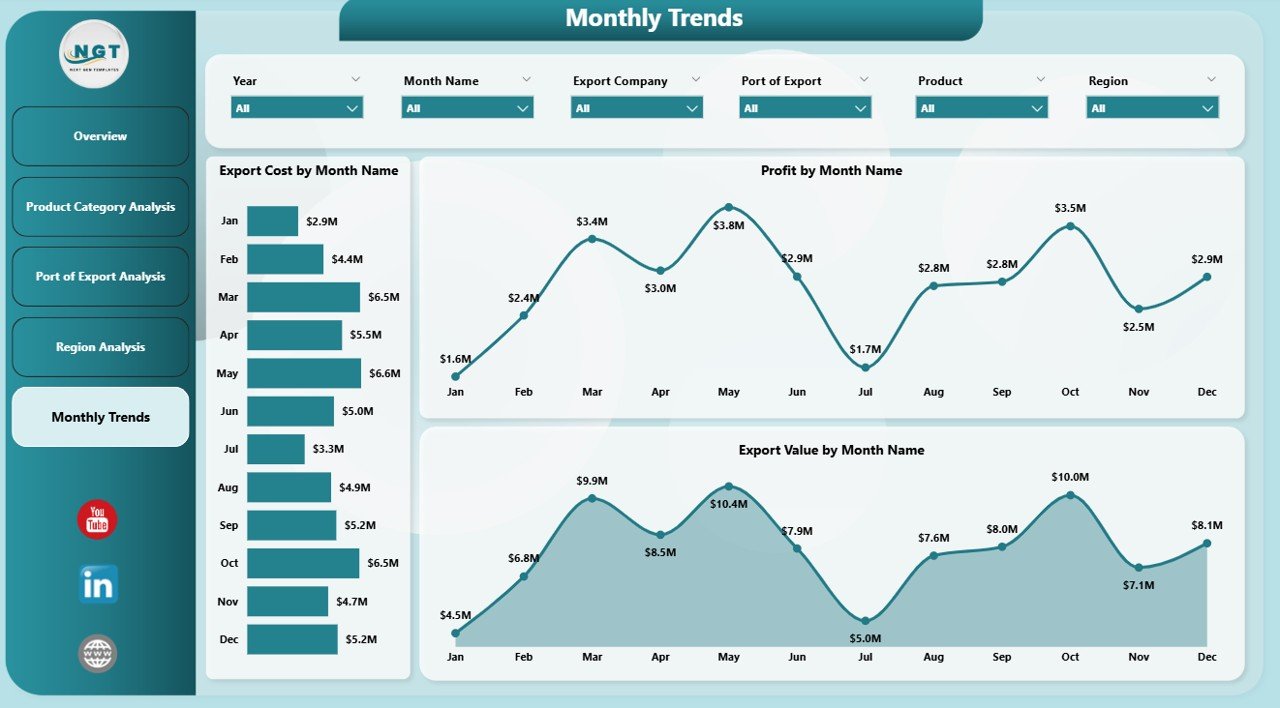
Export performance often changes throughout the year. Seasonal demand, weather conditions, and harvest cycles affect agricultural exports significantly.
The Month Analysis Page helps companies track monthly export trends.
This page includes the following charts:
-
Export Cost by Month
-
Profit by Month
-
Export Value by Month
By analyzing monthly performance, businesses can:
-
Identify peak export seasons
-
Forecast future export demand
-
Plan production and logistics more efficiently
As a result, companies can improve operational planning and supply chain management.
Advantages of Agro Export Companies Dashboard in Power BI
Using a Power BI dashboard offers several advantages for agro export businesses.
1. Real-Time Data Insights
Power BI allows companies to analyze export data instantly. Therefore, managers can monitor business performance without waiting for manual reports.
2. Better Decision Making
Interactive charts and KPIs help decision-makers understand complex export data quickly. As a result, leaders can make faster and smarter strategic decisions.
3. Improved Profit Analysis
The dashboard highlights profit trends by product, region, and shipment mode. Consequently, companies can focus on high-margin export activities.
4. Enhanced Operational Efficiency
When businesses monitor export costs and logistics performance, they can identify inefficiencies and reduce operational expenses.
5. Clear Data Visualization
Power BI converts large datasets into easy-to-understand visual dashboards. Therefore, even non-technical users can interpret the data easily.
Who Can Benefit from the Agro Export Companies Dashboard?
Click to Purchases Agro Export Companies Dashboard in Power BI
Many professionals and organizations can benefit from this dashboard.
For example:
Export Managers
They can monitor shipment performance, export costs, and profit margins.
Supply Chain Managers
They can analyze logistics costs and port performance.
Financial Analysts
They can evaluate revenue trends and profitability.
Agricultural Export Companies
They can track export operations and identify growth opportunities.
Business Executives
They can review high-level business performance and make strategic decisions.
Best Practices for the Agro Export Companies Dashboard
Organizations should follow several best practices to maximize the value of the dashboard.
Maintain Accurate Data
Accurate data ensures reliable insights. Therefore, companies must regularly validate and update export datasets.
Use Clear Data Categories
Well-structured data improves reporting accuracy. Companies should organize data into categories such as product type, shipment mode, region, and port.
Update the Dashboard Regularly
Regular updates help organizations monitor the latest export trends and market changes.
Focus on Key Performance Indicators
Companies should track important metrics such as export cost, export value, and profit margin.
Train Team Members
Training employees to use Power BI dashboards improves adoption and productivity.
How Power BI Improves Agro Export Business Intelligence
Power BI offers several powerful features that improve business intelligence.
These features include:
-
Interactive visualizations
-
Data filtering and slicing
-
Real-time analytics
-
Advanced data modeling
-
Integration with multiple data sources
Because of these capabilities, companies can analyze export data more efficiently and uncover hidden patterns.
Consequently, organizations can improve export strategies and gain competitive advantages in global markets.
Future of Data Analytics in Agricultural Export Industry
Click to Purchases Agro Export Companies Dashboard in Power BI
The agricultural export industry continues to evolve rapidly. Companies increasingly adopt advanced analytics tools to manage complex operations.
In the future, businesses will rely more on:
-
Artificial intelligence for demand forecasting
-
Predictive analytics for export planning
-
Automated reporting systems
-
Real-time supply chain monitoring
Therefore, dashboards like the Agro Export Companies Dashboard in Power BI will play an essential role in modern export management.
Conclusion
Managing agricultural exports requires accurate data analysis, efficient logistics planning, and strong financial monitoring. However, traditional reporting methods often fail to provide clear insights.
The Agro Export Companies Dashboard in Power BI offers a powerful solution by transforming complex export data into interactive visual reports. With multiple analytical pages such as Overview, Product Category Analysis, Port of Export Analysis, Region Analysis, and Month Analysis, businesses can monitor export performance from different perspectives.
Moreover, the dashboard helps companies analyze export costs, track profitability, and identify high-performing markets.
As a result, agro export companies can improve decision-making, increase operational efficiency, and strengthen their position in the global agricultural trade market.
Frequently Asked Questions (FAQs)
What is an Agro Export Companies Dashboard?
An Agro Export Companies Dashboard is a data visualization tool that helps businesses monitor export performance, analyze costs, track profits, and evaluate regional demand.
Why should agro export companies use Power BI?
Power BI allows companies to analyze large datasets using interactive charts and filters. Therefore, organizations can identify export trends and make better decisions.
What metrics can be tracked in this dashboard?
Companies can track several metrics such as:
-
Export Cost
-
Export Value
-
Profit by Region
-
Shipment Mode Performance
-
Monthly Export Trends
Can this dashboard support decision-making?
Yes. The dashboard provides clear insights into export operations. As a result, managers can quickly identify opportunities and risks.
Is Power BI suitable for export businesses?
Yes. Power BI provides powerful analytics tools that help export companies analyze financial performance, logistics operations, and global market trends efficiently.
Visit our YouTube channel to learn step-by-step video tutorials
Watch the step-by-step video tutorial: