In today’s data-driven era, organizations are harnessing the power of Artificial Intelligence (AI) and Machine Learning (ML) to automate processes, improve accuracy, and predict future trends. But even the smartest AI systems need smart monitoring. That’s where the AI and Machine Learning KPI Scorecard in Excel comes into play.
This ready-to-use template helps you track, measure, and visualize AI performance metrics in one place. Built entirely in Microsoft Excel, it empowers teams to evaluate how their AI and ML models are performing, where improvements are needed, and how targets are being met over time.
Let’s explore this powerful scorecard, its structure, features, advantages, and best practices.
Click to Purchases AI and Machine Learning KPI Scorecard in Excel
What Is an AI and Machine Learning KPI Scorecard in Excel?
An AI and Machine Learning KPI Scorecard in Excel is a structured and visual tool designed to monitor key performance indicators (KPIs) for AI initiatives. It helps organizations track model accuracy, data quality, prediction efficiency, training time, and deployment success — all from a single Excel workbook.
Instead of using complex BI platforms, this scorecard makes it easy for data scientists, analysts, and managers to evaluate AI project outcomes using dynamic Excel sheets, formulas, and charts.
The scorecard not only saves time but also promotes data transparency, accountability, and continuous improvement across AI teams.
Why Use Excel for AI and Machine Learning KPIs?
You might wonder — with so many tools available, why Excel? The answer lies in simplicity, flexibility, and accessibility.
-
Universal tool: Every professional knows Excel. No coding required.
-
Easy integration: Import data directly from CSVs, APIs, or data exports from AI systems.
-
Powerful analysis: Excel’s formulas, pivot tables, and conditional formatting can analyze thousands of rows efficiently.
-
Customizable design: You can adapt the scorecard for any AI project or department.
With a few smart formulas and charts, Excel transforms into a mini performance intelligence hub.
Structure of the AI and Machine Learning KPI Scorecard
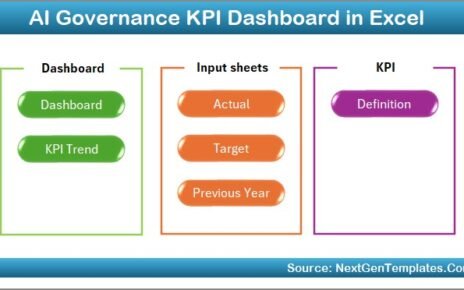
The template is designed with four structured worksheets. Each plays a specific role in managing and visualizing data.
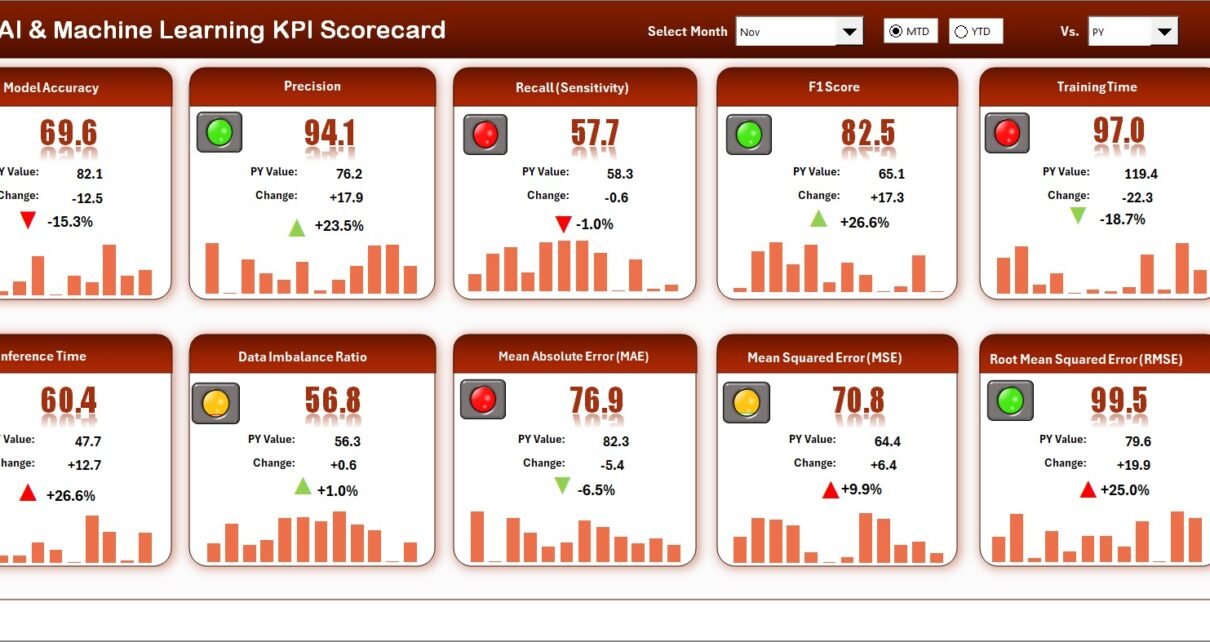
1. Scorecard Sheet (Main Dashboard)
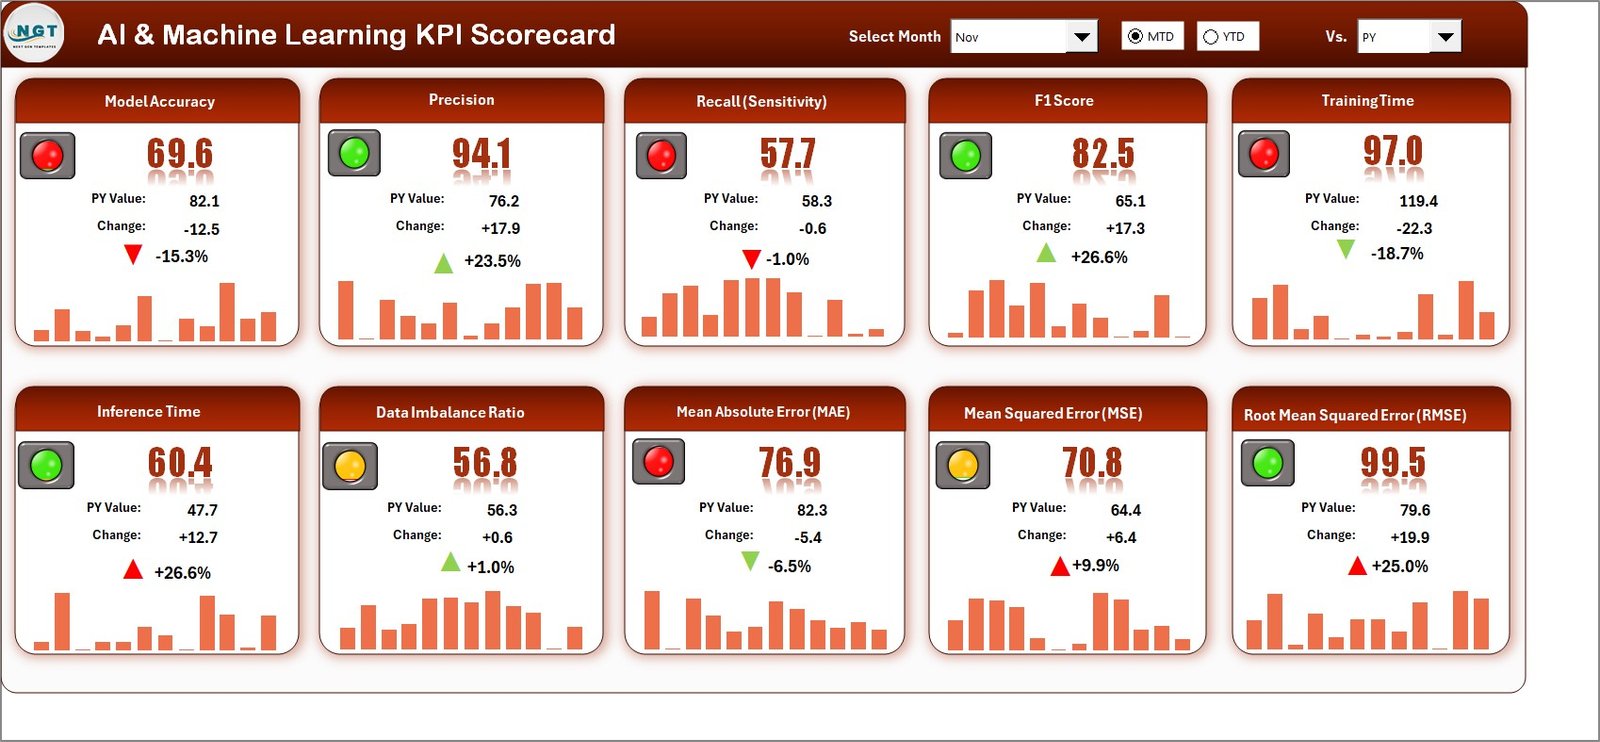
The Scorecard Sheet serves as the main interface — your performance command center.
Here’s what it includes:
-
Dropdown Menus:
You can select the month, and toggle between MTD (Month-to-Date) or YTD (Year-to-Date) to filter results instantly. -
Actual vs Target Comparison:
Each KPI shows both actual and target values, allowing you to evaluate if performance is on track. -
Visual Indicators:
Color-coded formatting (green, yellow, red) helps you identify whether performance is improving or declining. -
Comprehensive KPI View:
All KPIs display side by side with Actual, Target, and Previous Year values — giving a complete picture of AI model success.
This page offers a quick overview of AI performance health — whether it’s model accuracy, data latency, or prediction success.
2. KPI Trend Sheet
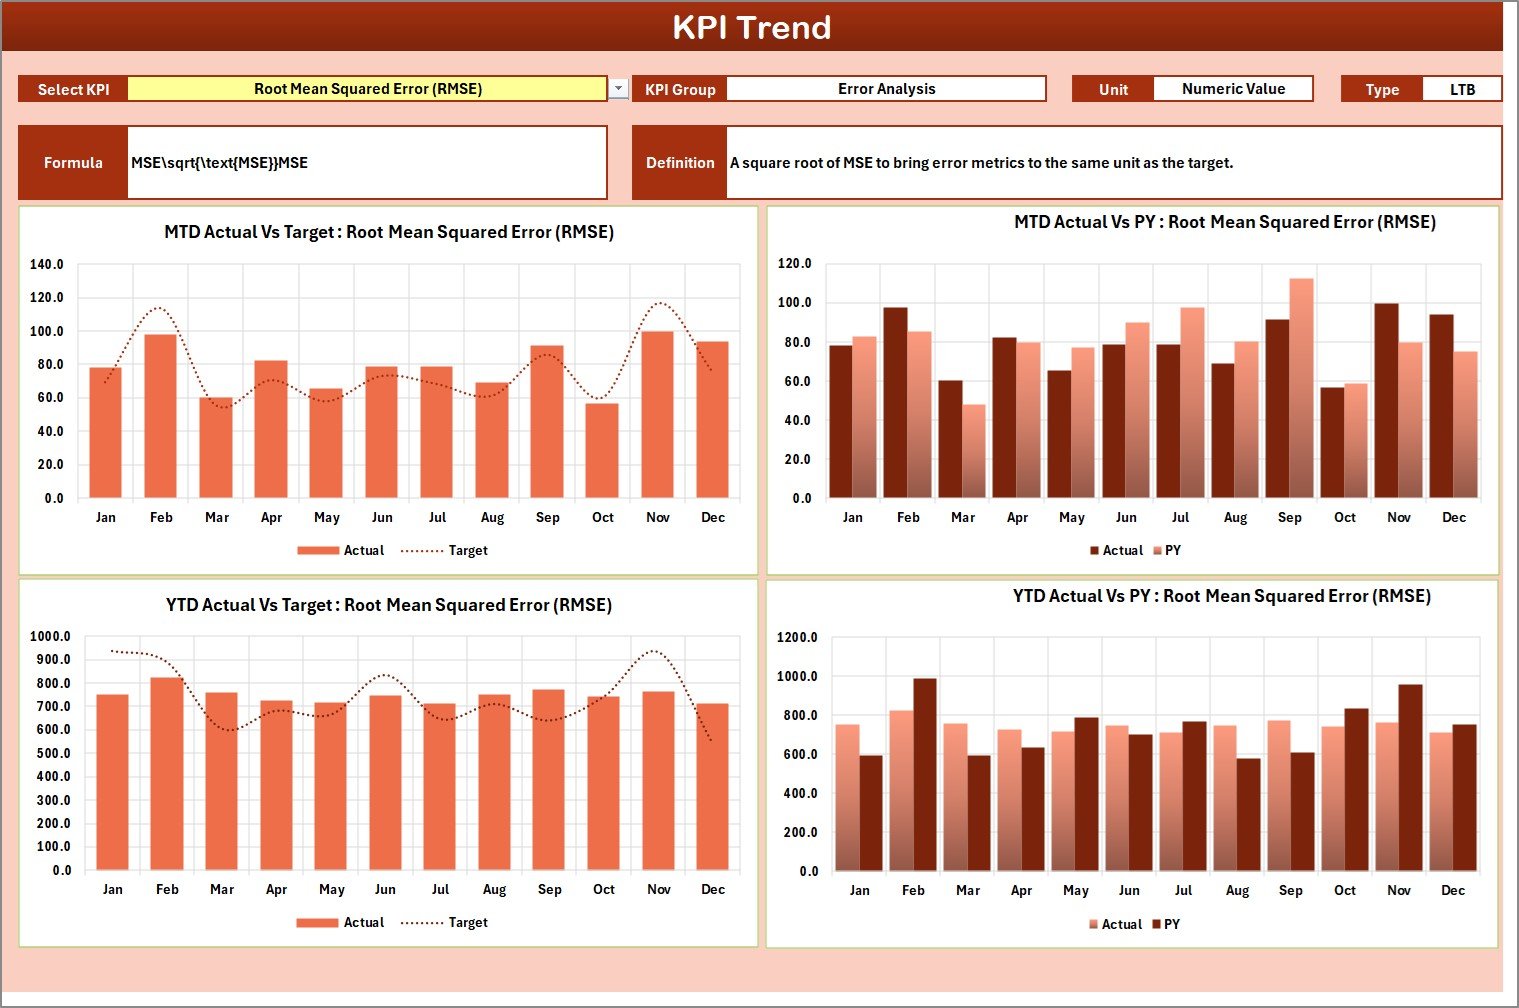
The KPI Trend Sheet offers deeper insights into KPI movement over time.
Key features include:
-
Dynamic KPI Selection:
Choose a specific KPI using the drop-down menu (cell C3). -
Detailed KPI Information:
Automatically display KPI Group, Unit, Type (Lower/Upper the Better), Formula, and Definition. -
Trend Visualization:
Interactive MTD and YTD charts show Actual vs Target vs Previous Year (PY) performance.
This sheet helps analysts identify performance trends — for instance, if your AI model accuracy is improving month after month or declining due to data drift.
3. Input Data Sheet
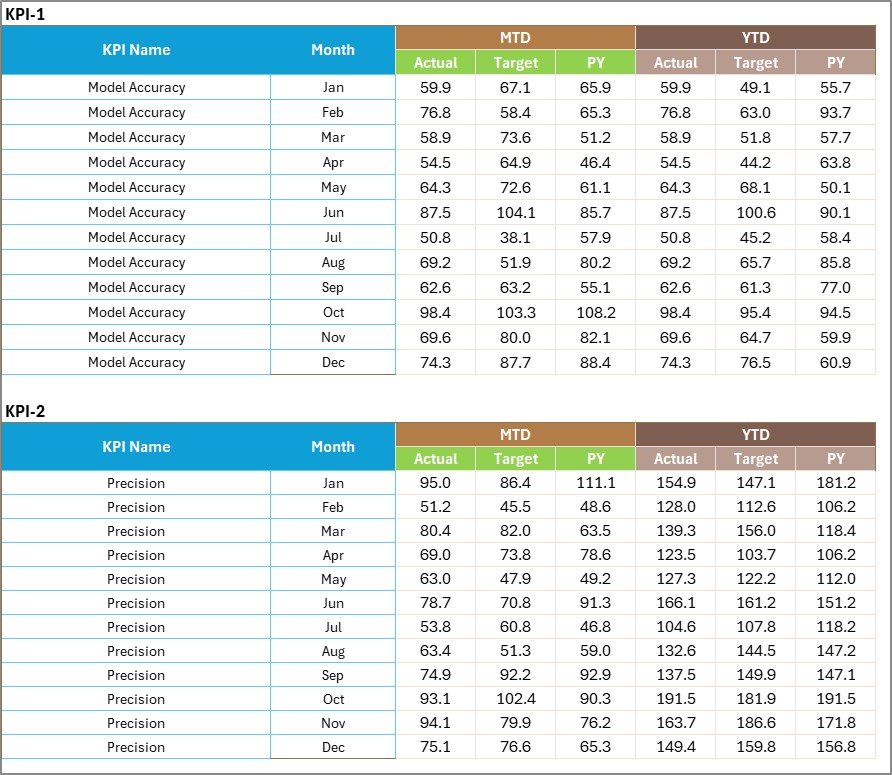
This is the engine that powers your scorecard.
Here you enter all raw KPI data — including:
-
Actual Values: Captured from AI tools, experiments, or production runs.
-
Target Values: Benchmarks or expected results.
-
Time Period: Month or date-wise structure for easy pivoting.
-
Category: KPI Group, Department, or Model Type.
You can update this sheet regularly as new results become available. The moment data is updated, the entire dashboard refreshes automatically.
Click to Purchases AI and Machine Learning KPI Scorecard in Excel
4. KPI Definition Sheet
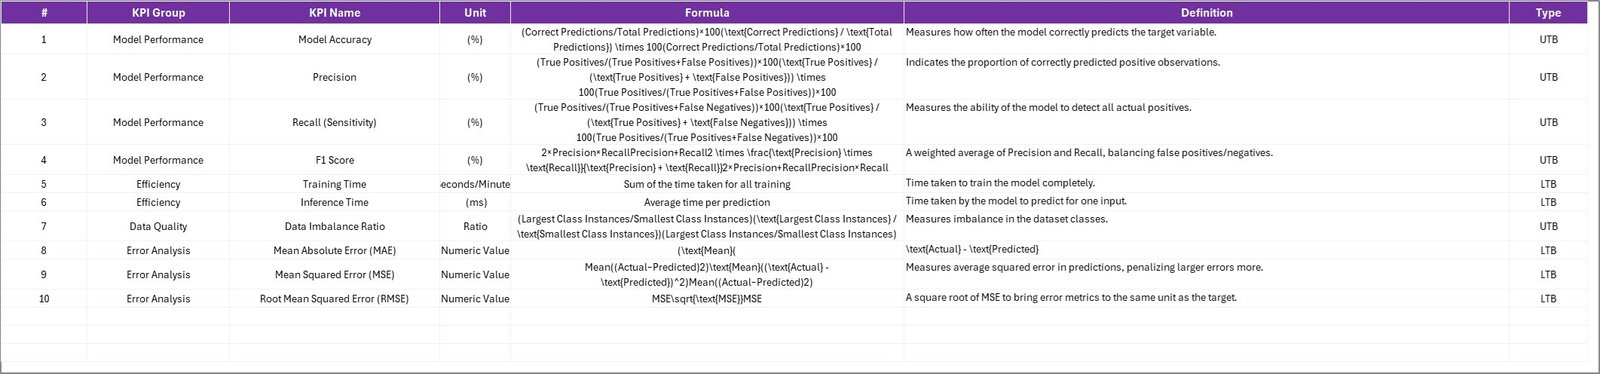
The KPI Definition Sheet acts as a knowledge base for your metrics.
For every KPI, it captures:
-
KPI Name
-
KPI Group
-
Unit of Measurement
-
Formula
-
Definition
-
Performance Direction (Upper or Lower the Better)
This ensures consistency and clarity across teams. Anyone reviewing the dashboard knows exactly how each KPI is defined and calculated.
Examples of AI and Machine Learning KPIs
When tracking AI and ML performance, your KPIs must reflect both technical accuracy and business impact. Below are some key indicators to include:
Model Performance KPIs
-
Model Accuracy (%)
-
Precision (%)
-
Recall (%)
-
F1-Score
-
ROC-AUC Score
Operational Efficiency KPIs
-
Model Training Time (minutes)
-
Inference Time (seconds)
-
Model Deployment Success Rate (%)
-
Model Downtime (hours)
Data Quality KPIs
-
Data Completeness (%)
-
Data Consistency (%)
-
Null Value Ratio (%)
-
Duplicate Records (%)
Business Impact KPIs
-
Cost per Prediction (USD)
-
ROI from AI Implementation (%)
-
Automation Success Rate (%)
-
Error Reduction Percentage (%)
These KPIs provide a 360-degree view of your AI ecosystem — covering accuracy, cost, speed, and stability.
How to Use the Scorecard Effectively
To make the most of this template, follow these simple steps:
-
Unblock the Excel file before opening (Right-click → Properties → Unblock).
-
Enter data in the Input Data Sheet.
-
Select time period in the Scorecard Sheet (Month, MTD, or YTD).
-
View charts and indicators on the Trend Sheet.
-
Check definitions for clarity on KPI formulas.
Within minutes, you’ll have a real-time AI performance dashboard ready to present in meetings or reviews.
Click to Purchases AI and Machine Learning KPI Scorecard in Excel
Advantages of AI and Machine Learning KPI Scorecard in Excel
Using this scorecard offers multiple organizational and operational benefits:
1. Centralized Performance Tracking
All AI metrics are visible in one file — from data quality to business impact — ensuring full transparency.
2. Time Savings
Manual reporting is eliminated. Once data is updated, charts and KPIs refresh automatically.
3. Better Decision-Making
Visual cues like color coding and arrows make it easy to spot underperforming models or data issues.
4. Enhanced Collaboration
Both technical and non-technical teams can understand the dashboard, bridging communication gaps.
5. Continuous Improvement
Trends over months reveal whether AI initiatives are improving or declining, helping teams take corrective action quickly.
6. No Additional Software Needed
The template runs entirely in Excel — no coding or external tools required.
Opportunities for Improvement
Even the most advanced Excel scorecard can evolve further. Here are some ways to enhance it:
-
Integrate Automation:
Use Power Query or VBA to import AI data automatically from Python outputs or APIs. -
Add Power BI Connection:
Extend the same dataset into Power BI for deeper visualization. -
Include Model Lifecycle Metrics:
Add columns to track model retraining frequency, version control, and data drift. -
Use Forecasting Functions:
Apply Excel’s built-in FORECAST or LINEST formulas to project future KPI values.
These improvements can make the scorecard even more powerful and predictive.
Click to Purchases AI and Machine Learning KPI Scorecard in Excel
Best Practices for the AI and Machine Learning KPI Scorecard
Follow these guidelines to maintain data accuracy and usability:
-
Define KPIs Clearly:
Ensure every KPI has a clear formula, definition, and owner. -
Update Data Regularly:
Keep monthly or weekly updates consistent to maintain relevance. -
Use Conditional Formatting Wisely:
Highlight top performance in green, moderate in yellow, and low in red. -
Validate Data Inputs:
Double-check that actual and target values align with your AI tool outputs. -
Protect Sensitive Data:
If using real production metrics, secure sheets with passwords or access controls. -
Document Changes:
Maintain a “Change Log” tab to record updates or version modifications.
By following these practices, you ensure that your scorecard remains accurate, relevant, and actionable.
How This Scorecard Supports Decision-Making
The AI and Machine Learning KPI Scorecard is not just a visualization tool — it’s a strategic decision-support system.
-
For Data Scientists: Helps evaluate model performance trends.
-
For Business Leaders: Offers a visual summary of AI ROI and success.
-
For Operations Teams: Highlights where automation is performing well or failing.
-
For Executives: Delivers a concise view of enterprise AI effectiveness.
When everyone uses the same transparent scorecard, decision-making becomes faster and data-driven.
How to Customize the Scorecard for Your Organization
The best part about this template is its flexibility. You can tailor it for different AI applications such as:
-
Predictive Analytics: Track model accuracy, forecast variance, and data quality.
-
Natural Language Processing (NLP): Measure precision, recall, and sentiment classification accuracy.
-
Computer Vision: Track image recognition success rate and false positives.
-
Chatbots and Conversational AI: Monitor response accuracy, average resolution time, and satisfaction scores.
To customize:
-
Add or rename KPI groups in the definition sheet.
-
Modify formulas to align with your KPIs.
-
Insert new charts or slicers for filtering by AI model or dataset.
This makes the template truly adaptable across AI projects and industries.
Common Challenges in Measuring AI Performance
While AI systems are complex, measuring their performance doesn’t have to be. However, there are common challenges teams should be aware of:
-
Inconsistent Data Sources: When data comes from multiple platforms, normalization is key.
-
Misaligned KPIs: Ensure KPIs reflect business outcomes, not just technical success.
-
Data Drift: AI models degrade over time as patterns change — tracking trends helps detect this.
-
Lack of Visualization: Without visual cues, stakeholders may misinterpret results.
The KPI Scorecard in Excel helps overcome all these challenges with structure and clarity.
Click to Purchases AI and Machine Learning KPI Scorecard in Excel
Real-World Example of KPI Analysis
Imagine an e-commerce company using AI for product recommendations.
They track KPIs like:
-
Model Accuracy: 92%
-
Customer Conversion Rate: 5.8%
-
Recommendation Click-Through Rate: 14%
-
Model Update Frequency: Monthly
The Excel scorecard shows declining accuracy over two months. The Trend Sheet highlights a data drift issue. The team retrains the model and accuracy rebounds to 95%.
This shows how KPI scorecards turn insights into actionable decisions.
Conclusion
The AI and Machine Learning KPI Scorecard in Excel is more than a reporting tool — it’s a strategic performance companion for any AI-driven organization.
By bringing together all essential KPIs in one place, it helps businesses track progress, identify improvement areas, and make smarter decisions.
Whether you’re a data scientist evaluating model precision or a manager reviewing AI ROI, this Excel-based template simplifies complex analytics into meaningful visuals.
Start using it today and bring clarity, consistency, and confidence to your AI performance tracking.
Click to Purchases AI and Machine Learning KPI Scorecard in Excel
Frequently Asked Questions (FAQs)
1. What is an AI and Machine Learning KPI Scorecard?
It’s an Excel-based tool that helps track performance metrics for AI and ML projects such as accuracy, training time, and deployment success.
2. Who should use this scorecard?
Data scientists, analysts, business managers, and anyone involved in AI project monitoring can use it.
3. Can I add my own KPIs?
Yes, the template is fully editable. You can modify KPI definitions, formulas, and groups as needed.
4. Does it support visual charts?
Absolutely! The Trend Sheet includes dynamic charts for MTD, YTD, and Previous Year comparisons.
5. How often should I update the data?
It’s recommended to update monthly or weekly based on your AI project cycle.
6. Can I connect it with Power BI or Python?
Yes, you can link it via Power Query or export CSV outputs from Python for automated data updates.
7. Is it beginner-friendly?
Yes. The scorecard requires only basic Excel knowledge — no coding or technical setup needed.
8. What makes it better than standard AI reports?
Unlike static reports, the scorecard provides interactive, color-coded, and trend-based insights that make analysis faster and easier.
Click to Purchases AI and Machine Learning KPI Scorecard in Excel
Visit our YouTube channel to learn step-by-step video tutorials