Artificial Intelligence has completely transformed the creative industry. Today, AI art studios create stunning digital artwork using tools like generative AI models, image generators, and machine learning algorithms. These studios work with multiple clients, art categories, sales platforms, and AI tools. Therefore, managing projects, costs, revenue, and profitability becomes challenging without proper data tracking.
Many AI art studios struggle with scattered spreadsheets, manual reports, and inconsistent performance tracking. As a result, studio managers often find it difficult to evaluate which art categories perform best, which AI tools generate higher profits, and which sales platforms drive the most revenue.
Click to Purchases AI Art Studios Dashboard in Excel
Therefore, studios need a centralized and visual system to monitor their performance.
This is exactly where the AI Art Studios Dashboard in Excel becomes extremely useful.
The AI Art Studios Dashboard in Excel is a ready-to-use analytics template designed to track revenue, profit, production cost, and project completion across different categories, client types, and AI tools. Moreover, the dashboard converts raw operational data into clear visual insights so that studio managers can quickly evaluate performance and make better business decisions.
In this comprehensive guide, we will explore the AI Art Studios Dashboard in Excel, including its features, dashboard pages, advantages, best practices, and frequently asked questions.
What is an AI Art Studios Dashboard in Excel?
An AI Art Studios Dashboard in Excel is an interactive performance monitoring tool designed for AI-based creative studios.
Instead of analyzing complex data manually, the dashboard organizes operational information into visual charts, KPIs, and performance indicators.
The dashboard helps studios monitor key metrics such as:
-
Revenue by art category
-
Profit margin by region
-
Production cost by platform
-
Project completion rates
-
Revenue by AI tools used
-
Client type profitability
-
Monthly performance trends
Because Excel offers powerful analytics features like pivot tables, slicers, charts, and formulas, the dashboard allows studio managers to quickly analyze performance across multiple dimensions.
As a result, teams can identify profitable opportunities, reduce costs, and improve production efficiency.
Why Do AI Art Studios Need a Dashboard?
AI art studios operate in a fast-growing digital market. They serve clients across multiple platforms, industries, and regions. However, without proper analytics, studios cannot clearly understand their performance.
Therefore, a dashboard helps studios solve several challenges.
Common Challenges in AI Art Studios
Many studios face problems such as:
-
Difficulty tracking revenue across platforms
-
Lack of visibility into profitable art categories
-
Inefficient cost tracking
-
Difficulty analyzing client type performance
-
Limited insights into AI tool efficiency
Because of these challenges, studios often make decisions based on guesswork.
However, when studios use a structured Excel dashboard, they gain clear visibility into business performance.
Click to Purchases AI Art Studios Dashboard in Excel
Key Features of the AI Art Studios Dashboard in Excel
The AI Art Studios Dashboard in Excel contains several powerful features designed to simplify data analysis.
1. Page Navigator
The Page Navigator, located on the left side of the dashboard, allows users to quickly switch between different analytical pages.
Instead of scrolling through multiple worksheets, users can easily navigate across dashboard sections with a single click.
This improves user experience and saves time during analysis.
Dashboard Structure – Pages Included in the Template
The dashboard contains five analytical pages in the Excel desktop application.
Each page focuses on a different aspect of studio performance.
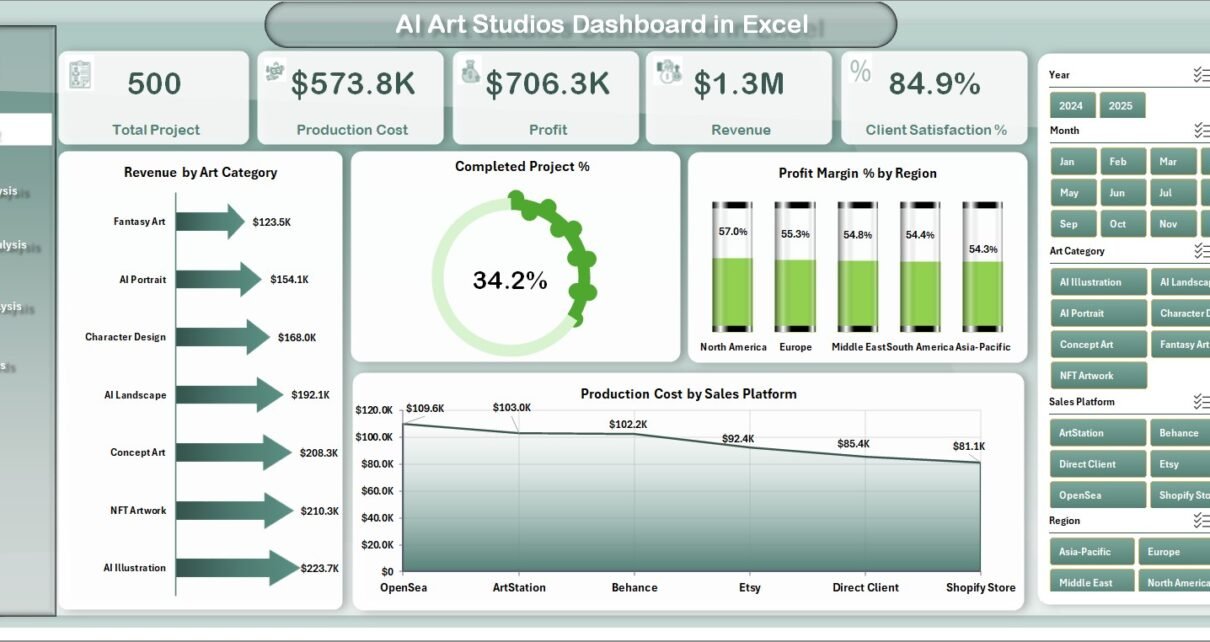
1. Overview Page
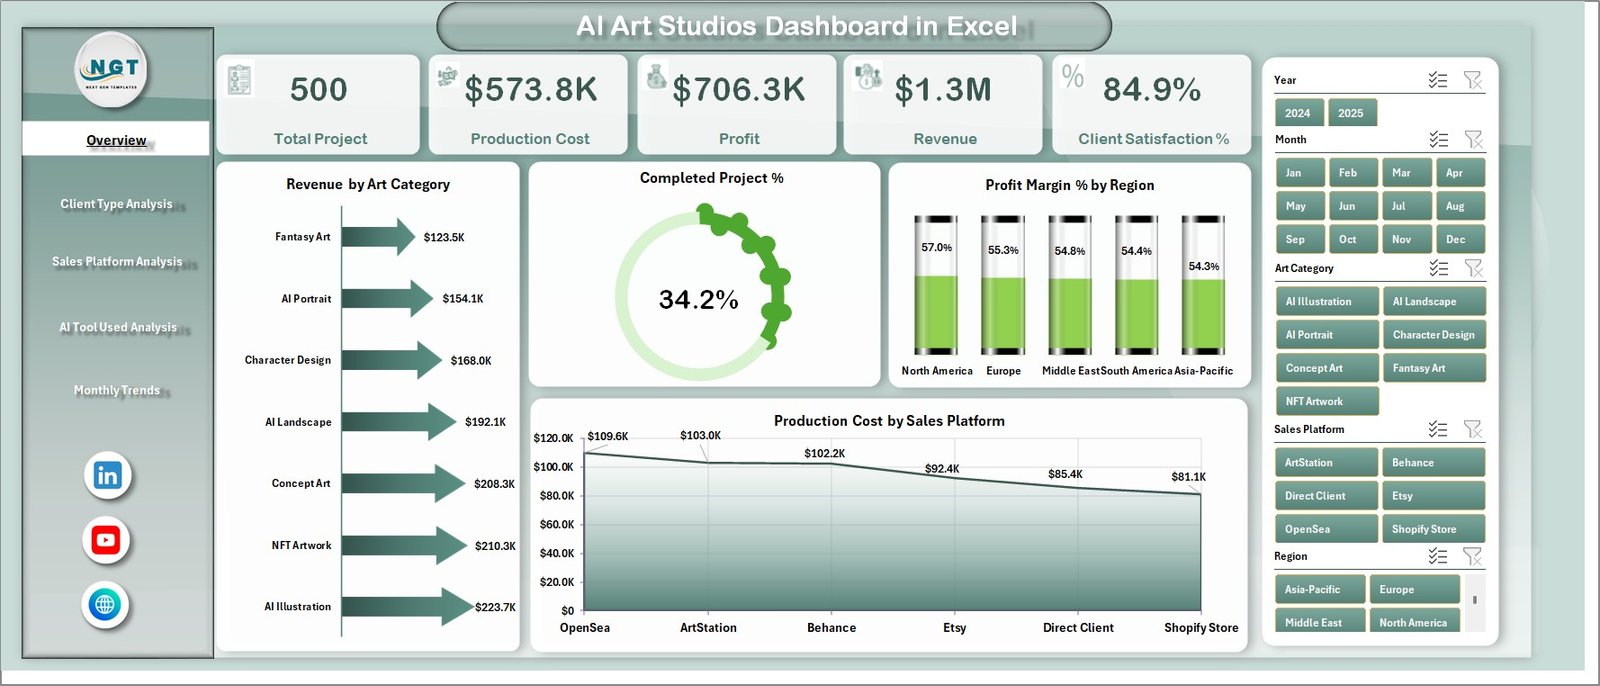
The Overview Page serves as the main dashboard interface.
Here, users can quickly evaluate the overall performance of the AI art studio.
Key Elements on the Overview Page
Slicer (Filter Panel)
The right-side slicer allows users to filter the dashboard based on specific categories.
Therefore, users can easily analyze selected segments.
KPI Cards
The dashboard includes four key performance indicator cards, which provide a quick summary of important metrics.
Charts Available on the Overview Page
The Overview Page contains the following charts:
-
Revenue by Art Category
-
Completed Project Percentage
-
Profit Margin % by Region
-
Production Cost by Sales Platform
These visualizations help managers instantly understand overall performance trends.
2. Client Type Analysis
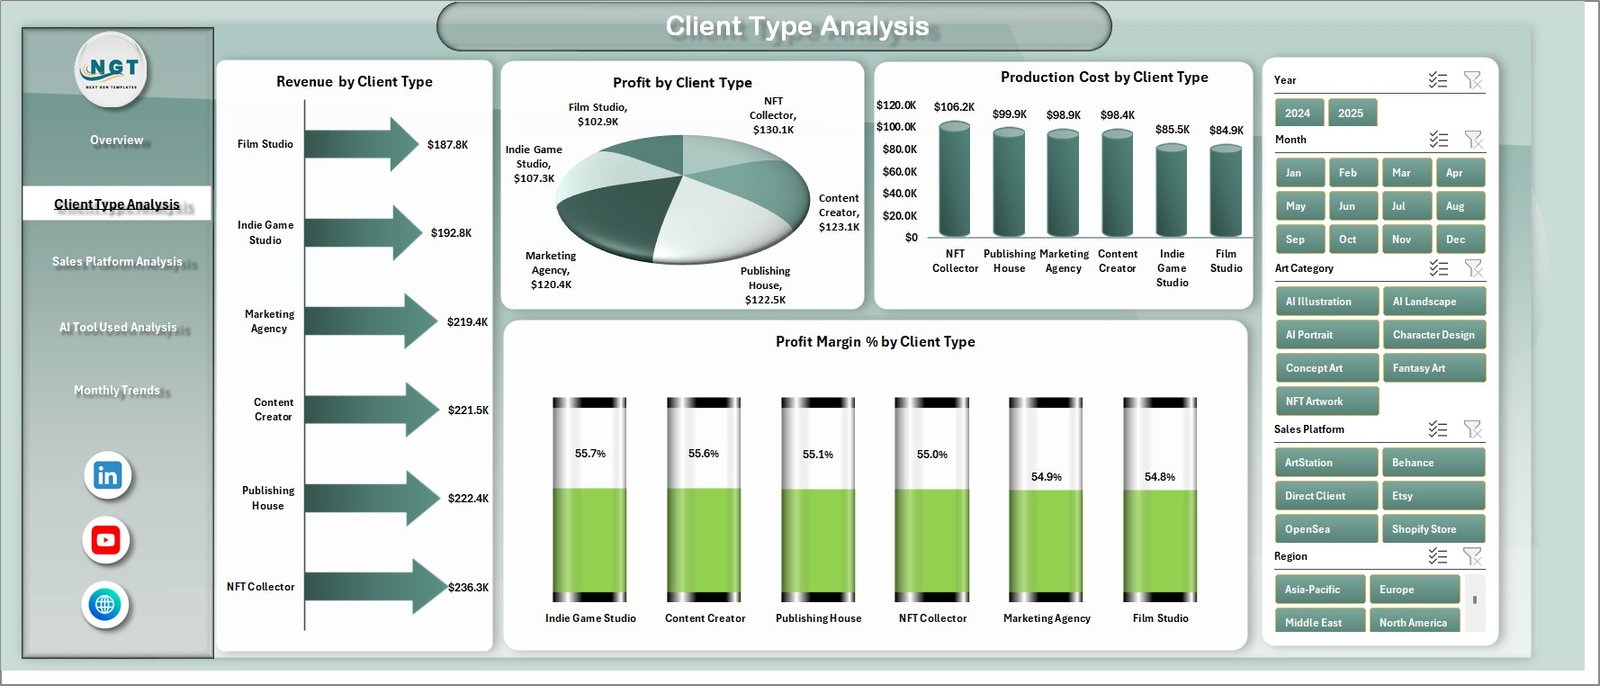
Different clients generate different revenue levels. Therefore, analyzing client type performance helps studios identify their most profitable customers.
The Client Type Analysis Page focuses on client-based analytics.
Charts Included
-
Revenue by Client Type
-
Profit by Client Type
-
Production Cost by Client Type
-
Profit Margin % by Client Type
These charts allow studios to identify:
-
High-value client segments
-
Low-profit client categories
-
Cost efficiency by client type
As a result, studios can adjust their pricing strategy and client targeting.
Click to Purchases AI Art Studios Dashboard in Excel
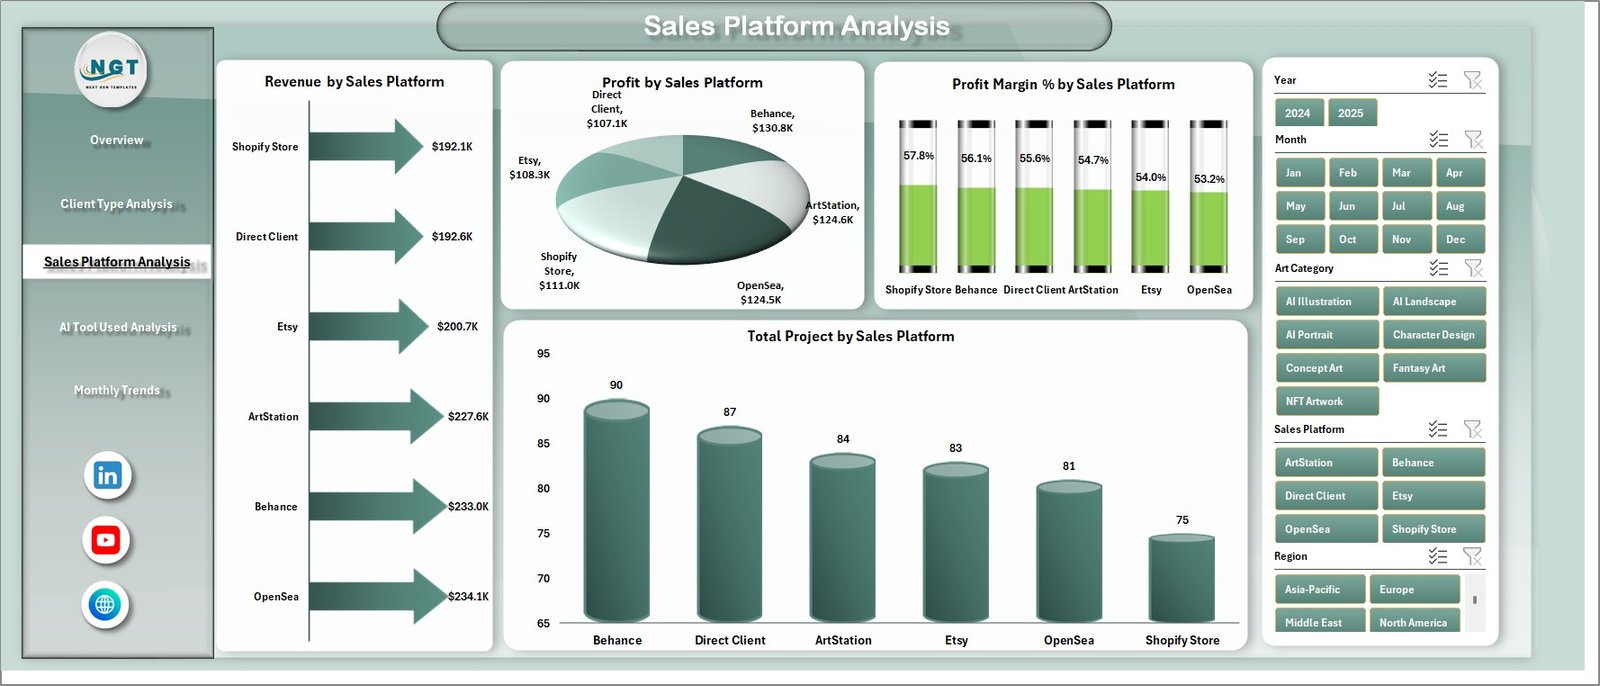
3. Sales Platform Analysis
AI art studios often sell artwork across multiple platforms such as:
-
Online marketplaces
-
Freelance platforms
-
NFT platforms
-
Direct website sales
-
Social media channels
Therefore, understanding platform performance becomes essential.
The Sales Platform Analysis Page provides insights into platform-level performance.
Charts Included
-
Revenue by Sales Platform
-
Profit by Sales Platform
-
Total Projects by Sales Platform
-
Profit Margin % by Sales Platform
Because of this analysis, studios can determine which platforms generate the highest profit.
4. AI Tool Used Analysis
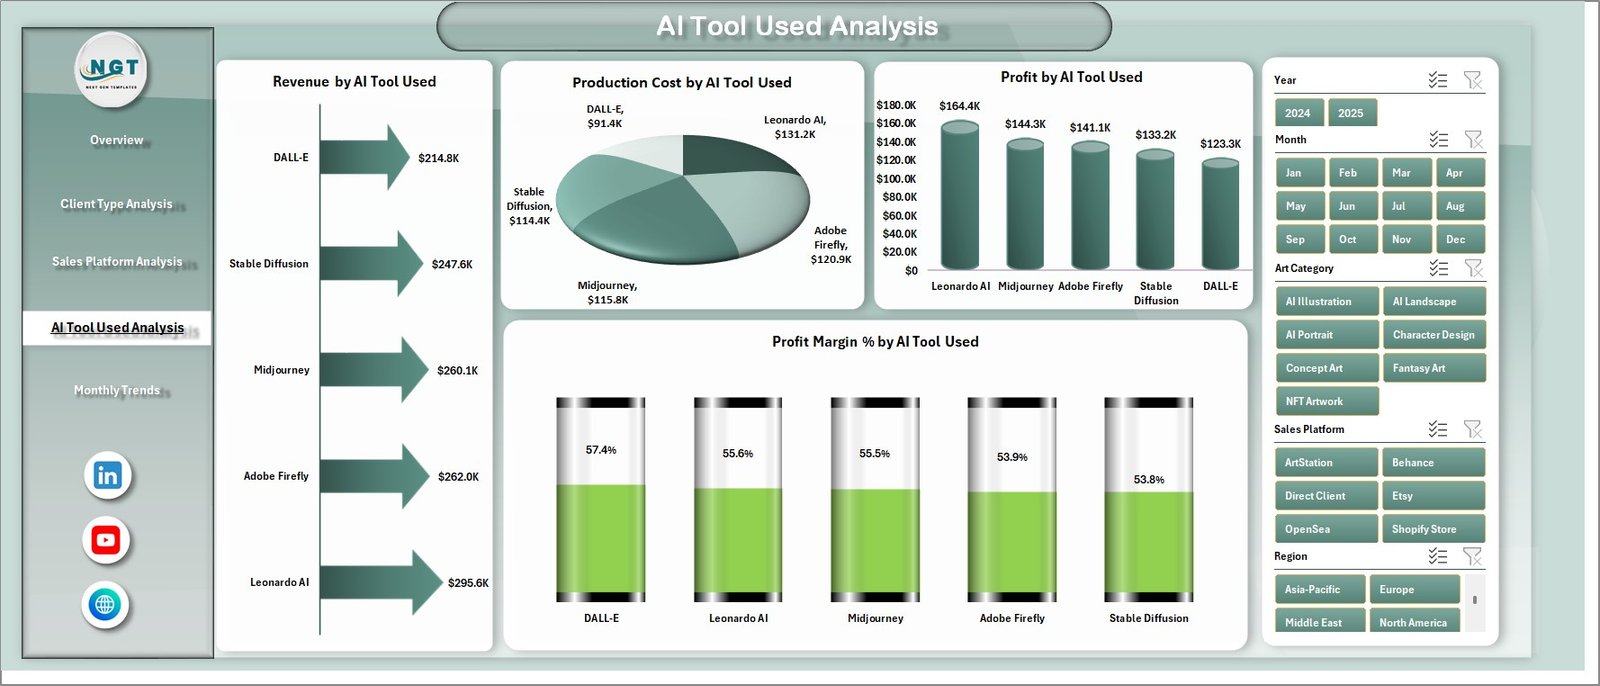
AI art studios use multiple AI tools such as image generators, design tools, and editing software.
However, not all tools generate the same level of efficiency or profitability.
The AI Tool Used Analysis Page helps studios evaluate the performance of different AI tools.
Charts Included
-
Revenue by AI Tool Used
-
Profit by AI Tool Used
-
Production Cost by AI Tool Used
-
Profit Margin % by AI Tool Used
Therefore, studios can identify:
-
Most profitable AI tools
-
Tools that reduce production costs
-
Tools that increase project output
Consequently, studios can optimize their creative workflow.
5. Month Analysis
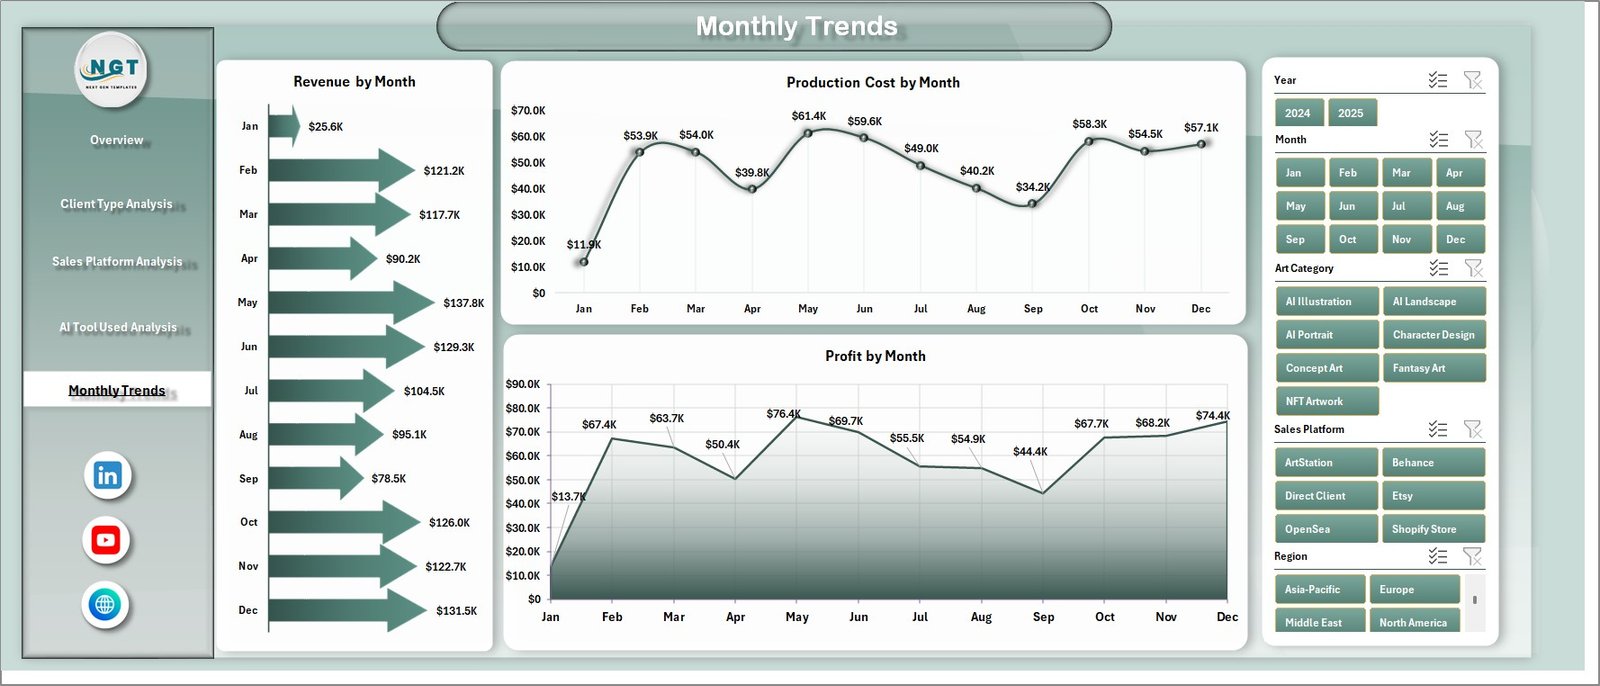
Monthly performance tracking helps studios monitor business growth and seasonal trends.
The Month Analysis Page focuses on time-based performance.
Charts Included
-
Revenue by Month
-
Profit by Month
-
Production Cost by Month
Because of these charts, managers can identify:
-
High-performing months
-
Seasonal revenue patterns
-
Cost fluctuations
This helps studios improve financial planning.
Supporting Sheets in the Dashboard
In addition to analytical pages, the dashboard includes support sheets.
Data Sheet
The Data Sheet stores all raw data used in the dashboard.
It contains structured information such as:
-
Project ID
-
Client Type
-
Art Category
-
AI Tool Used
-
Sales Platform
-
Revenue
-
Production Cost
-
Profit
-
Region
-
Month
Because all visualizations pull data from this sheet, updating the dashboard becomes simple.
Users only need to add new records to refresh the analysis.
Click to Purchases AI Art Studios Dashboard in Excel
Advantages of AI Art Studios Dashboard in Excel
The AI Art Studios Dashboard in Excel offers several benefits for creative studios.
1. Centralized Data Management
Instead of using multiple spreadsheets, studios can store all project data in one place.
Therefore, data management becomes much easier.
2. Faster Decision-Making
Visual charts make performance analysis simple.
As a result, managers can quickly identify opportunities and problems.
3. Improved Profitability Analysis
The dashboard shows profit margins across:
-
Regions
-
Client types
-
Platforms
-
AI tools
Consequently, studios can focus on the most profitable areas.
4. Better Project Monitoring
Studios can track:
-
Completed project percentages
-
Production costs
-
Monthly revenue trends
Therefore, teams stay aligned with business goals.
5. Easy Customization
Because the dashboard uses Excel, users can easily customize:
-
Charts
-
KPIs
-
Filters
-
Data fields
How to Use the AI Art Studios Dashboard in Excel?
Using the dashboard is very simple.
Follow these steps:
Step 1 – Enter Data
First, open the Data Sheet and enter project details.
Include fields such as:
-
Client type
-
Art category
-
Sales platform
-
AI tool used
-
Revenue
-
Production cost
-
Region
-
Month
Step 2 – Refresh the Dashboard
After entering data, refresh the pivot tables.
Excel will automatically update charts and KPIs.
Step 3 – Use Filters
Use the slicers to filter the dashboard based on:
-
Art category
-
Client type
-
Region
-
Platform
-
AI tool
This helps you analyze specific business segments.
Step 4 – Analyze Performance
Finally, review charts and KPIs to identify insights.
Look for:
-
High-profit categories
-
High-cost platforms
-
Top-performing AI tools
-
Seasonal revenue patterns
Best Practices for the AI Art Studios Dashboard
To get the best results from the dashboard, studios should follow several best practices.
Maintain Clean Data
Always ensure that:
-
Data remains accurate
-
Duplicate records get removed
-
All fields remain consistent
Clean data improves dashboard accuracy.
Update Data Regularly
Update project data weekly or monthly.
Therefore, the dashboard always reflects the latest performance.
Use Consistent Categories
Ensure that art categories, client types, and platforms remain consistent.
For example:
-
Use the same spelling
-
Avoid duplicate category names
Consistency improves analysis accuracy.
Monitor Key Metrics
Focus on important metrics such as:
-
Profit margin
-
Production cost
-
Platform performance
-
Tool efficiency
This helps studios make better decisions.
Review Monthly Trends
Always analyze monthly performance.
This helps studios detect growth patterns and market demand changes.
How Can AI Art Studios Improve Business Performance Using This Dashboard?
Click to Purchases AI Art Studios Dashboard in Excel
The dashboard provides actionable insights that help studios improve their operations.
For example:
-
Studios can identify profitable art categories and focus on them.
-
Managers can reduce costs by optimizing production workflows.
-
Teams can select the most efficient AI tools.
-
Marketing teams can prioritize high-performing platforms.
As a result, studios can grow faster and operate more efficiently.
Future of AI Art Studios Analytics
The AI art industry continues to grow rapidly.
Therefore, studios will increasingly rely on analytics dashboards.
In the future, studios may integrate:
-
Real-time AI production analytics
-
Automated revenue tracking
-
Client behavior analytics
-
AI performance benchmarking
However, even today, Excel dashboards provide a powerful and affordable analytics solution.
Conclusion
AI art studios operate in a highly dynamic digital environment. Therefore, tracking revenue, profit, production costs, and project performance becomes essential.
The AI Art Studios Dashboard in Excel provides a simple yet powerful way to monitor studio operations.
Because the dashboard converts raw project data into visual insights, studio managers can easily evaluate performance across art categories, client types, platforms, and AI tools.
Moreover, the dashboard helps teams identify profitable opportunities, reduce costs, and improve creative workflows.
As the AI creative industry continues to grow, using data-driven tools like this dashboard will help studios stay competitive and profitable.
Frequently Asked Questions (FAQs)
What is an AI Art Studios Dashboard in Excel?
An AI Art Studios Dashboard in Excel is an interactive analytics tool that helps studios monitor revenue, profit, production costs, and project performance using charts and KPIs.
Who can use the AI Art Studios Dashboard?
The dashboard is useful for:
-
AI art studios
-
Digital artists
-
NFT creators
-
Creative agencies
-
Digital content studios
Can beginners use this Excel dashboard?
Yes. The dashboard is user-friendly.
Users only need to enter project data in the data sheet, and the dashboard automatically updates charts and KPIs.
Can I customize the dashboard?
Yes. Excel allows users to customize:
-
Charts
-
KPIs
-
Filters
-
Data fields
Therefore, studios can adapt the dashboard based on their needs.
What data should be included in the dashboard?
Typical data fields include:
-
Project ID
-
Client Type
-
Art Category
-
AI Tool Used
-
Sales Platform
-
Revenue
-
Production Cost
-
Profit
-
Region
-
Month
Why is Excel a good tool for dashboards?
Excel offers powerful features such as:
-
Pivot tables
-
Charts
-
Slicers
-
Formulas
-
Data analysis tools
Therefore, Excel becomes an excellent platform for creating business dashboards.
Visit our YouTube channel to learn step-by-step video tutorials