Introduction
The AI Research Labs KPI Dashboard in Power BI is a dynamic, user-friendly tool designed to track and analyze key performance indicators (KPIs) effectively. With data captured from an Excel file, this dashboard offers comprehensive insights into KPI trends, performance comparisons, and detailed definitions, empowering AI research teams to make data-driven decisions.
Key Features of AI Research Labs KPI Dashboard in Power BI
- Interactive slicers for Month and KPI Group selection.
- Real-time KPI monitoring with Total KPIs count, MTD (Month-to-Date) Target Met and Missed counts.
- Visual indicators displaying KPI status with colored arrows for quick understanding.
- Comparison of current and previous year’s MTD and YTD (Year-to-Date) values.
- Detailed drill-through KPI definitions including formulas and unit of measurement.
- Data sourced and updated easily through a structured Excel workbook.
- Three well-structured pages for summary, trend analysis, and KPI definitions.
Dashboard Pages Explanation
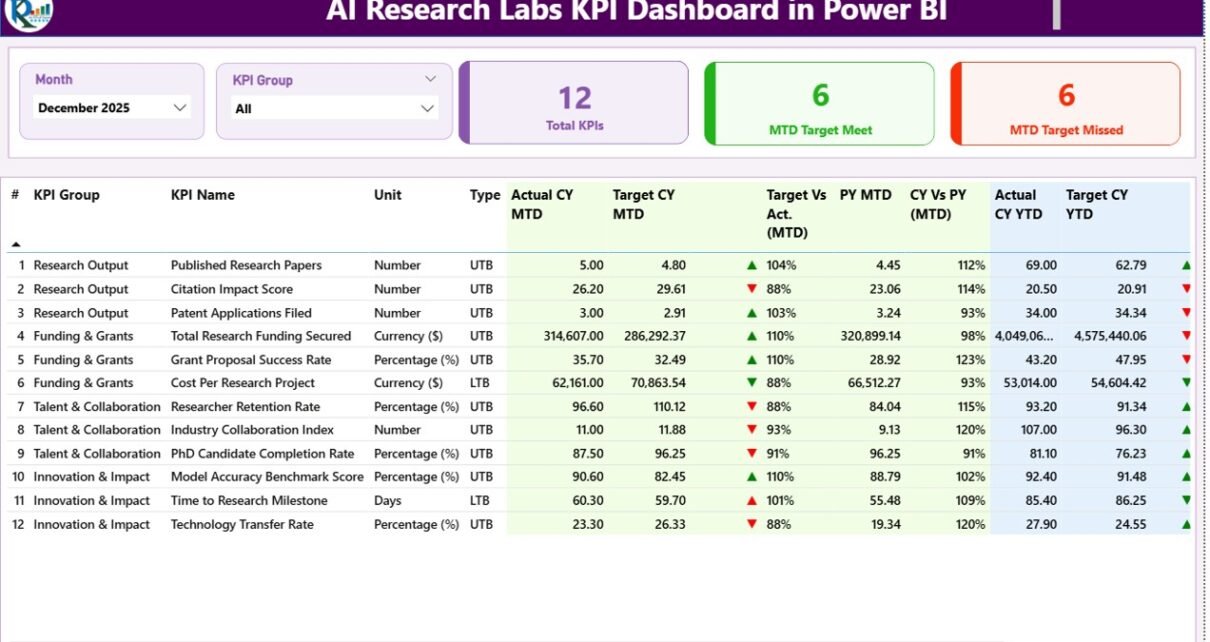
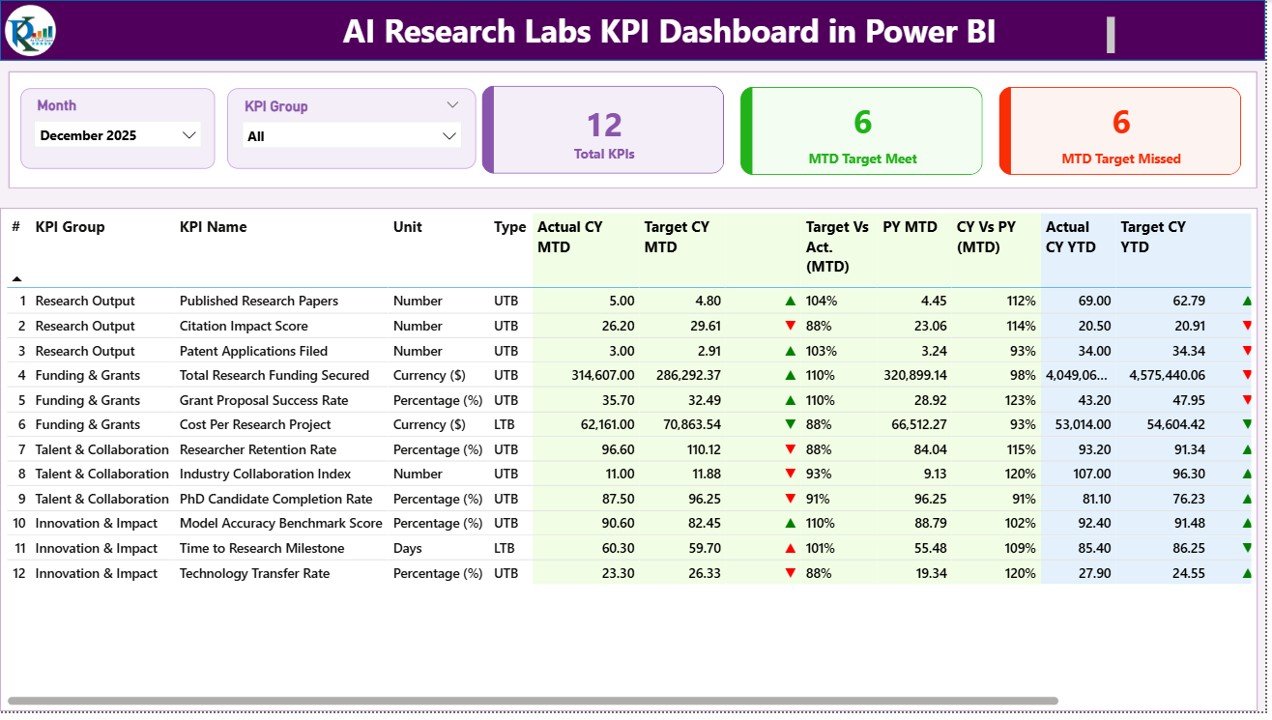
1. Summary Page
This is the main hub of the dashboard featuring:
- Month and KPI Group slicers at the top for filtering data effectively.
- Three key cards displaying Total KPIs count, MTD Target Meet count, and MTD Target Missed count.
- A detailed table showcasing granular KPI data with the following columns:
- KPI Number: Sequence identifier of the KPI.
- KPI Group: Category classification of the KPI.
- KPI Name: Descriptive name of the KPI.
- Unit: Measurement unit, e.g., percentage, count.
- Type: Indicator whether KPI is LTB (Lower The Better) or UTB (Upper The Better).
- Actual CY MTD: Actual value for the current year’s Month-To-Date.
- Target CY MTD: Target value for the current year’s Month-To-Date.
- MTD Icon: Color-coded up/down arrows indicating KPI performance against the MTD target.
- Target Vs Act. (MTD): Percentage ratio of actual to target for the month.
- PY MTD: Previous year’s Month-To-Date actual value.
- CY Vs PY (MTD): Percentage comparison of current year MTD to previous year MTD.
- Actual CY YTD: Actual value for the current year’s Year-To-Date.
- Target CY YTD: Target value for the current year’s Year-To-Date.
- YTD Icon: Performance status icon for YTD values.
- Target Vs Act. (YTD): Percentage ratio of actual to target for the year.
- PY YTD: Previous year’s Year-To-Date actual value.
- CY Vs PY (YTD): Percentage comparison of current year YTD to previous year YTD.
Click to Buy AI Research Labs KPI Dashboard in Power BI
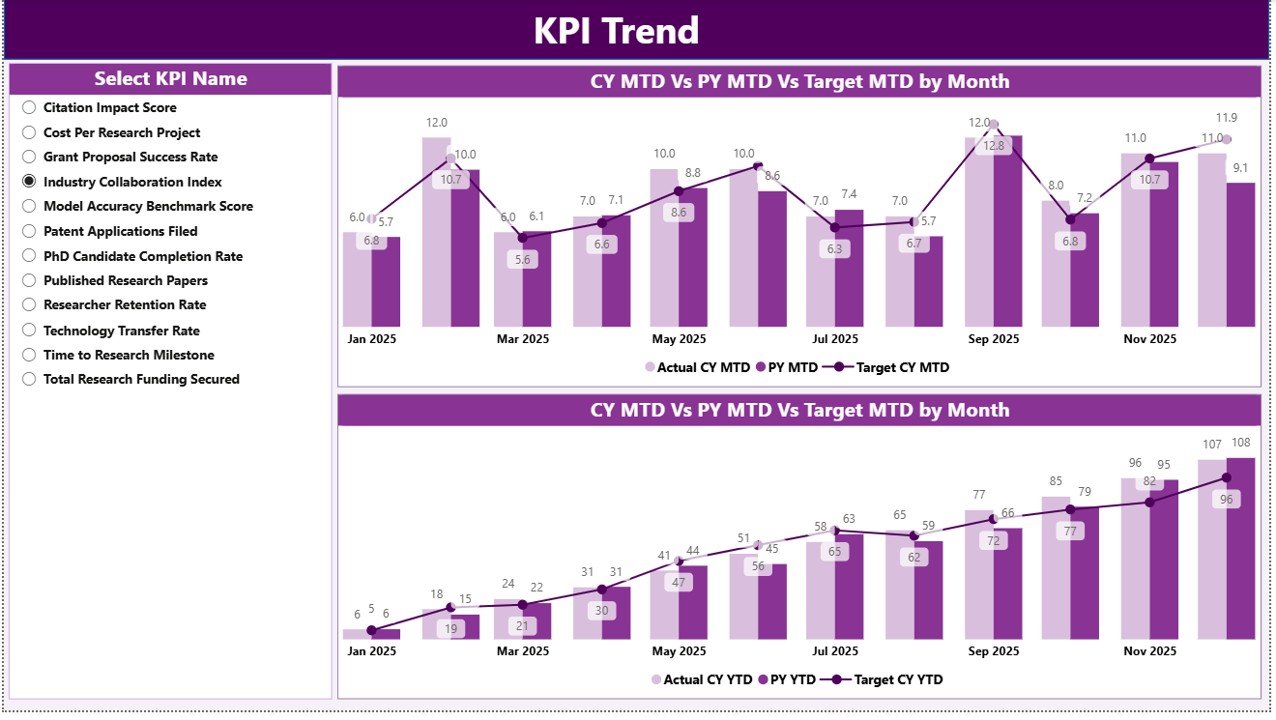
2. KPI Trend Page
This page visualizes KPI trends through two combo charts, depicting:
- Actual values for the Current Year, Previous Year, and Targets for both MTD and YTD.
- A KPI Name slicer on the left allowing for easy KPI selection and focused trend analysis.
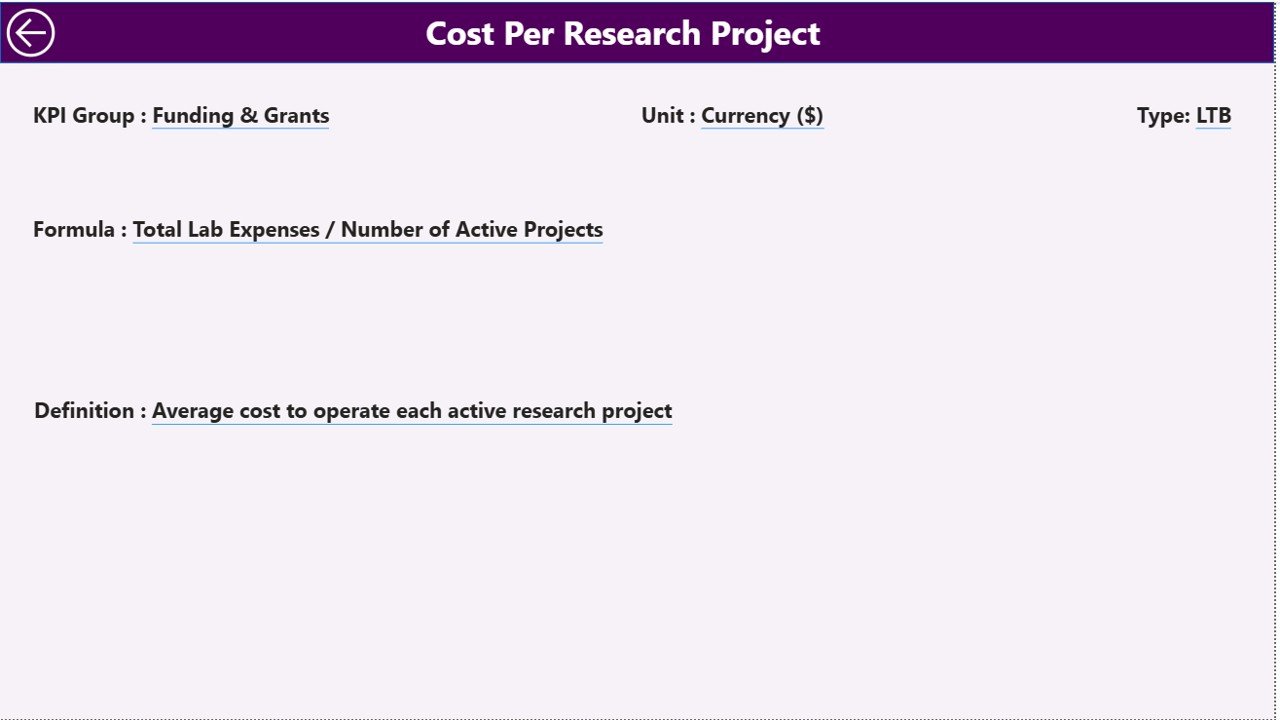
3. KPI Definition Page
This hidden drill-through page offers detailed insights into each KPI, including:
- KPI formula used for calculations.
- Detailed KPI definitions and measurement context.
- Guidance on KPI type and its interpretation.
Users can access this page by right-clicking a KPI on the summary page and selecting drill-through. To return, simply click the back button located at the top left.
Click to Buy AI Research Labs KPI Dashboard in Power BI
Excel Data Structure
The dashboard sources its data from an Excel workbook divided into three key sheets:
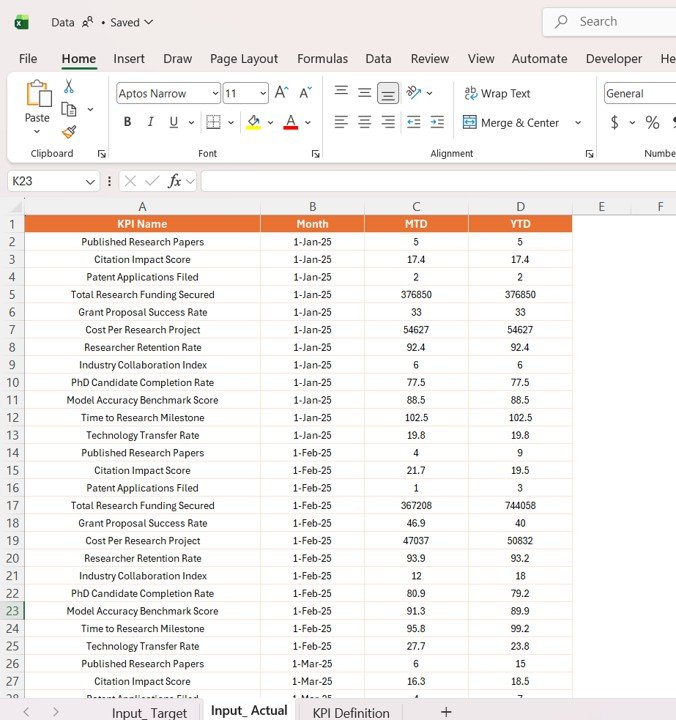
1. Input_Actual Sheet
This sheet captures the actual values for each KPI.
- Include KPI Name, Month (using the first date of the month), MTD Actual, and YTD Actual values.
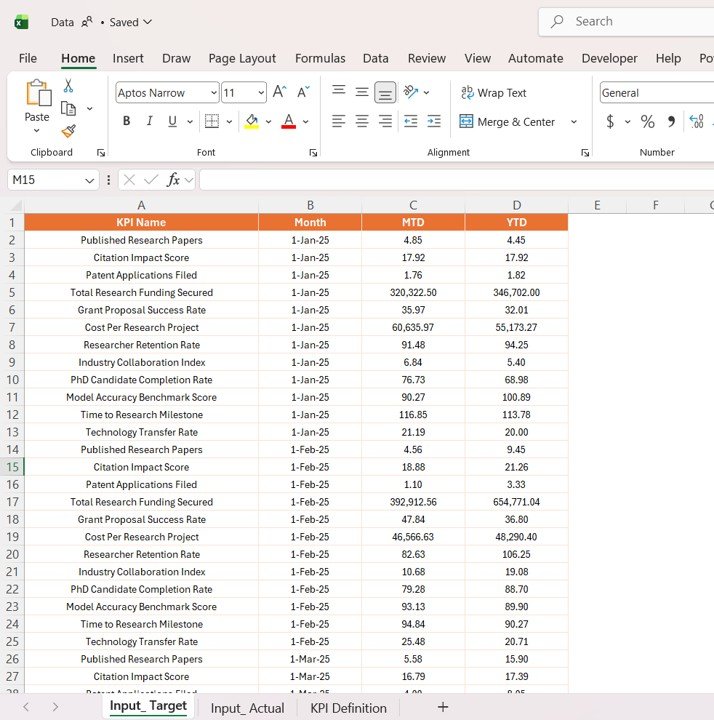
2. Input_Target Sheet
Click to Buy AI Research Labs KPI Dashboard in Power BI
This sheet records the target values corresponding to each KPI.
- Include KPI Name, Month (first date), MTD Target, and YTD Target values.
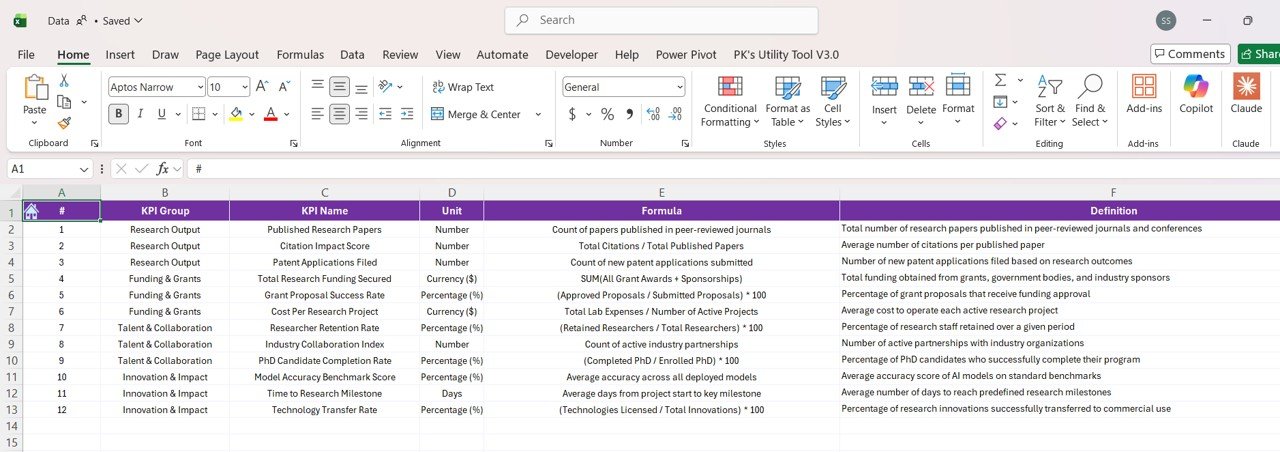
3. KPI Definition Sheet
Click to Buy AI Research Labs KPI Dashboard in Power BI
Details around each KPI are maintained here.
- KPI Number, Group, Name, Unit, Formula, Definition, and Type (LTB or UTB).
Advantages of AI Research Labs KPI Dashboard in Power BI
- Data Consolidation: Seamlessly integrates multiple KPIs into a single dashboard.
- Real-Time Insights: Enables quick monitoring of progress against targets.
- Visual Clarity: Color-coded indicators simplify performance assessment.
- Trend Analysis: Facilitates understanding of KPI evolution over time.
- User-Friendly Interface: Easily navigable with intuitive slicers and drill-through options.
- Excel Integration: Simplifies data input and updating process.
Opportunities for Improvement
Click to Buy AI Research Labs KPI Dashboard in Power BI
- Enhance mobile responsiveness for better accessibility on various devices.
- Implement automated data refresh for real-time updates without manual intervention.
- Expand KPI categories to include predictive analytics for forecasting.
- Integrate additional visualization types such as heat maps or gauge charts.
- Introduce user-specific views, enabling personalized KPI tracking.
Best Practices
- Consistently update the Excel data sheets to maintain dashboard accuracy.
- Use clear and meaningful KPI names and definitions to avoid confusion.
- Leverage slicers to drill down into specific months or KPI groups for focused analysis.
- Regularly review the KPI threshold criteria for LTB and UTB to ensure relevance.
- Train team members on how to interpret dashboard visual cues for faster decision-making.
FAQs
Click to Buy AI Research Labs KPI Dashboard in Power BI
How often should I update the Excel file?
It is recommended to update the Excel data monthly or as often as new KPI data becomes available to keep the dashboard current.
Can I add more KPIs to the dashboard?
Yes, you can add new KPIs by updating the KPI Definition sheet and including corresponding data in the Input_Actual and Input_Target sheets.
Is it possible to customize the dashboard visuals?
Absolutely. Power BI allows customization of visuals, including colors, chart types, and layout, to suit your preferences.
What do LTB and UTB signify in KPI types?
LTB (Lower The Better) means that lower KPI values indicate better performance, whereas UTB (Upper The Better) implies higher KPI values are desired.
How do I access the KPI Definition page?
You can access it via drill-through from the Summary page by right-clicking on a KPI and selecting the drill-through option.
Conclusion
The AI Research Labs KPI Dashboard in Power BI offers a robust framework for monitoring, analyzing, and improving key metrics in research environments. By combining Excel data integration with intuitive Power BI visuals, it streamlines performance tracking and supports data-informed decision-making. With continuous enhancements and proper data management, this dashboard can become an indispensable asset for AI research teams.
For more detailed insights and a hands-on demonstration, visit the official Power BI site.
Visit our YouTube channel to watch the demo.
Click to Buy AI Research Labs KPI Dashboard in Power BI