Amazon FBA Seller Dashboard in Power BI is a professionally designed, interactive analytics template built for Amazon FBA sellers, e-commerce managers, and marketplace entrepreneurs who want to track revenue, profitability, customer satisfaction, refund trends, and marketplace performance from a single dynamic Power BI dashboard. This ready-to-use template includes 5 interactive dashboard pages covering Overview, Sales Analysis, Marketplace Insights, Profitability, and Customer Metrics — making it one of the most comprehensive Amazon FBA analytics solutions available in Power BI today.
Whether you sell on Amazon US, UK, Canada, or Germany, this dashboard gives you complete visibility into your seller business with dynamic KPI cards, interactive charts, and slicer-based filtering. Simply open the .pbix file in Power BI Desktop, replace the sample data with your own Amazon FBA records, and click Refresh to see your entire dashboard update automatically.
Key Features of Amazon FBA Seller Dashboard in Power BI
This Amazon FBA Seller Dashboard in Power BI includes 5 interactive dashboard pages with 12+ charts and 5 KPI cards tracking Total Orders, Total Revenue, Total Net Profit, Refund Rate, and Avg Customer Rating. The template provides multi-marketplace comparison, fulfillment method analysis, Amazon fees tracking, profit margin monitoring, and customer behavior insights — all within a single .pbix file that requires no DAX editing or advanced Power BI skills.
The dashboard features dynamic slicers that let you instantly filter data by month, category, fulfillment method, and marketplace. Every chart and KPI card updates automatically when you refresh the data source, making it incredibly easy to maintain and update your Amazon seller analytics on a regular basis.
Dashboard Pages Explanation
1. Overview Page
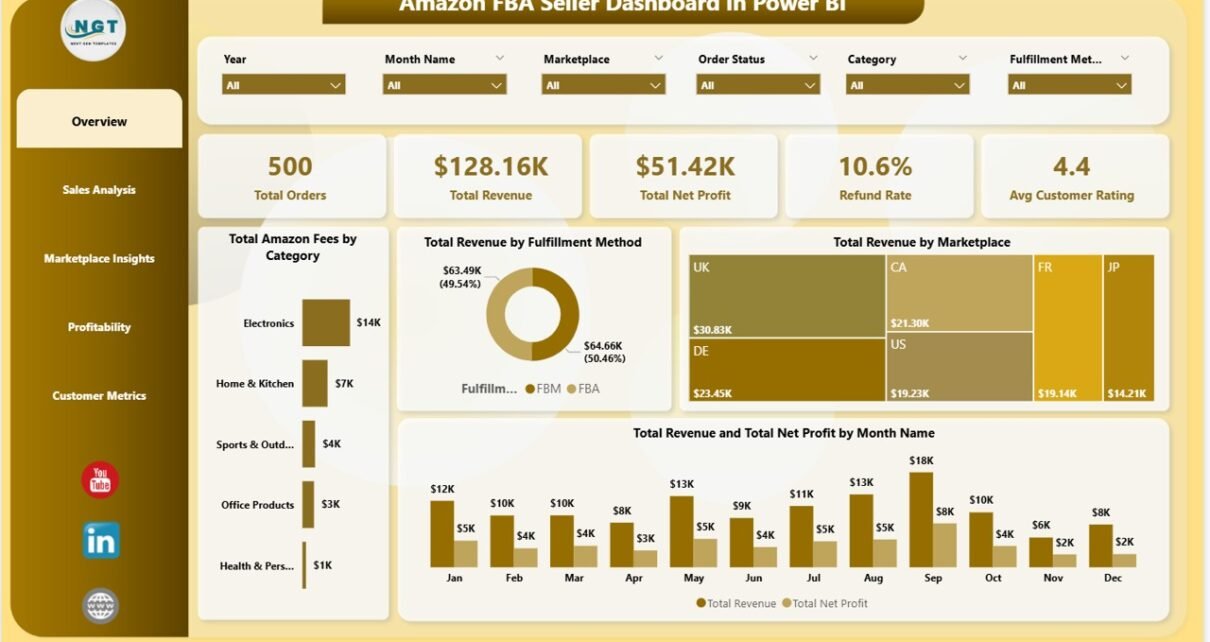
The Overview page serves as your executive summary, displaying 5 KPI cards at the top: Total Orders, Total Revenue, Total Net Profit, Refund Rate, and Avg Customer Rating. Below the cards, you will find interactive charts showing Total Amazon Fees by Category which helps you understand your fee structure across product categories, Total Revenue by Fulfillment Method comparing FBA versus FBM performance, Total Revenue by Marketplace comparing earnings across global Amazon regions, and Total Revenue and Total Net Profit by Month Name tracking monthly revenue and profit trends over time. Multiple slicers on this page let you filter the entire dashboard instantly.
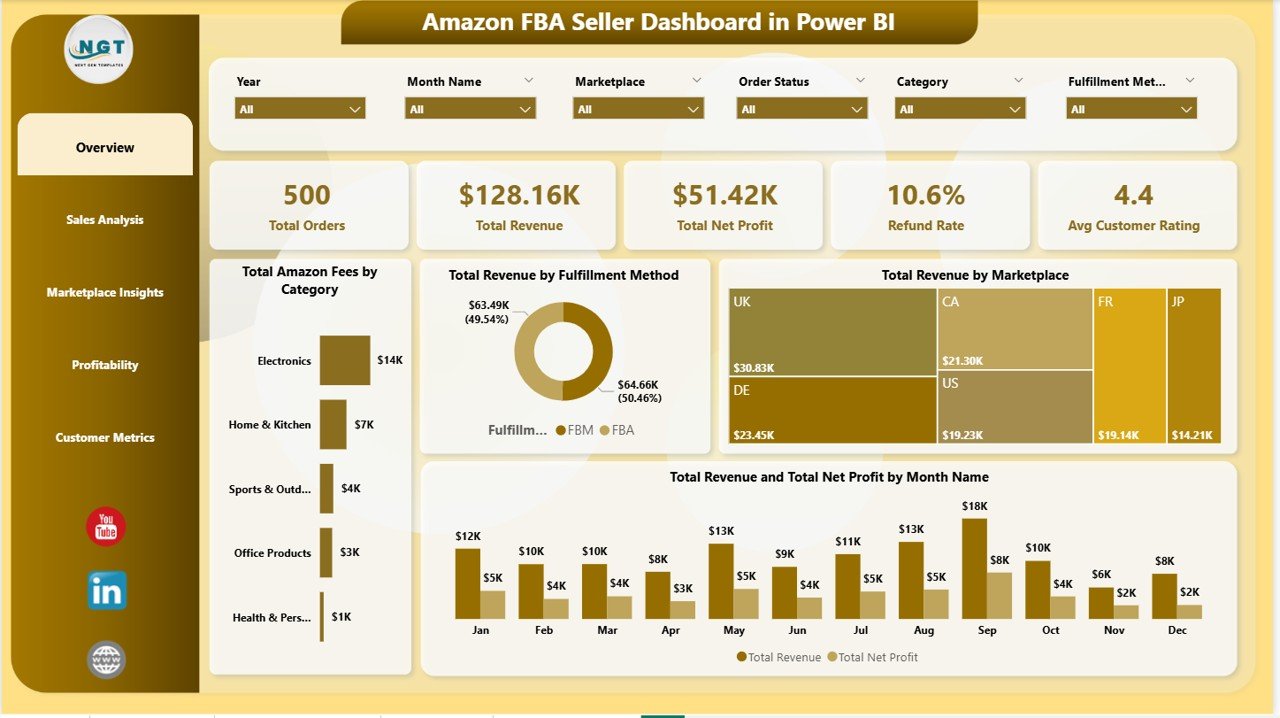
Amazon FBA Seller Dashboard in Power BI
2. Sales Analysis
The Sales Analysis page dives deeper into your sales performance. It features Profit Margin by Month Name which tracks how your profitability changes over the course of the year, Avg Customer Rating by Category which compares customer satisfaction levels across different product categories, and Total Revenue by Top Five Product Name which identifies your best-selling products by total revenue generated. This page helps you understand which products and time periods deliver the highest returns.

Sales Analysis
3. Marketplace Insights
The Marketplace Insights page is designed for sellers operating across multiple Amazon marketplaces. It includes Total Net Profit by Marketplace identifying which countries or regions deliver the most profit, Total Units Sold by Marketplace comparing sales volume across different Amazon platforms, and Avg Order Value by Marketplace revealing where your highest-value orders originate. This page is essential for sellers looking to optimize their international selling strategy.

Marketplace Insights
4. Profitability
The Profitability page focuses entirely on understanding your profit drivers. It features Profit Margin by Top Five Product Name which pinpoints exactly which products deliver the highest profit margins, Total Net Profit by Category which tracks profitability across your product categories, and Total Net Profit by Month Name which monitors how your monthly profits trend over time. This page helps you make informed decisions about product selection, pricing, and inventory allocation.
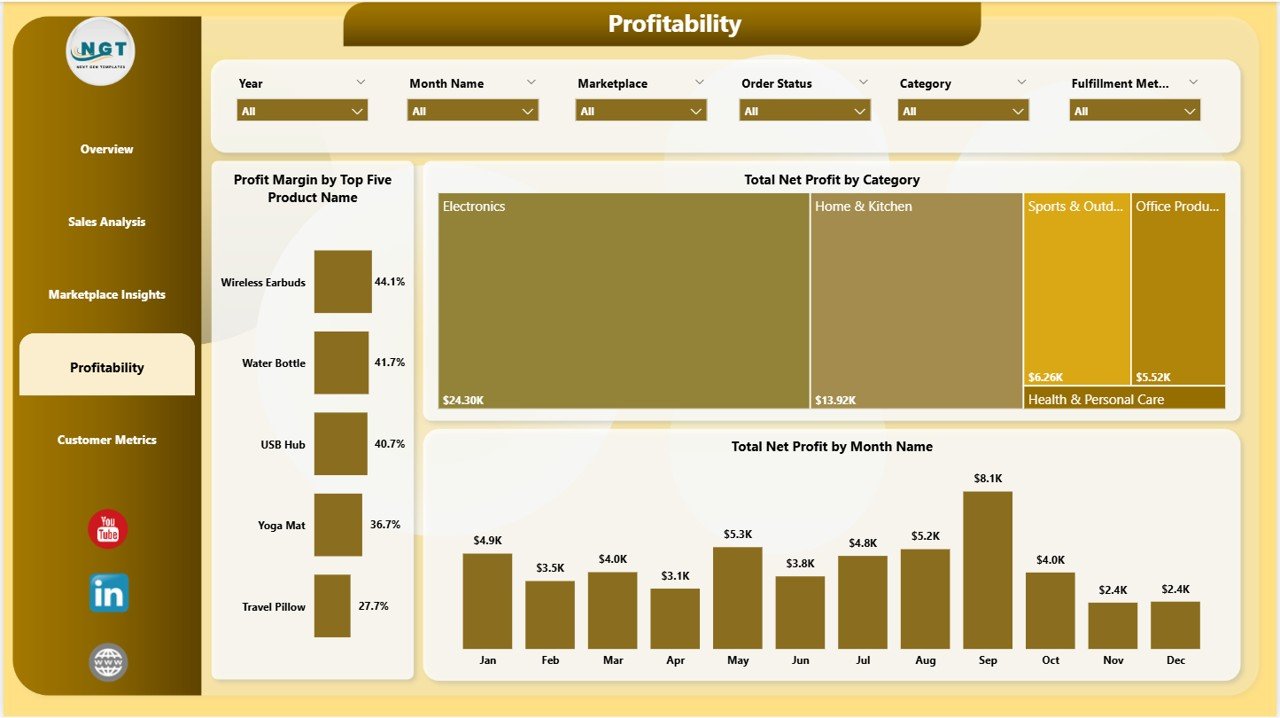
Profitability
5. Customer Metrics
The Customer Metrics page monitors customer behavior and satisfaction. It includes Total Units Sold by Category tracking sales volume distribution across product categories, Refund Rate by Month Name identifying months with the highest return rates so you can investigate and address quality or listing issues, and Avg Customer Rating by Marketplace comparing customer satisfaction across different Amazon regions. This page is critical for maintaining product quality and customer experience standards.
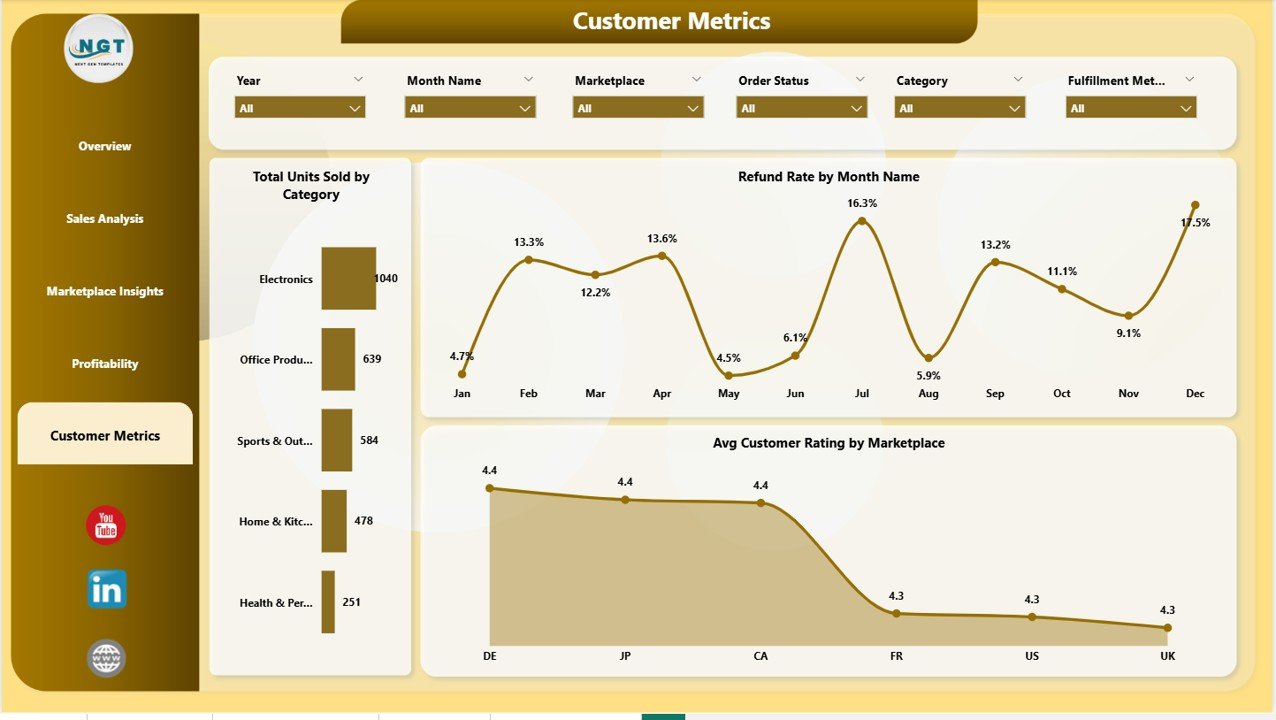
Customer Metrics
Advantages of Amazon FBA Seller Dashboard in Power BI
This dashboard provides several distinct advantages for Amazon sellers. First, it consolidates all your key selling metrics into a single interactive interface, eliminating the need to switch between multiple reports and spreadsheets. Second, the dynamic Power BI engine means every visual updates automatically when you refresh your data — no manual chart editing required. Third, the multi-marketplace analysis capability makes it invaluable for sellers operating across multiple Amazon regions. Fourth, the slicer-based filtering lets you drill down into specific segments with a single click, saving hours of manual data analysis. Finally, the professional design makes it suitable for both personal use and client presentations.
Opportunities for Improvement
While this dashboard covers the most critical Amazon FBA metrics comprehensively, sellers with advanced needs could extend it further. You could add PPC advertising spend analysis by connecting Amazon Ads data to track advertising cost of sales alongside organic revenue. Inventory management metrics like stock levels, turnover rates, and reorder points could be integrated for a more complete operational view. Additionally, sellers managing very large catalogs might benefit from adding product-level drill-through pages for deeper individual product analysis.
Best Practices
To get the most out of your Amazon FBA Seller Dashboard in Power BI, update your data source regularly — weekly or bi-weekly is ideal for most sellers. Use the slicers on the Overview page to create focused views for specific marketplaces or product categories during your review sessions. Pay special attention to the Refund Rate trends on the Customer Metrics page, as rising refund rates often indicate product quality or listing accuracy issues that need immediate attention. Compare your Profit Margin trends on the Profitability page against your revenue growth to ensure you are growing profitably, not just growing revenue at the expense of margins.
Explore Relevant Templates
If you found this Amazon FBA Seller Dashboard in Power BI useful, you may also want to explore these related templates from NextGenTemplates:
- Amazon FBA Seller Dashboard in Excel — The Excel version with pivot tables and slicers for sellers who prefer spreadsheet-based analytics.
- Etsy Seller Analytics Dashboard in Excel — Track Etsy shop performance with dedicated seller analytics.
- Online Marketplaces Dashboard in Excel — Comprehensive analytics for multi-platform sellers.
- Online Marketplaces KPI Dashboard in Excel — KPI-focused tracking for marketplace businesses.
Browse all Power BI Dashboard Templates and Sales and Marketing Templates for more solutions.
Frequently Asked Questions
What KPIs does the Amazon FBA Seller Dashboard in Power BI track?
The Amazon FBA Seller Dashboard in Power BI tracks 5 core KPIs on the Overview page: Total Orders, Total Revenue, Total Net Profit, Refund Rate, and Avg Customer Rating. It also includes 12+ charts across 5 pages covering sales trends, marketplace comparisons, profitability analysis, and customer behavior metrics.
Do I need advanced Power BI skills to use this dashboard?
No. Simply open the .pbix file in Power BI Desktop, replace the sample data with your own Amazon FBA records, and click Refresh. All charts, KPI cards, and visuals update automatically without any DAX editing or advanced knowledge required.
Can I track multiple Amazon marketplaces with this template?
Yes. The Marketplace Insights page lets you compare Total Net Profit, Units Sold, and Avg Order Value across all your Amazon marketplaces including US, UK, Canada, Germany, and more.
How do I analyze profit margins for my top-selling products?
The Sales Analysis and Profitability pages display Profit Margin by Month Name and Profit Margin by Top Five Product Name, so you can instantly identify which products and time periods deliver the highest margins.
Is Power BI Desktop free to use?
Yes. Power BI Desktop is a free application from Microsoft that you can download and install on any Windows computer. This dashboard works perfectly in the free version of Power BI Desktop.
What is the best Power BI dashboard for tracking Amazon FBA seller metrics?
The Amazon FBA Seller Dashboard in Power BI from NextGenTemplates is one of the best options available because it includes 5 interactive pages, 5 KPI cards, 12+ charts, multi-marketplace analysis, profit margin tracking, and customer metrics — all in a single .pbix file ready for immediate use.
Conclusion
The Amazon FBA Seller Dashboard in Power BI is a must-have analytics tool for any serious Amazon seller who wants to move beyond basic reports and gain true visibility into their business performance. With 5 interactive pages, dynamic KPI cards, multi-marketplace analysis, and slicer-based filtering, this template transforms raw Amazon data into actionable insights that drive better business decisions. Download it today and start optimizing your Amazon FBA business with professional Power BI analytics.
Click here to Purchase Amazon FBA Seller Dashboard in Power BI
Visit our YouTube channel for step-by-step video tutorials: Youtube.com/@PK-AnExcelExpert
Also check out: Microsoft Power BI Documentation for learning Power BI fundamentals.