Financial institutions face increasing pressure to detect and prevent money laundering activities. Banks, fintech companies, and financial service providers must monitor transactions continuously. However, many organizations still rely on scattered spreadsheets and manual reviews. As a result, compliance teams struggle to identify suspicious activities quickly.
Therefore, organizations now adopt data-driven AML dashboards. One of the most effective solutions is the Anti-Money Laundering (AML) Dashboard in Excel.
In this detailed guide, you will learn everything about this dashboard, including its features, benefits, structure, and best practices. Moreover, you will understand how it helps compliance teams improve monitoring and reduce risk.
Click to Purchases Anti-Money Laundering (AML) Dashboard in Excel
What is an Anti-Money Laundering (AML) Dashboard in Excel?
An AML Dashboard in Excel is an interactive reporting tool designed to track suspicious financial activities, monitor alerts, and measure compliance performance.
It collects data from transaction systems and presents it in a visual format. As a result, compliance officers can quickly identify risks, track alerts, and take action.
With this dashboard, organizations can:
-
Monitor suspicious transactions
-
Track alerts and investigations
-
Measure compliance performance
-
Analyze risk levels
-
Improve regulatory reporting
Because Excel is widely used, this dashboard offers flexibility and ease of use.
Why Do Organizations Need an AML Dashboard?
Financial crimes continue to grow. Therefore, organizations must stay alert.
However, without a proper system:
-
Alerts become difficult to track
-
Investigations get delayed
-
Risk visibility becomes limited
-
Compliance reporting takes too long
As a result, organizations face regulatory penalties.
Key Reasons to Use an AML Dashboard
-
It centralizes all compliance data
-
It improves risk visibility
-
It speeds up investigations
-
It enhances reporting accuracy
-
It supports better decision-making
Therefore, an AML dashboard becomes a critical tool for compliance teams.
Key Features of the Anti-Money Laundering (AML) Dashboard in Excel
This ready-to-use dashboard includes 5 interactive pages. Each page focuses on a specific analysis area.
1. Overview Page – Complete AML Snapshot
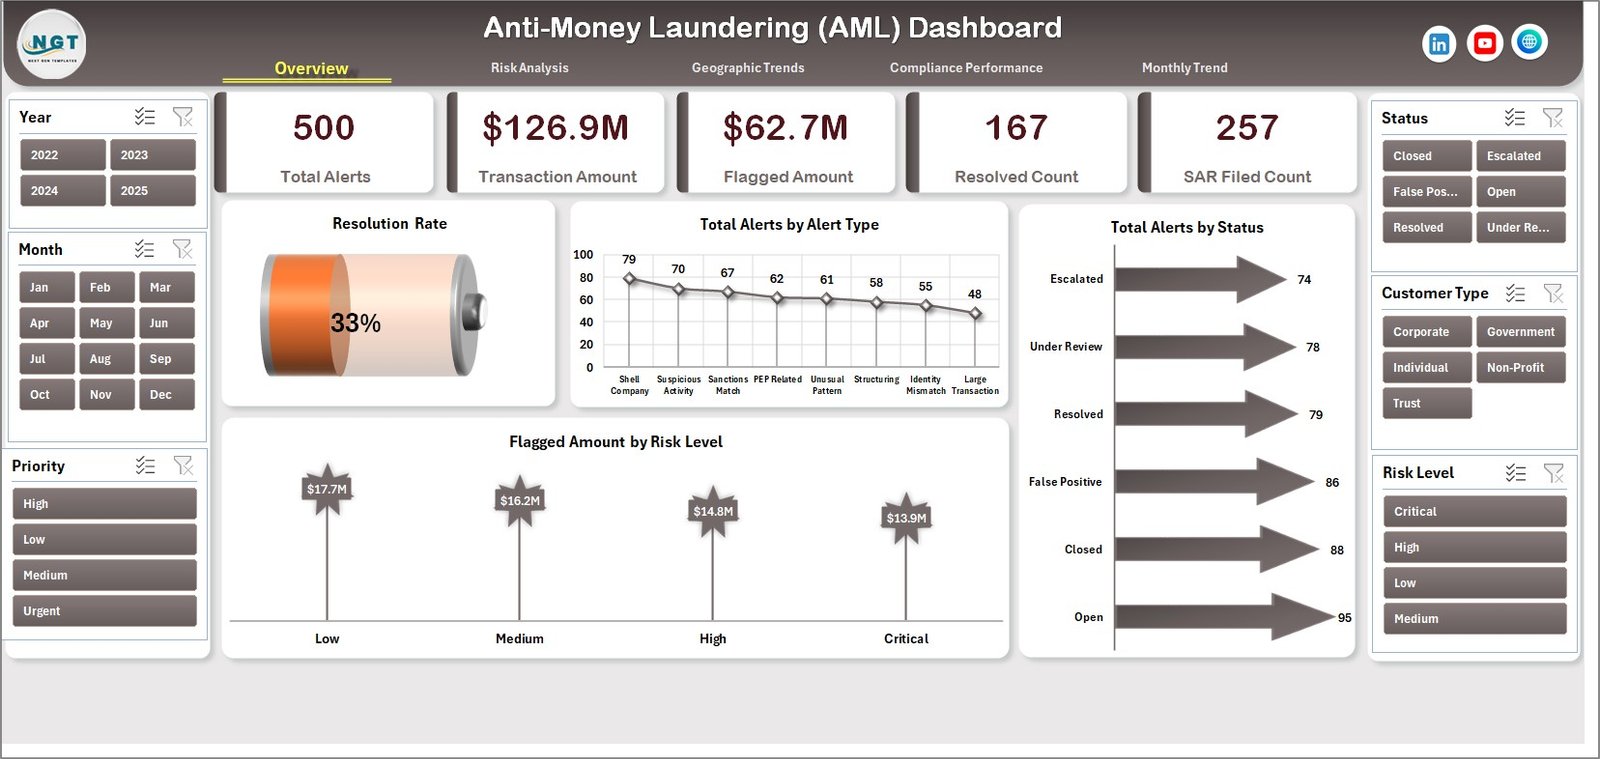
The Overview Page provides a high-level summary of AML activities.
Key KPI Cards:
-
🚨 Total Alerts
-
💰 Transaction Amount
-
⚠️ Flagged Amount
-
✅ Resolved Count
-
📄 SAR Filed Count
Charts Included:
-
📊 Resolution Rate
-
📊 Total Alerts by Alert Type
-
📊 Total Alerts by Status
-
📊 Flagged Amount by Risk Level
Because of this layout, users can quickly understand the overall compliance situation.
2. Risk Analysis – Identify High-Risk Areas
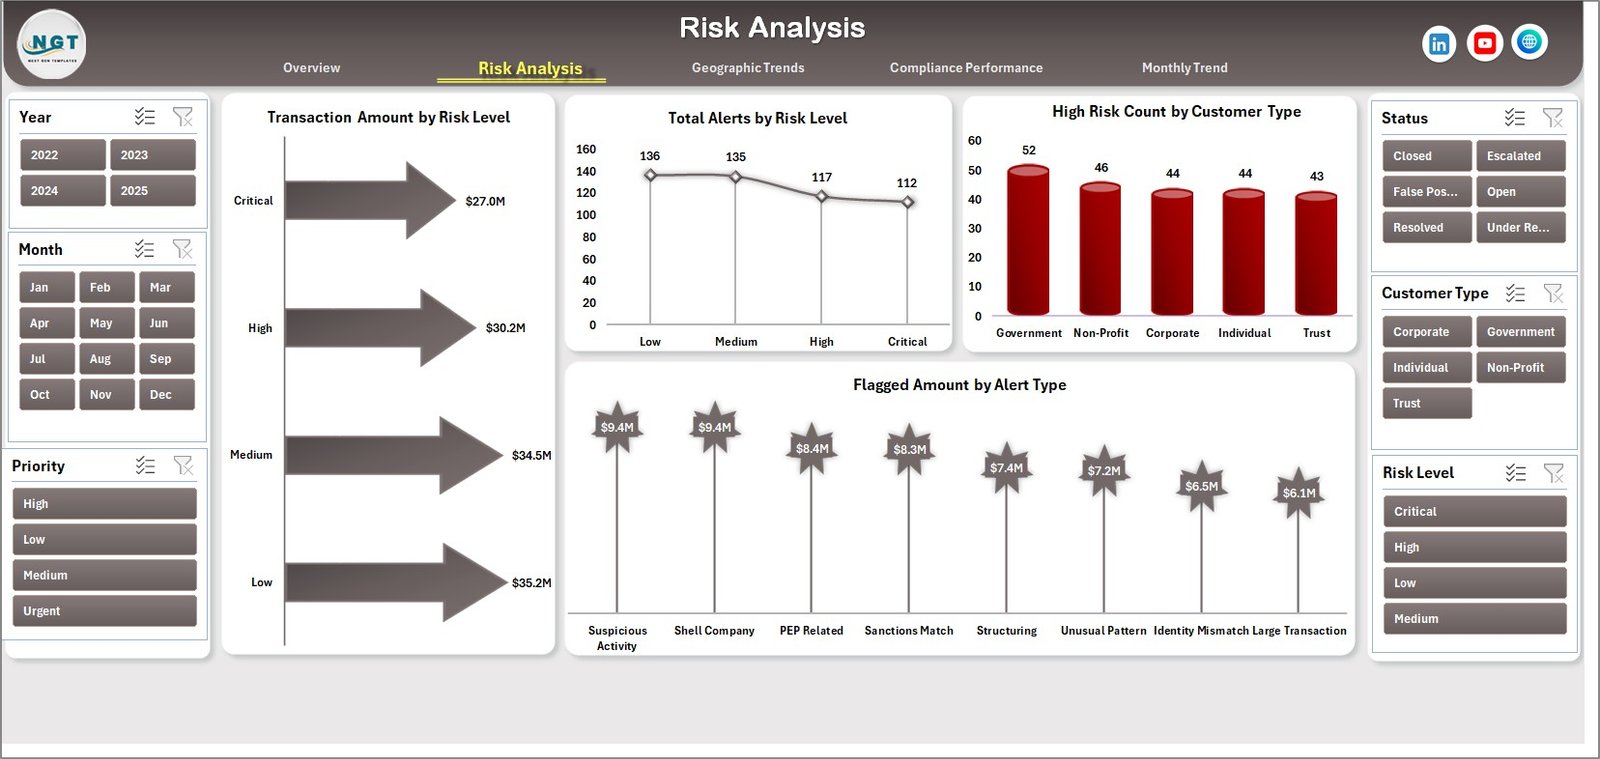
The Risk Analysis Page helps identify risk exposure.
Charts Included:
-
📊 Transaction Amount by Risk Level
-
📊 Total Alerts by Risk Level
-
📊 High Risk Count by Customer Type
-
📊 Flagged Amount by Alert Type
With this analysis, compliance teams can focus on high-risk customers and transactions.
3. Geographic Trends – Regional Risk Insights
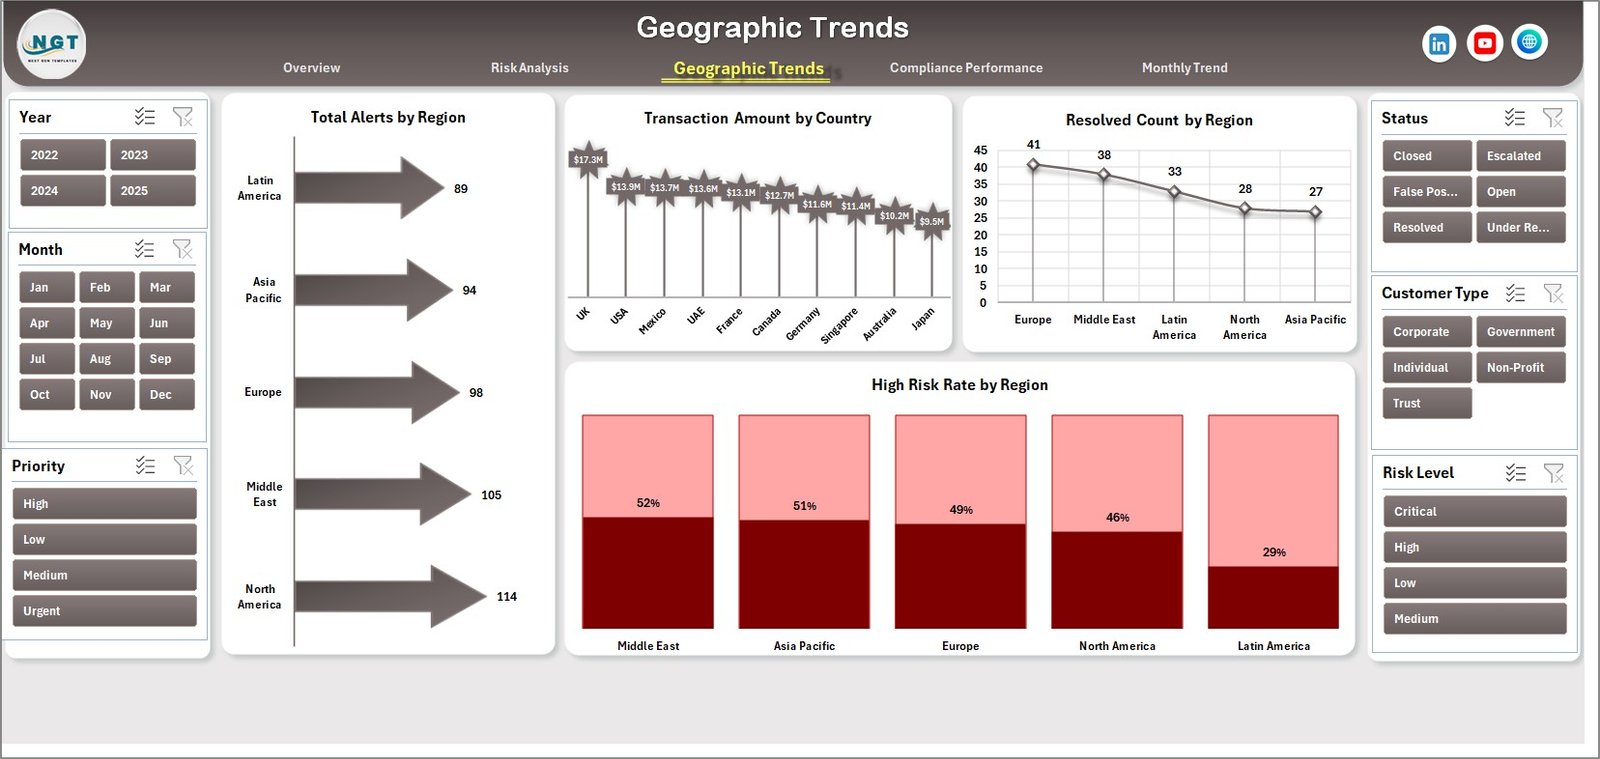
The Geographic Trends Page provides location-based analysis.
Charts Included:
-
🌍 Total Alerts by Region
-
🌍 Transaction Amount by Country
-
🌍 Resolved Count by Region
-
🌍 High Risk Rate by Region
Because financial crimes vary by region, this page helps identify geographic risk patterns.
4. Compliance Performance – Monitor Team Efficiency
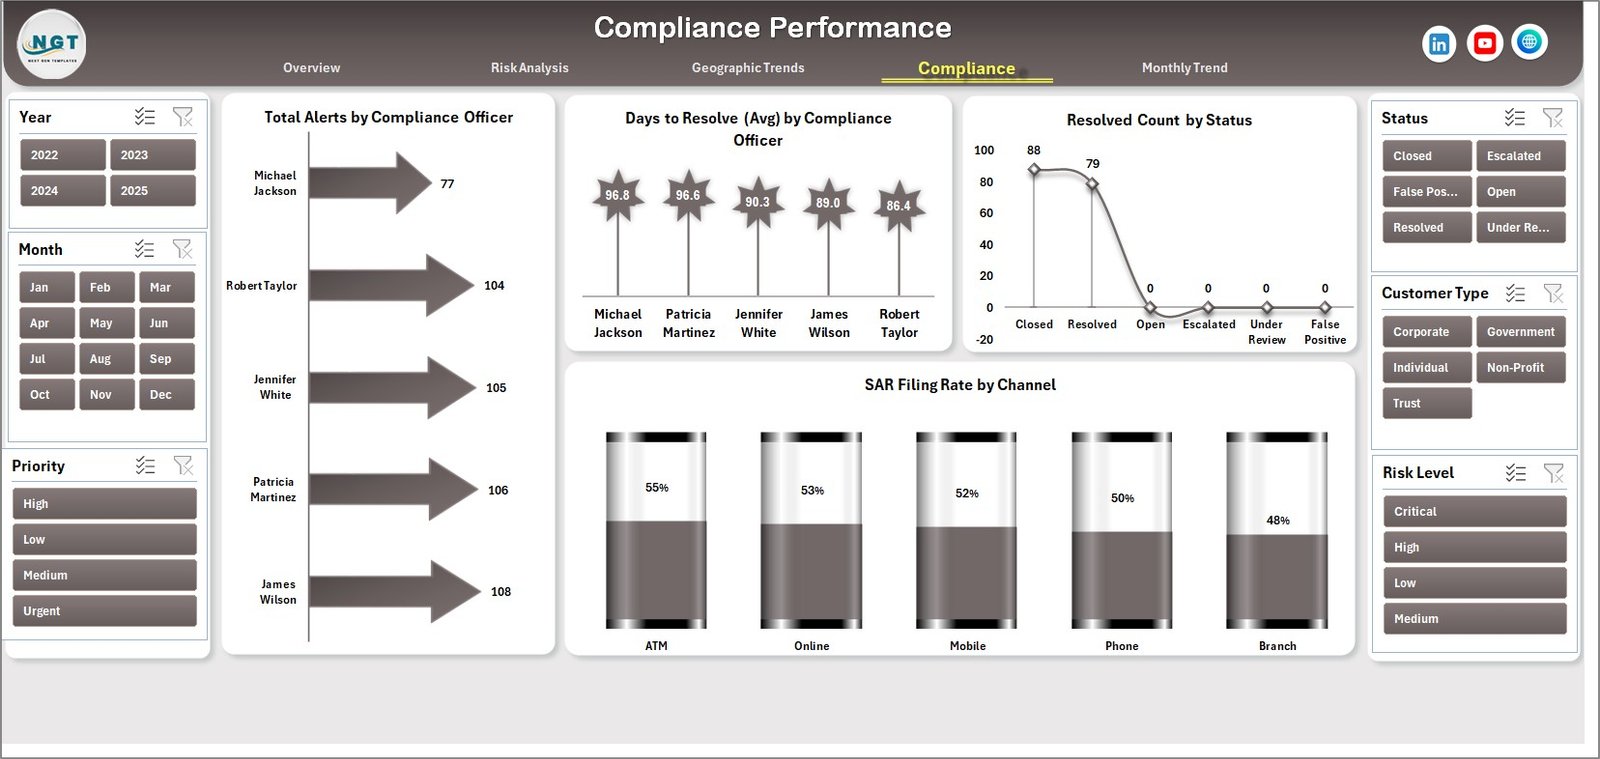
The Compliance Performance Page focuses on team productivity.
Charts Included:
-
📊 Total Alerts by Compliance Officer
-
📊 Average Days to Resolve by Officer
-
📊 Resolved Count by Status
-
📊 SAR Filing Rate by Channel
This page helps managers evaluate team performance and improve efficiency.
5. Monthly Trends – Track Performance Over Time
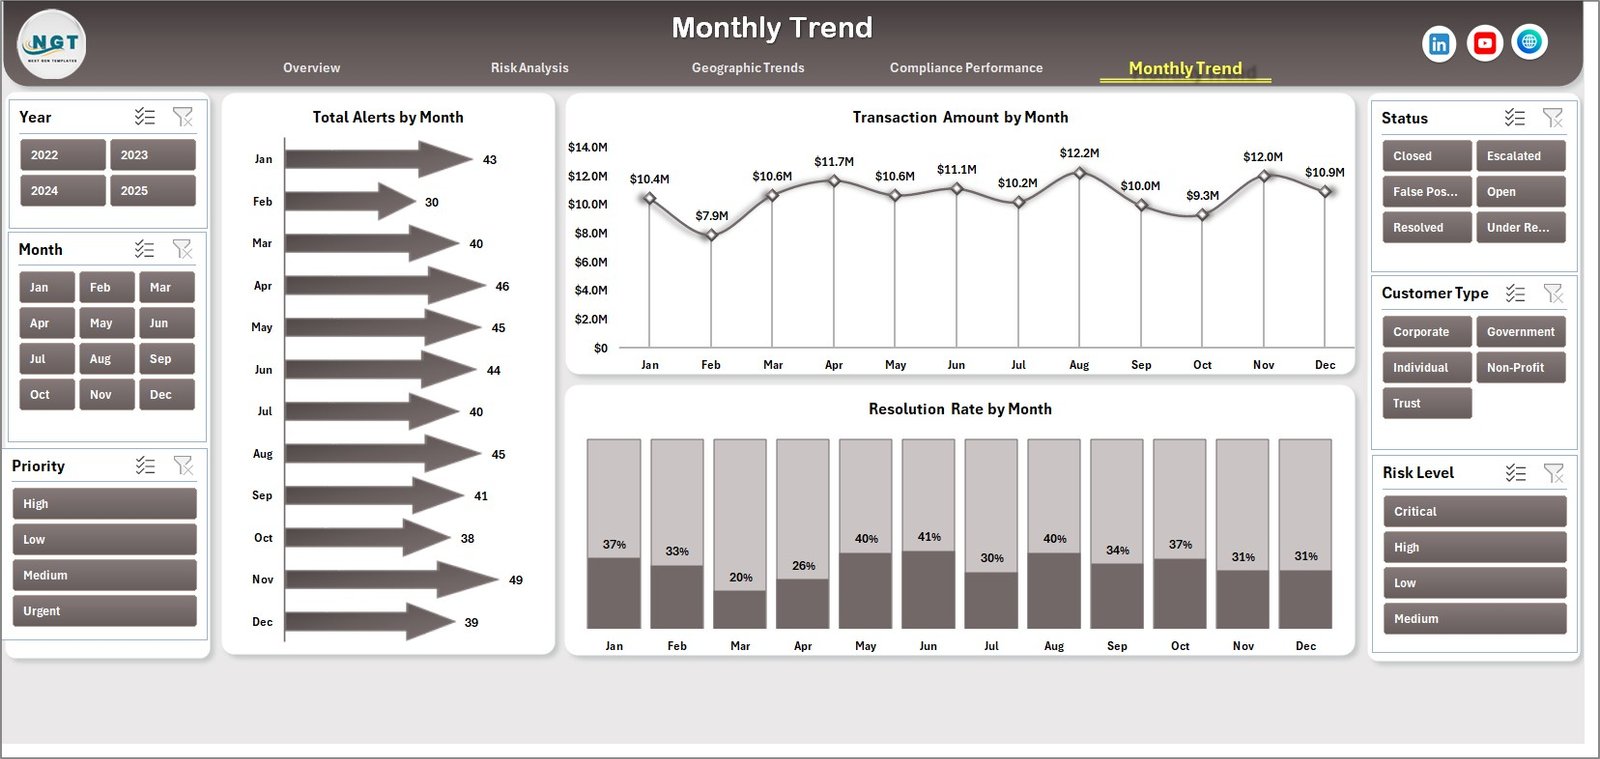
The Monthly Trends Page shows time-based analysis.
Charts Included:
-
📅 Total Alerts by Month
-
📅 Transaction Amount by Month
-
📅 Resolution Rate by Month
Because trends matter, this page helps identify patterns and seasonal risks.
Click to Purchases Anti-Money Laundering (AML) Dashboard in Excel
Advantages of Anti-Money Laundering (AML) Dashboard in Excel
Using this dashboard provides several benefits.
🚀 Improved Risk Visibility
-
Identify suspicious activities quickly
-
Monitor high-risk transactions
-
Detect patterns easily
📊 Better Decision Making
-
Use data-driven insights
-
Prioritize investigations
-
Allocate resources effectively
⏱ Time Saving
-
Reduce manual reporting
-
Automate calculations
-
Speed up analysis
🔍 Enhanced Compliance
-
Track regulatory requirements
-
Improve reporting accuracy
-
Avoid penalties
📈 Performance Monitoring
-
Measure team productivity
-
Track resolution rates
-
Monitor SAR filings
Best Practices for the Anti-Money Laundering (AML) Dashboard in Excel
To get the best results, follow these best practices.
✅ Maintain Accurate Data
-
Use clean and structured data
-
Avoid duplicates
-
Validate transaction records
📅 Update Data Regularly
-
Update alerts and transactions daily
-
Keep records current
🎯 Focus on High-Risk Areas
-
Prioritize high-risk alerts
-
Monitor flagged transactions closely
📊 Use Filters Effectively
-
Apply slicers for better analysis
-
Focus on specific regions or risk levels
🔄 Monitor Trends Continuously
-
Track monthly performance
-
Identify unusual patterns
🧠 Train Compliance Teams
-
Ensure proper dashboard usage
-
Provide AML training
Common AML KPIs Tracked in the Dashboard
To ensure effectiveness, organizations track key AML metrics.
Important KPIs Include:
-
Total Alerts
-
Flagged Transactions
-
Resolution Rate
-
SAR Filed Count
-
Average Investigation Time
-
High-Risk Customer Count
-
Transaction Monitoring Volume
Because these KPIs provide clear insights, they help organizations stay compliant.
How to Use the AML Dashboard Effectively?
Using the dashboard correctly improves results.
Step-by-Step Process:
-
Enter data into Excel sheets
-
Refresh the dashboard
-
Use slicers to filter data
-
Analyze KPI cards
-
Review charts for insights
-
Identify high-risk alerts
-
Take corrective actions
By following these steps, teams can improve compliance efficiency.
Challenges Without an AML Dashboard
Without a dashboard, organizations face serious issues.
Common Problems:
-
Delayed investigations
-
Increased compliance risk
-
Lack of data visibility
-
Inefficient reporting
Therefore, using an AML dashboard becomes essential.
Future of AML Dashboards
AML technology continues to evolve.
Future Trends:
-
AI-based fraud detection
-
Real-time monitoring systems
-
Predictive analytics
-
Cloud-based dashboards
As a result, dashboards will become smarter and more powerful.
Conclusion
The Anti-Money Laundering (AML) Dashboard in Excel provides a powerful and practical solution for monitoring financial risks and ensuring compliance.
Because it combines data visualization with real-time insights, it helps organizations detect suspicious activities, improve efficiency, and reduce regulatory risks.
If you want to strengthen your compliance framework, this dashboard is an excellent choice.
Click to Purchases Anti-Money Laundering (AML) Dashboard in Excel
Frequently Asked Questions (FAQs)
1. What is an AML dashboard?
An AML dashboard is a tool used to monitor suspicious transactions, alerts, and compliance performance.
2. Why is AML important?
AML helps prevent financial crimes such as money laundering and fraud. Therefore, it protects organizations from legal risks.
3. What is SAR in AML?
SAR stands for Suspicious Activity Report. It is filed when suspicious transactions are detected.
4. Can Excel handle AML dashboards effectively?
Yes, Excel can manage AML dashboards with proper structure and automation.
5. How often should AML data be updated?
Ideally, data should be updated daily or weekly for accurate monitoring.
6. What industries use AML dashboards?
-
Banks
-
Financial institutions
-
Fintech companies
-
Insurance firms
7. What is a high-risk transaction?
A high-risk transaction involves suspicious patterns or unusual behavior that may indicate fraud.
8. Can this dashboard be customized?
Yes, you can customize KPIs, charts, and data sources based on your needs.
Click to Purchases Anti-Money Laundering (AML) Dashboard in Excel
Visit our YouTube channel to learn step-by-step video tutorials