Aquaculture plays a crucial role in the global food supply chain. As seafood demand continues to grow, aquaculture farms must manage production, monitor environmental health, control costs, and track revenue efficiently. However, many aquaculture businesses still rely on scattered spreadsheets and manual reports. As a result, managers often struggle to analyze farm performance and make timely decisions.
Therefore, modern aquaculture businesses increasingly use data-driven dashboards to centralize information and gain real-time insights. One powerful analytical solution is the Aquaculture Dashboard in Power BI.
Click to Purchases Aquaculture Dashboard in Power BI
The Aquaculture Dashboard in Power BI helps aquaculture businesses track farm production, monitor revenue, evaluate farming methods, analyze species performance, and observe environmental conditions through interactive visuals. Moreover, it converts raw operational data into meaningful insights that support faster and smarter decision-making.
In this article, you will learn everything about the Aquaculture Dashboard in Power BI, including its features, dashboard structure, advantages, best practices, and frequently asked questions.
What Is an Aquaculture Dashboard in Power BI?
An Aquaculture Dashboard in Power BI is an interactive business intelligence report created using Microsoft Power BI. It allows aquaculture businesses to visualize and analyze operational and financial data related to fish farming, shrimp farming, and other aquatic production systems.
Instead of reviewing multiple spreadsheets, farm managers can use this dashboard to view all important aquaculture metrics in one place.
The dashboard typically tracks key performance indicators such as:
-
Production cost
-
Revenue
-
Batch performance
-
Species productivity
-
Environmental health
-
Quality grades
-
Feed type performance
Because Power BI supports dynamic visuals and slicers, users can easily filter data by species, farming method, month, region, or farm location.
As a result, aquaculture companies can quickly identify performance trends and optimize farm operations.
Why Do Aquaculture Businesses Need a Power BI Dashboard?
Click to Purchases Aquaculture Dashboard in Power BI
Aquaculture operations involve many variables. Farm managers must monitor production levels, feed efficiency, disease risk, water conditions, and financial performance simultaneously.
However, traditional reporting methods create several problems:
-
Data remains scattered across multiple spreadsheets
-
Managers cannot identify trends quickly
-
Reporting takes significant time
-
Decision-making becomes slow
Therefore, organizations adopt Power BI dashboards to solve these challenges.
A centralized dashboard helps aquaculture farms:
-
Monitor production efficiency
-
Analyze revenue by farming method
-
Evaluate species performance
-
Track farm inspection results
-
Identify profitable production strategies
Consequently, farms can increase productivity and reduce operational risks.
Key Features of the Aquaculture Dashboard in Power BI
The Aquaculture Dashboard in Power BI contains five analytical pages within the Power BI desktop application. Each page focuses on a specific area of aquaculture performance.
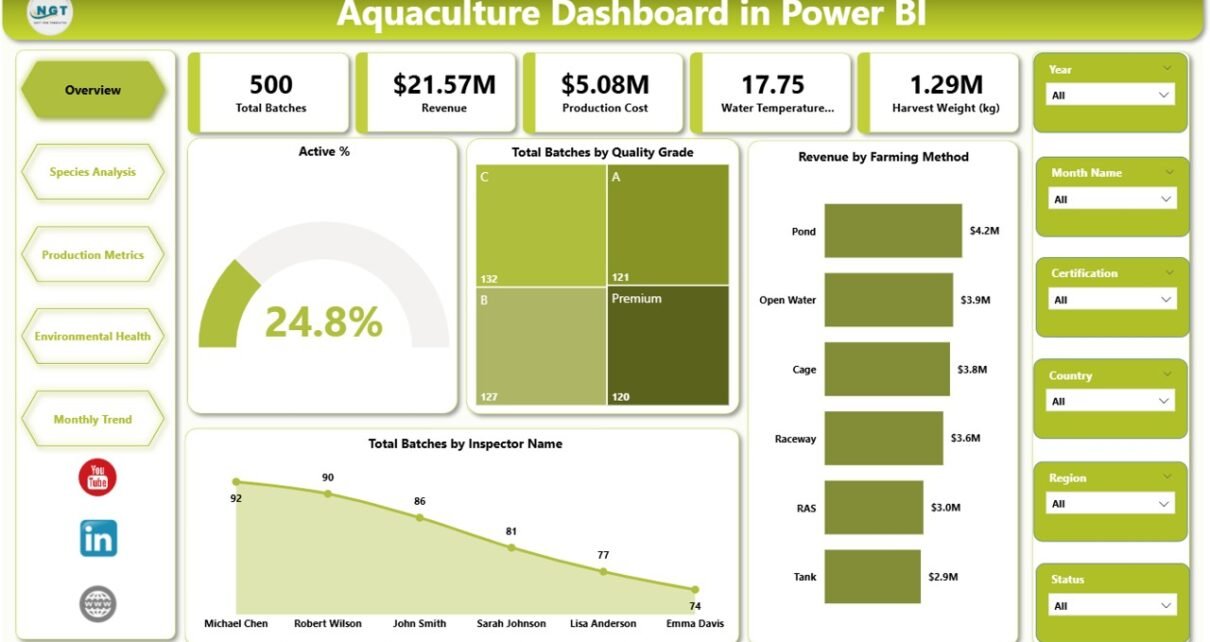
1. Overview Page
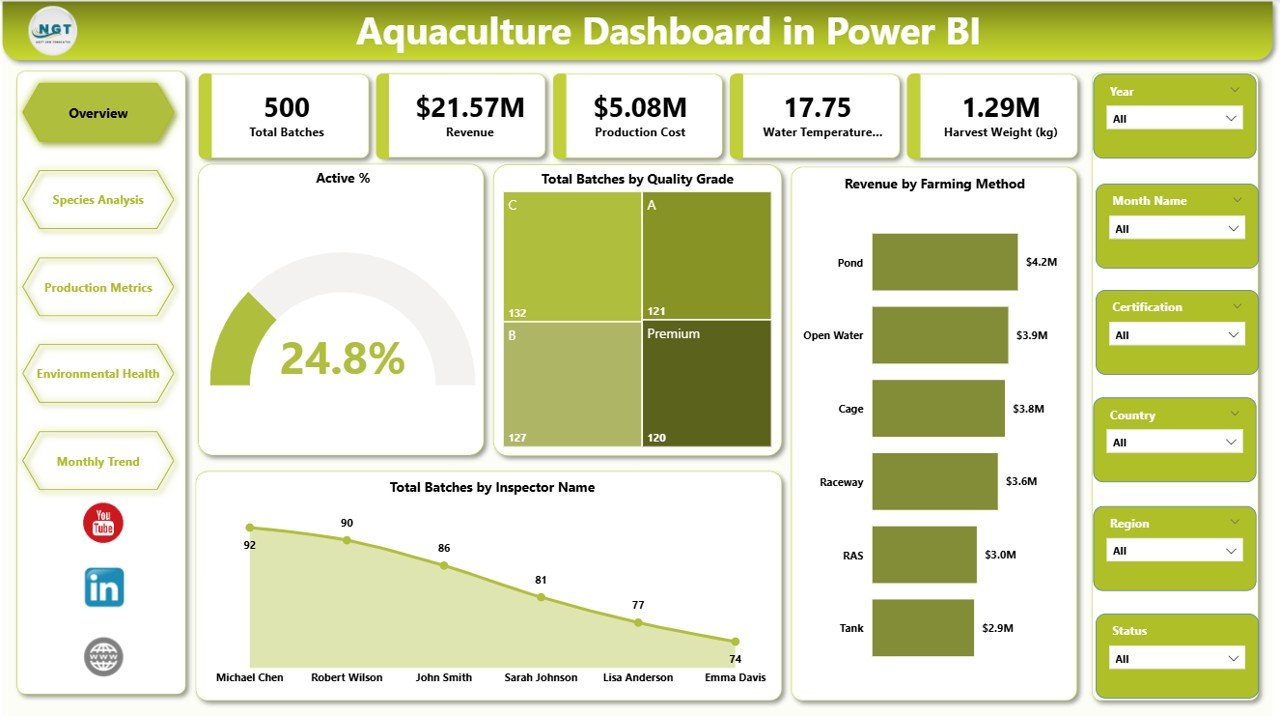
The Overview Page serves as the main dashboard page. It provides a high-level summary of the entire aquaculture operation.
Managers can quickly evaluate the overall health and performance of their farms.
This page contains slicers that allow users to filter data based on selected parameters.
The Overview page includes five KPI cards, such as:
-
Active % – Shows the percentage of currently active aquaculture batches
-
Total Batches by Quality Grade – Displays how many production batches belong to each quality grade
-
Revenue by Farming Method – Shows revenue generated through different farming techniques
-
Total Batches by Inspector Name – Identifies inspection workload distribution
-
Additional summary metrics to monitor overall farm activity
Because these KPIs appear at the top of the dashboard, decision-makers can instantly understand operational performance.
2. Species Analysis Page
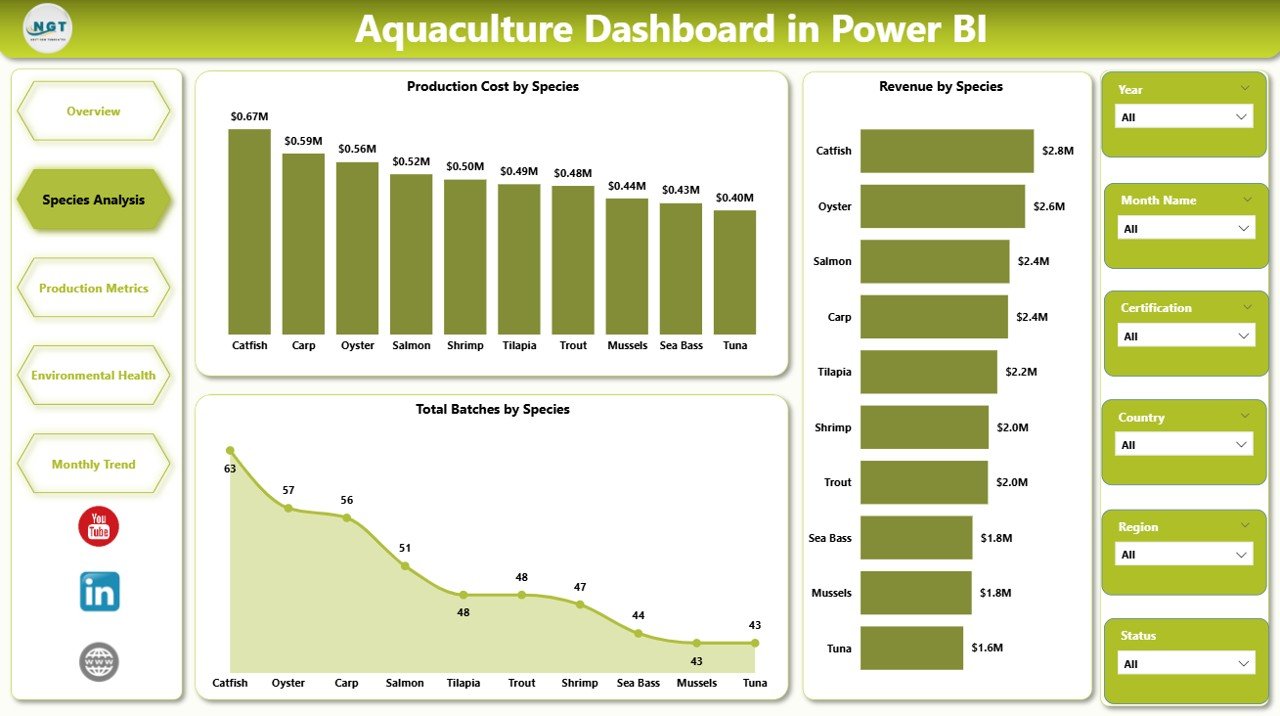
The Species Analysis Page focuses on evaluating performance across different aquatic species.
Aquaculture farms often cultivate multiple species such as:
-
Tilapia
-
Salmon
-
Shrimp
-
Catfish
-
Carp
Each species has different production costs, growth cycles, and revenue potential. Therefore, analyzing species-level data helps managers optimize farm planning.
This page includes the following charts:
-
Production Cost by Species – Identifies which species require higher production investment
-
Revenue by Species – Shows which species generate the highest financial return
-
Total Batches by Species – Displays production volume by species category
As a result, farm managers can focus on species that deliver higher profitability.
3. Production Metrics Page
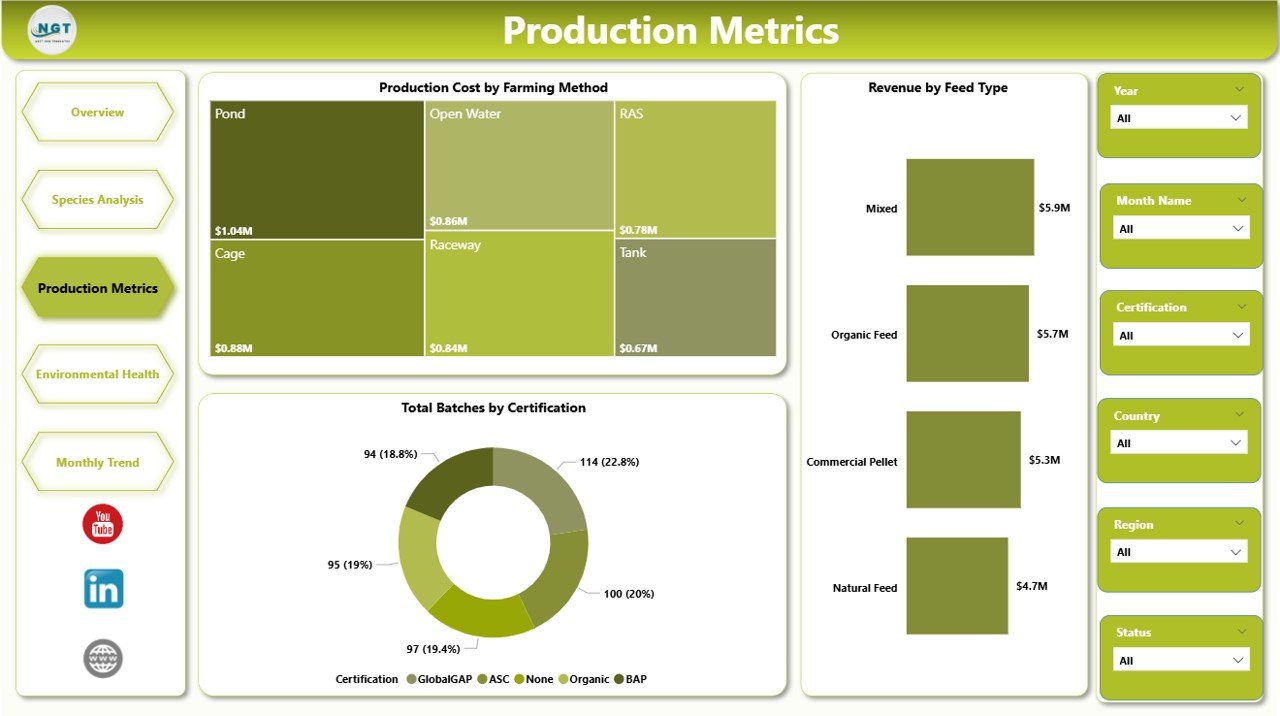
The Production Metrics Page provides detailed insights into operational costs and production efficiency.
Aquaculture production depends heavily on farming methods and feed management. Therefore, this page analyzes production metrics from multiple perspectives.
This page includes three important charts:
-
Production Cost by Farming Method – Compares costs across farming techniques such as pond farming, cage farming, or recirculating aquaculture systems
-
Revenue by Feed Type – Evaluates how different feed strategies impact revenue generation
-
Total Batches by Certification – Shows production batches that meet different certification standards such as organic or sustainable aquaculture
Consequently, businesses can optimize feeding strategies and farming methods.
Click to Purchases Aquaculture Dashboard in Power BI
4. Environmental Health Page
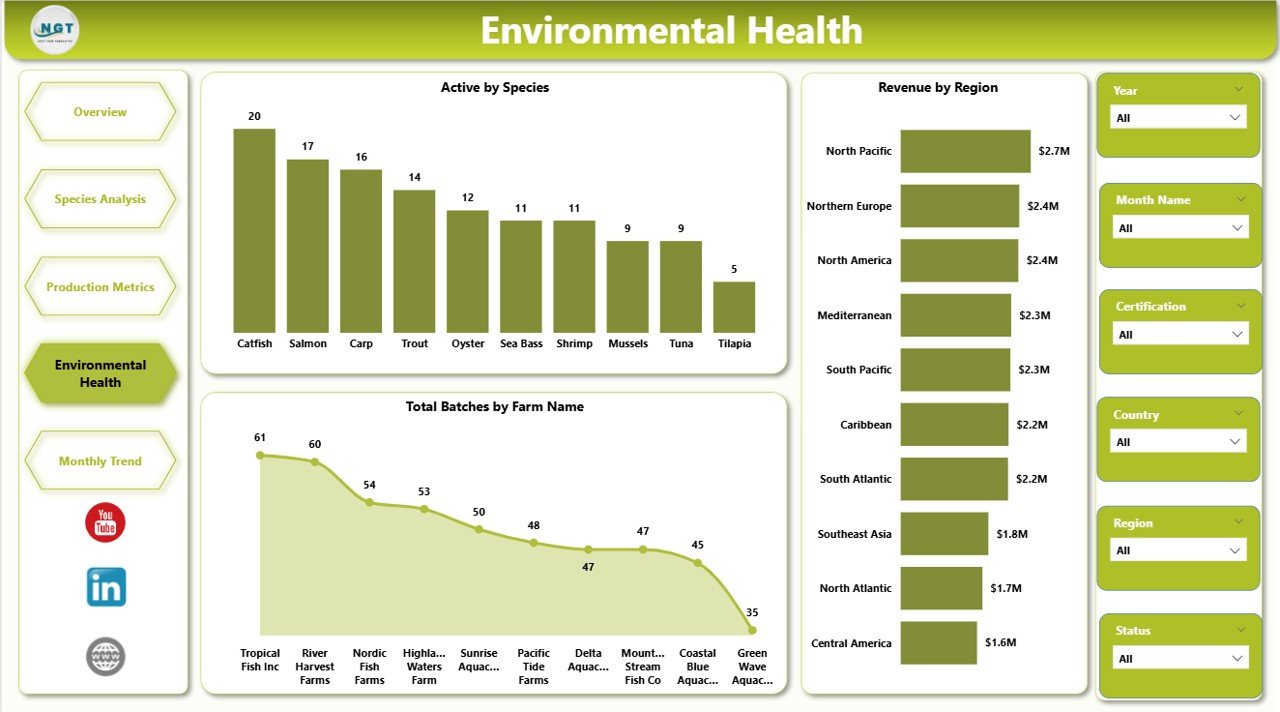
Environmental conditions directly influence aquaculture productivity. Water quality, species activity levels, and farm location impact fish growth and survival rates.
Therefore, monitoring environmental health becomes essential for successful aquaculture operations.
The Environmental Health Page focuses on environmental and farm performance indicators.
This page includes three charts:
-
Active by Species – Shows activity levels across different species
-
Revenue by Region – Displays financial performance across farming regions
-
Total Batches by Farm Name – Identifies production distribution across farms
With this information, managers can detect environmental patterns and adjust farming practices accordingly.
5. Month Analysis Page
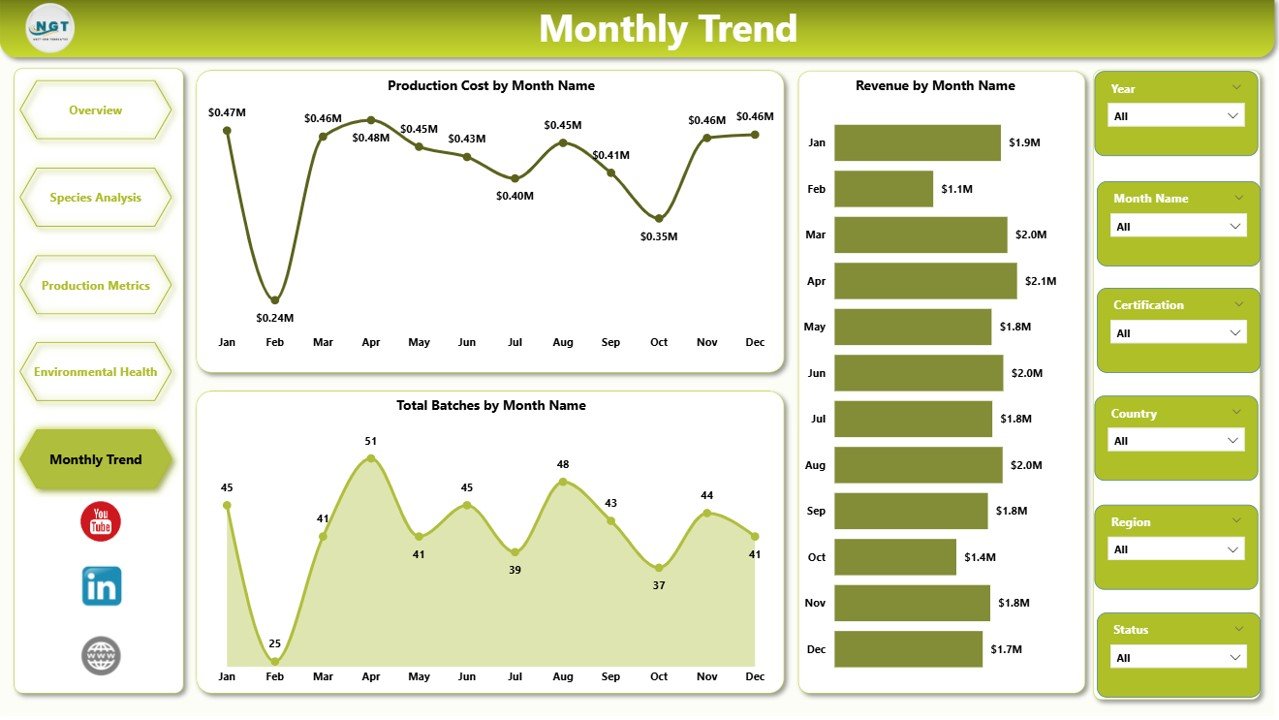
The Month Analysis Page helps users analyze production trends over time.
Seasonal variations often influence aquaculture production, feed consumption, and revenue generation. Therefore, monthly analysis becomes essential for forecasting and planning.
This page contains the following charts:
-
Production Cost by Month – Tracks cost trends across different months
-
Revenue by Month – Shows seasonal revenue patterns
-
Total Batches by Month – Displays batch production distribution throughout the year
By analyzing monthly trends, aquaculture businesses can improve production planning.
Advantages of the Aquaculture Dashboard in Power BI
The Aquaculture Dashboard in Power BI provides several benefits for aquaculture businesses and farm managers.
1. Centralized Data Management
The dashboard consolidates data from multiple sources into one centralized system.
As a result, managers can access production, cost, and revenue information in one place.
2. Real-Time Insights
Power BI enables real-time data updates. Therefore, users can monitor farm performance without waiting for manual reports.
3. Improved Decision-Making
Interactive visuals make it easier to analyze production trends.
Consequently, managers can make faster and better decisions.
4. Better Species Performance Monitoring
The species analysis page helps identify profitable species and inefficient production areas.
Therefore, farms can focus on high-performing species.
5. Enhanced Operational Efficiency
Production metrics allow managers to evaluate farming methods and feed strategies.
As a result, businesses can reduce operational costs.
6. Environmental Monitoring
Environmental dashboards help track species activity and farm productivity across regions.
Therefore, managers can detect environmental risks early.
7. Seasonal Trend Analysis
Monthly analysis helps aquaculture farms understand seasonal production patterns.
Consequently, managers can plan future harvest cycles more effectively.
Best Practices for the Aquaculture Dashboard in Power BI
Although the dashboard provides powerful analytics, businesses should follow several best practices to maximize its value.
1. Maintain Accurate Data
Always ensure that the underlying data remains accurate and updated.
Clean and structured data improves dashboard performance.
2. Use Consistent Data Sources
Avoid using multiple inconsistent data sources.
Instead, integrate farm data systems with Power BI for reliable reporting.
3. Define Clear KPIs
Identify important aquaculture KPIs such as:
-
Survival rate
-
Production cost per batch
-
Revenue per species
-
Feed efficiency
These KPIs help managers focus on key performance areas.
4. Use Interactive Filters
Click to Purchases Aquaculture Dashboard in Power BI
Power BI slicers allow users to filter information easily.
Use slicers for:
-
Species
-
Region
-
Farm
-
Month
-
Farming method
This improves dashboard usability.
5. Monitor Environmental Indicators
Environmental health directly impacts fish productivity.
Therefore, regularly monitor species activity and farm performance.
6. Review Monthly Performance
Always review monthly production and revenue trends.
This helps farms plan harvest cycles and feed strategies effectively.
How Can Aquaculture Businesses Use This Dashboard?
Aquaculture companies can use the dashboard in several ways.
Farm Performance Monitoring
Managers can quickly evaluate production levels across farms.
Financial Analysis
Businesses can analyze revenue trends and cost structures.
Operational Planning
Production metrics help optimize farming methods.
Environmental Risk Management
Environmental health insights help detect potential risks.
Strategic Decision Making
Species analysis allows managers to focus on profitable species.
Who Can Benefit from the Aquaculture Dashboard?
Several professionals within the aquaculture industry can benefit from this dashboard.
These include:
-
Aquaculture farm managers
-
Fisheries business owners
-
Aquaculture consultants
-
Seafood production companies
-
Sustainability monitoring agencies
-
Agricultural data analysts
Because the dashboard provides comprehensive operational insights, it supports better aquaculture management.
How Does Power BI Improve Aquaculture Analytics?
Power BI offers several capabilities that improve aquaculture data analysis.
Interactive Data Visualization
Power BI converts complex farm data into interactive charts and graphs.
Dynamic Filtering
Users can filter information instantly using slicers.
Automated Reporting
Power BI reduces manual reporting efforts.
Data Integration
The platform integrates data from Excel, databases, and cloud sources.
Advanced Analytics
Power BI supports advanced data modeling and forecasting.
Because of these features, Power BI becomes an ideal tool for aquaculture analytics.
Future of Aquaculture Analytics
The aquaculture industry continues to adopt advanced technologies.
Modern farms increasingly use:
-
IoT sensors for water monitoring
-
AI-based disease detection
-
Automated feeding systems
-
Satellite monitoring
Therefore, data analytics dashboards will become even more important.
Power BI dashboards will help integrate these technologies and provide deeper insights into aquaculture operations.
Conclusion
The Aquaculture Dashboard in Power BI provides a powerful analytical solution for aquaculture businesses that want to monitor production, analyze species performance, evaluate farming methods, and track revenue trends.
Because the dashboard organizes operational data into interactive visuals, managers can quickly understand farm performance and make better decisions.
Moreover, the five analytical pages — Overview, Species Analysis, Production Metrics, Environmental Health, and Month Analysis — provide comprehensive insights into aquaculture operations.
Therefore, businesses that adopt data-driven dashboards can improve productivity, reduce operational risks, and increase profitability.
Frequently Asked Questions (FAQs)
What is an Aquaculture Dashboard in Power BI?
An Aquaculture Dashboard in Power BI is an interactive reporting system that helps aquaculture businesses analyze production, revenue, species performance, and environmental conditions.
Why should aquaculture farms use Power BI dashboards?
Power BI dashboards help farms visualize operational data, identify performance trends, and make faster data-driven decisions.
What KPIs should an aquaculture dashboard track?
Important aquaculture KPIs include production cost, revenue, survival rate, feed efficiency, and batch performance.
Can small aquaculture farms use Power BI dashboards?
Yes. Small farms can also benefit from Power BI dashboards because they provide clear insights into farm operations and financial performance.
How often should aquaculture dashboards be updated?
Businesses should update dashboards regularly. Ideally, farms should update production data daily or weekly for accurate analysis.
Visit our YouTube channel to learn step-by-step video tutorials