In today’s world, sustainable farming is growing rapidly. Businesses and farmers now look for smarter ways to manage aquaculture and agriculture together. As a result, aquaponics has become one of the most efficient and eco-friendly farming methods.
However, managing aquaponics systems manually can become complex. You need to track fish production, plant yield, water usage, costs, and revenue all at once. Therefore, you need a centralized solution.
That’s where the Aquaponics Dashboard in Excel becomes a game-changer.
In this detailed guide, you will learn everything about this powerful dashboard. Moreover, you will understand its structure, features, advantages, best practices, and how it helps you make better decisions.
Click to buy Aquaponics Dashboard in Excel
What is an Aquaponics Dashboard in Excel?
An Aquaponics Dashboard in Excel is an interactive and data-driven reporting tool. It helps you monitor, analyze, and optimize your aquaponics farming operations.
Instead of managing multiple spreadsheets, you can track everything in one place. As a result, you gain better visibility and control.
With this dashboard, you can:
- Monitor system performance
- Track fish and plant production
- Analyze costs and profitability
- Measure sustainability metrics
- Improve operational efficiency
In addition, Excel makes it easy to customize and scale based on your farm size.
Why Do You Need an Aquaponics Dashboard?
Managing aquaponics systems involves multiple variables. Therefore, tracking them manually often leads to errors and delays.
However, with a dashboard:
- You get real-time insights
- You reduce manual work
- You improve decision-making
- You optimize resource usage
Moreover, you can quickly identify issues and take action.
Key Features of Aquaponics Dashboard in Excel
This ready-to-use dashboard includes multiple sheet tabs. Each tab focuses on a specific area of your aquaponics system.
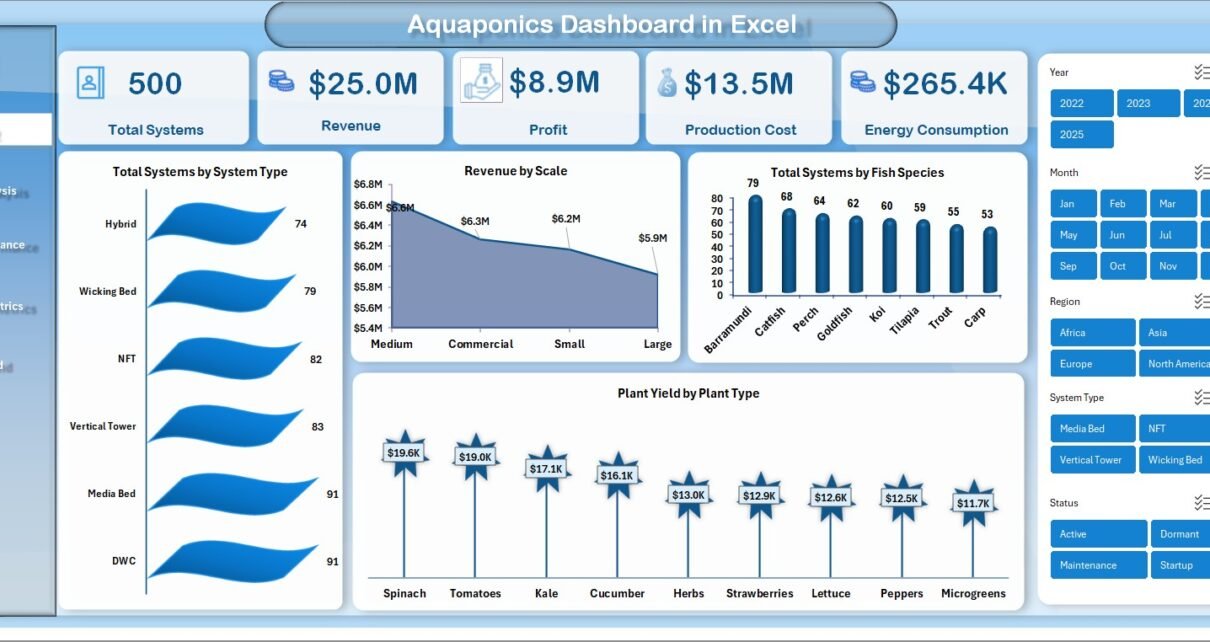
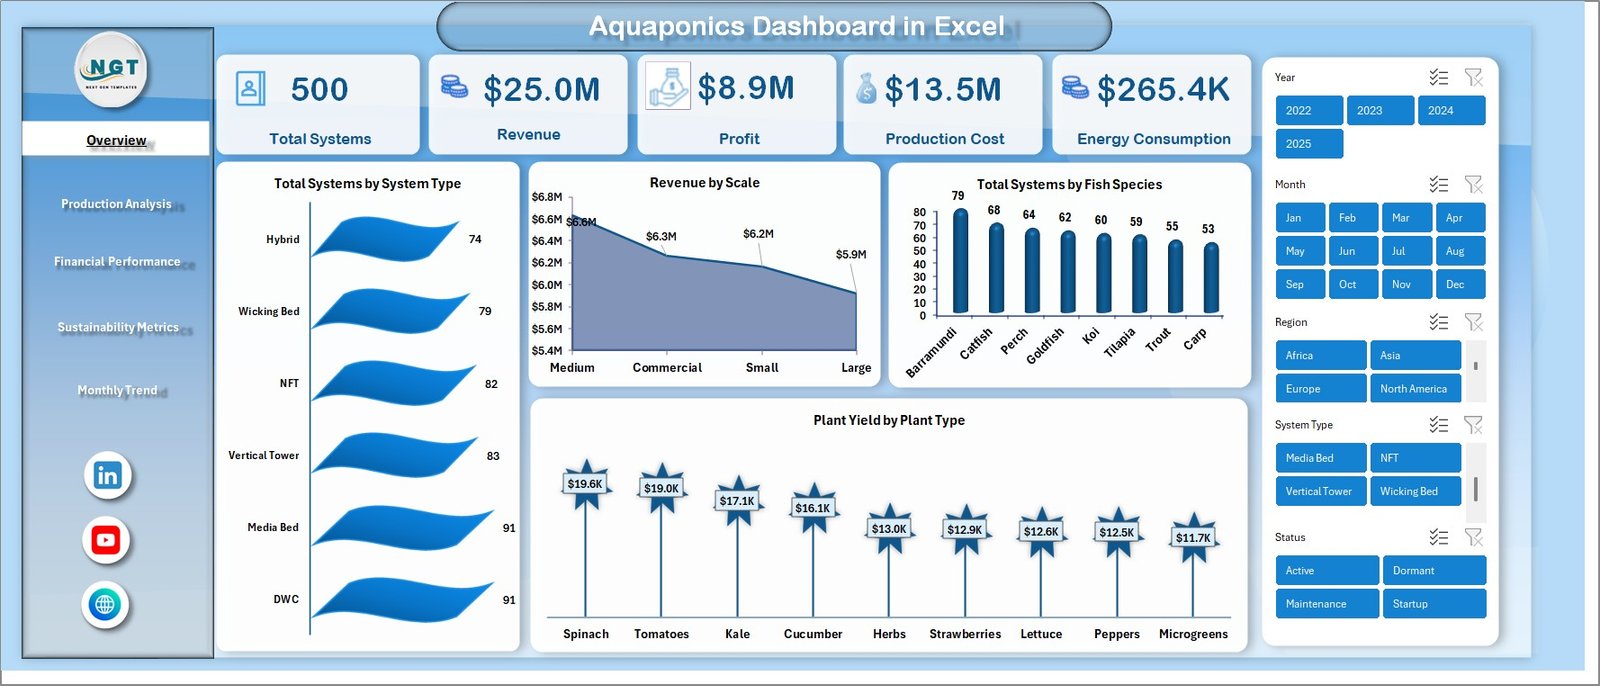
Overview Sheet – Your Central Command Center
The Overview sheet provides a complete snapshot of your operations.
KPI Cards Included:
- Total Systems
- Revenue
- Profit
- Production Cost
- Energy Consumption
Charts Included:
- Total Systems by System Type
- Revenue by Scale
- Total Systems by Fish Species
- Plant Yield by Plant Type
Therefore, you can quickly understand overall performance at a glance.
Click to buy Aquaponics Dashboard in Excel
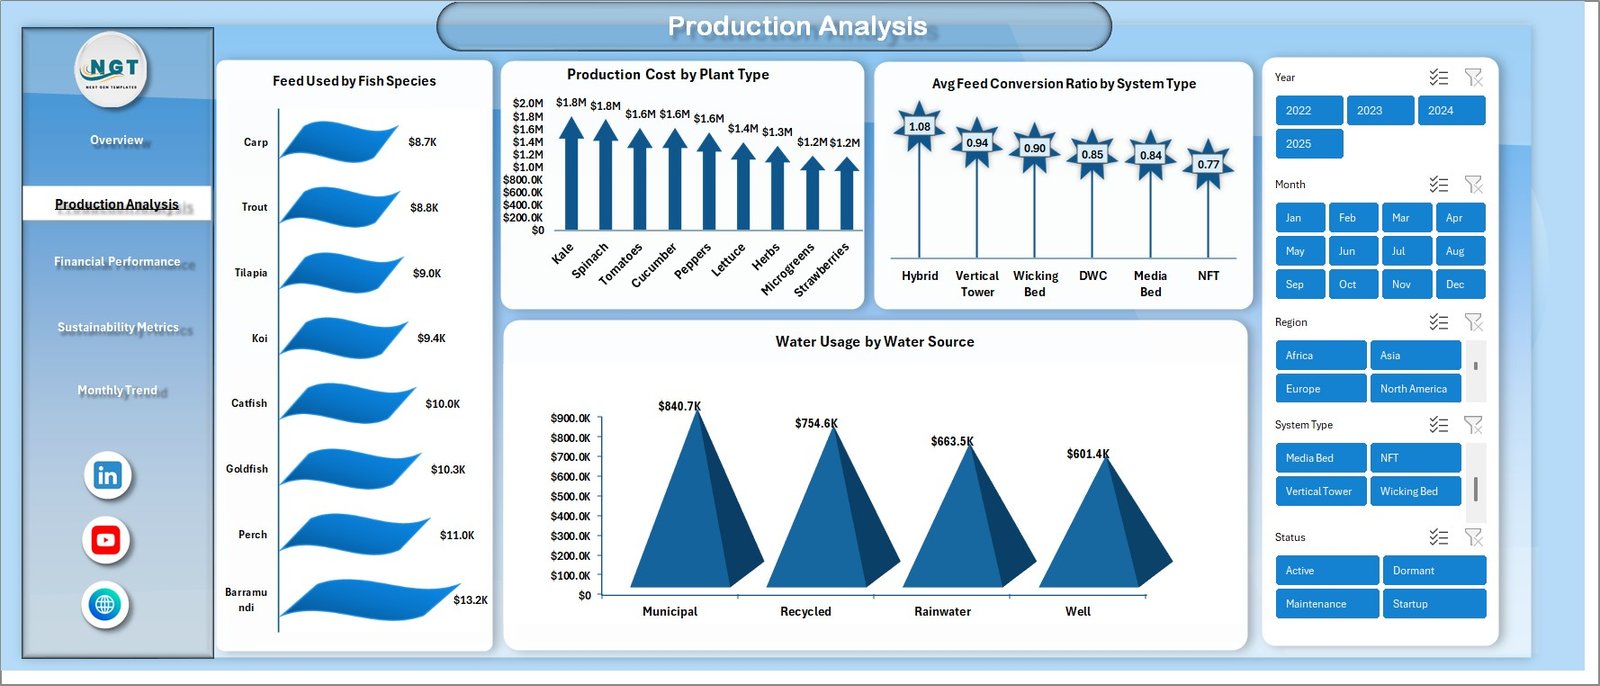
Production Analysis – Optimize Your Farming Output
This sheet focuses on production efficiency.
Key Insights:
- Feed Used by Fish Species
- Production Cost by Plant Type
- Avg. Feed Conversion Ratio by System Type
- Water Usage by Water Source
As a result, you can reduce waste and improve yield.
Click to buy Aquaponics Dashboard in Excel
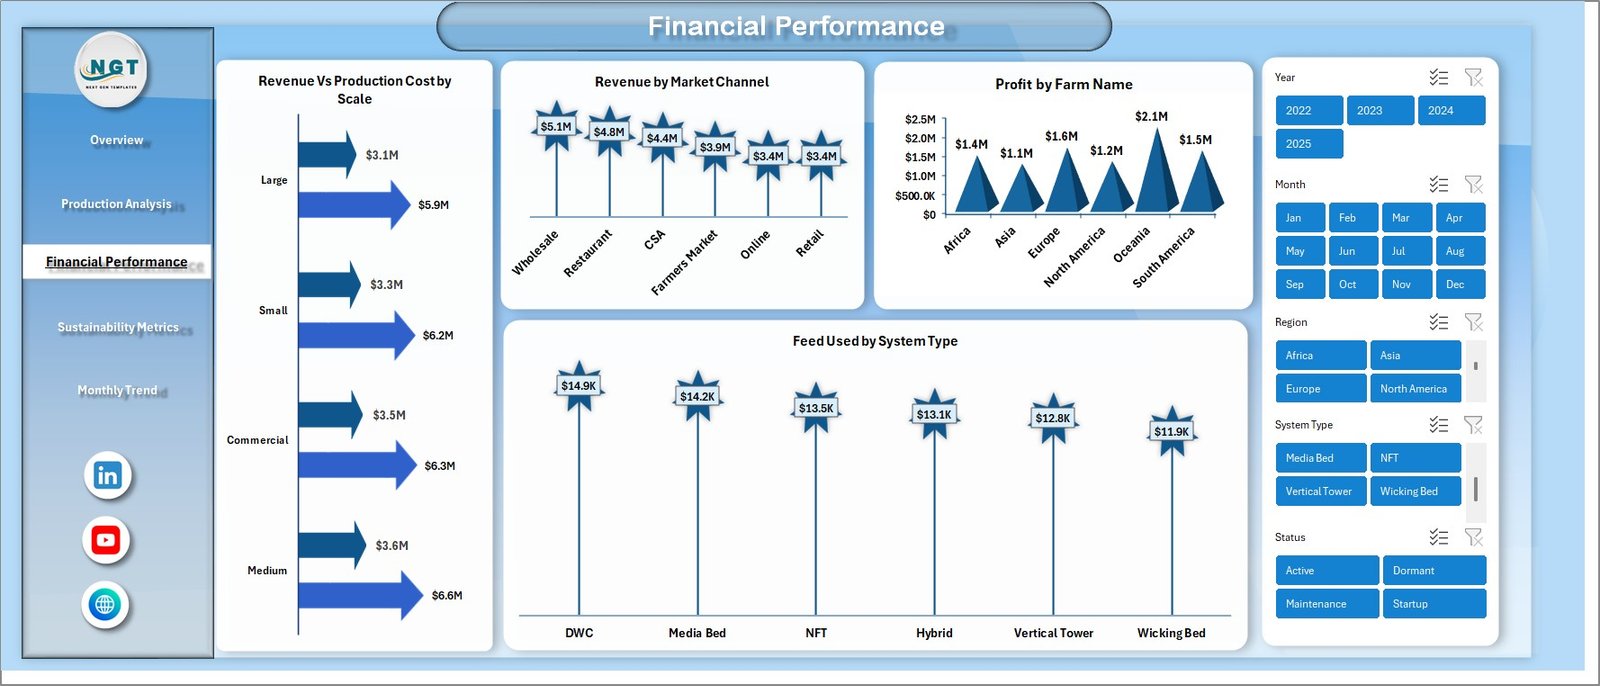
Financial Performance – Track Profitability Smartly
This section helps you analyze financial health.
Key Metrics:
- Revenue vs Production Cost by Scale
- Revenue by Market Channel
- Profit by Farm Name
- Feed Used by System Type
Therefore, you can identify profitable segments and control costs effectively.
Click to buy Aquaponics Dashboard in Excel
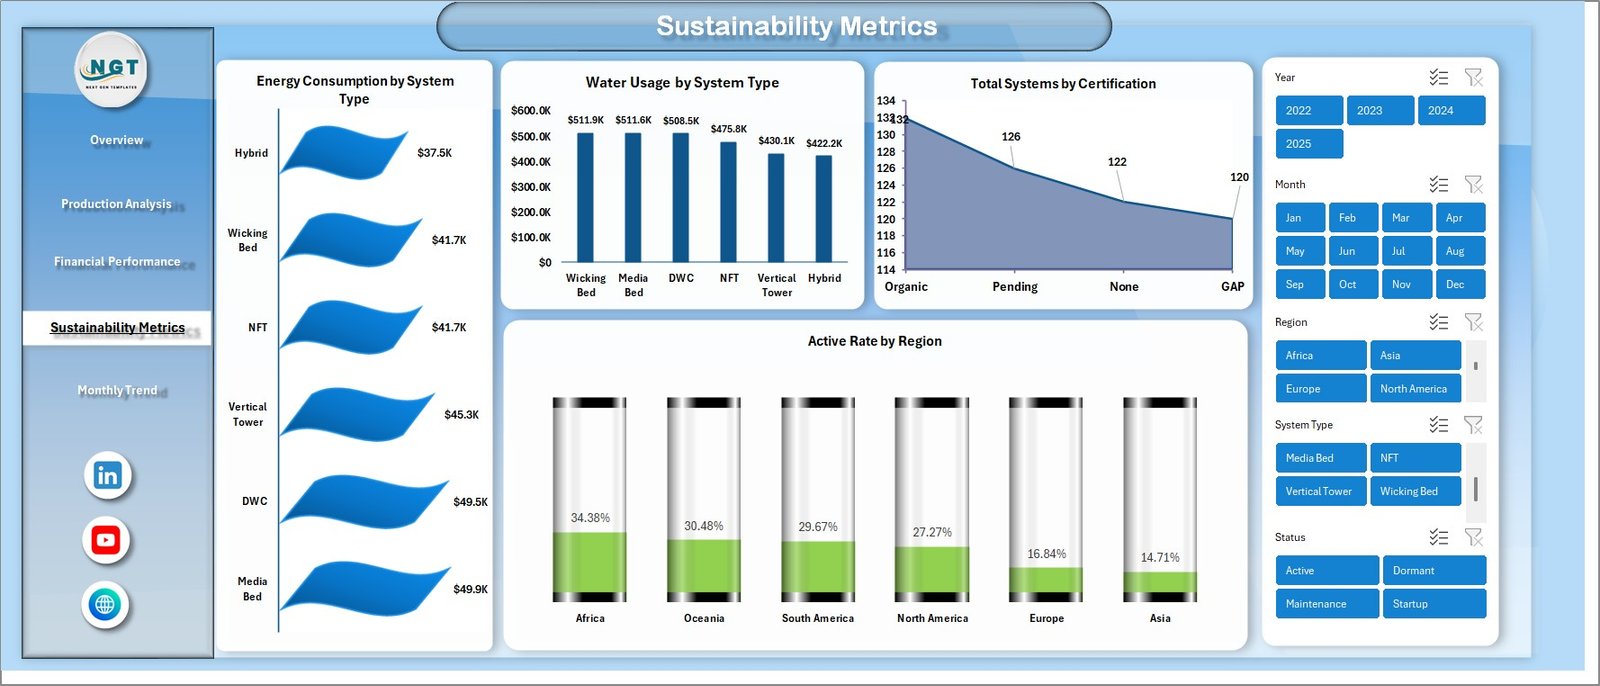
Sustainability Metrics – Measure Environmental Impact
Sustainability is critical in aquaponics. Hence, this sheet tracks eco-friendly metrics.
Key Indicators:
- Energy Consumption by System Type
- Water Usage by System Type
- Total Systems by Certification
- Active Rate by Region
Consequently, you can ensure sustainable farming practices.
Click to buy Aquaponics Dashboard in Excel
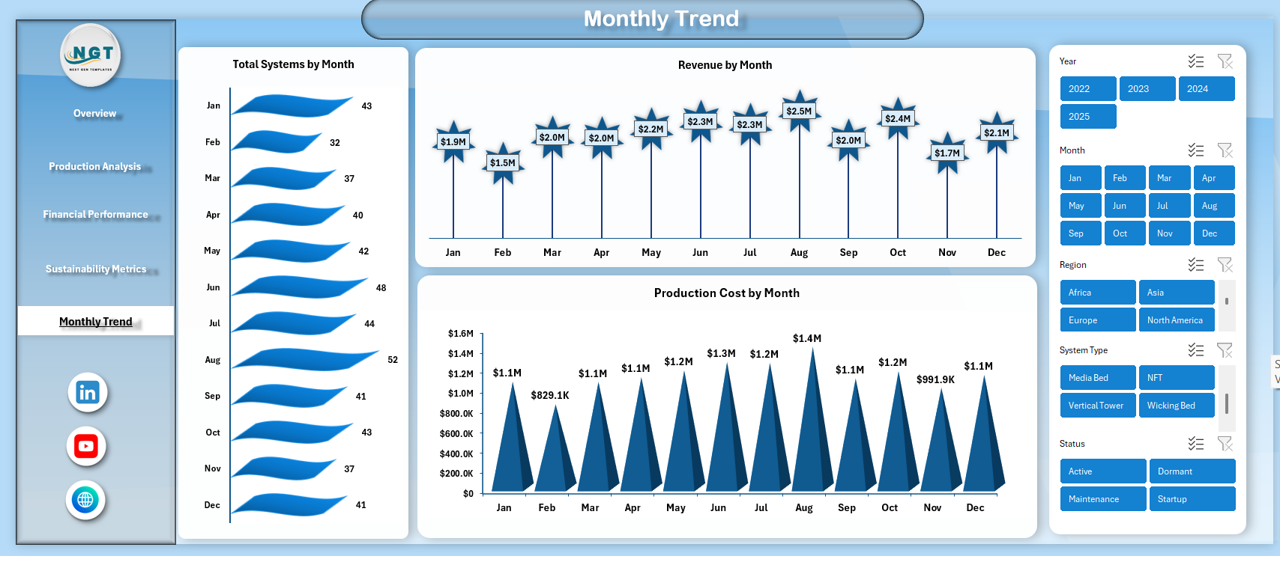
Monthly Trends – Track Performance Over Time
This sheet helps you monitor trends.
Monthly Analysis:
- Total Systems by Month
- Revenue by Month
- Production Cost by Month
Therefore, you can identify seasonal patterns and plan accordingly.
How Does the Aquaponics Dashboard Work?
The dashboard works using structured Excel data.
Step-by-Step Process:
- Enter raw data (fish, plants, costs, etc.)
- Use Excel tables for structured data
- Apply pivot tables for analysis
- Use charts for visualization
- Add slicers for interactivity
As a result, you get dynamic and real-time insights.
Click to buy Aquaponics Dashboard in Excel
Advantages of Aquaponics Dashboard in Excel
Using this dashboard offers multiple benefits. Let’s explore them.
Centralized Data Management
You can manage all your data in one place. Therefore, you avoid confusion and duplication.
Better Decision-Making
The dashboard provides clear insights. As a result, you can make faster and smarter decisions.
Improved Productivity
You reduce manual work. Moreover, automation saves time and effort.
Cost Optimization
You can track expenses easily. Therefore, you identify areas where you can reduce costs.
Sustainability Monitoring
You can measure water and energy usage. Hence, you maintain eco-friendly operations.
Real-Time Insights
You can update data instantly. As a result, you always work with the latest information.
Easy Customization
Excel allows flexibility. Therefore, you can modify the dashboard as per your needs.
Who Can Benefit from This Dashboard?
This dashboard suits a wide range of users.
Ideal Users:
- Aquaponics farmers
- Agricultural businesses
- Sustainable farming startups
- Researchers and analysts
- Farm managers
Moreover, even beginners can use it easily.
Best Practices for the Aquaponics Dashboard in Excel
To get the best results, you should follow these best practices.
Maintain Clean Data
Always enter accurate and consistent data. Otherwise, your analysis may become incorrect.
Use Structured Tables
Convert your data into Excel tables. As a result, formulas and charts update automatically.
Update Data Regularly
Do not delay updates. Instead, update data frequently for real-time insights.
Use Slicers and Filters
Apply slicers for better interactivity. Therefore, you can analyze data quickly.
Monitor Key KPIs
Focus on important metrics such as:
- Revenue
- Profit
- Feed usage
- Water consumption
Optimize Charts
Keep charts simple and readable. Moreover, avoid unnecessary complexity.
Backup Your Data
Always keep a backup. Therefore, you prevent data loss.
How Can You Improve Your Aquaponics Operations Using This Dashboard?
You can use this dashboard strategically.
Key Improvements:
- Identify high-performing systems
- Reduce feed wastage
- Improve plant yield
- Optimize water usage
- Increase profitability
As a result, your farm becomes more efficient and sustainable.
Opportunities for Improvement in Aquaponics Dashboard
Even though the dashboard is powerful, you can improve it further.
Suggested Enhancements:
- Add automated alerts for low performance
- Integrate IoT data for real-time tracking
- Include predictive analytics
- Use Power BI for advanced visualization
Future Scope of Aquaponics Analytics
Aquaponics is evolving rapidly. Therefore, dashboards will become more advanced.
Future Trends:
- AI-based farming insights
- IoT-enabled monitoring systems
- Cloud-based dashboards
- Automated reporting
As a result, farming will become smarter and more efficient.
Conclusion
The Aquaponics Dashboard in Excel is a powerful tool for modern farming. It simplifies complex data and turns it into actionable insights.
Moreover, it helps you improve productivity, reduce costs, and maintain sustainability. Therefore, every aquaponics farmer should consider using this dashboard.
If you want to manage your aquaponics operations efficiently, this dashboard is the perfect solution.
Frequently Asked Questions (FAQs)
What is an Aquaponics Dashboard in Excel?
It is an Excel-based tool that helps track and analyze aquaponics farming data in one place.
Can beginners use this dashboard?
Yes, the dashboard is user-friendly. Therefore, beginners can use it easily.
What data do I need to use this dashboard?
You need data related to:
- Fish production
- Plant yield
- Costs
- Revenue
- Water and energy usage
How often should I update the dashboard?
You should update it regularly. Ideally, update it daily or weekly.
Can I customize the dashboard?
Yes, Excel allows full customization. Therefore, you can modify it based on your needs.
Is this dashboard suitable for large farms?
Yes, it works for both small and large farms.
Does it support real-time data?
It supports near real-time updates. However, you need to update data manually unless integrated with external systems.
Visit our YouTube channel to learn step-by-step video tutorials
Watch the step-by-step video tutorial:
Click to buy Aquaponics Dashboard in Excel