The AR and VR gaming industry is evolving faster than ever. New studios launch immersive experiences regularly, platforms expand, and monetization models change rapidly. However, many AR/VR gaming studios still struggle to track costs, revenue, user engagement, and profitability in one clear system. As a result, decision-making becomes slow and reactive.
That is exactly where the AR/VR Gaming Studios Dashboard in Excel becomes a powerful solution.
In this in-depth, SEO-friendly article, you will learn what an AR/VR Gaming Studios Dashboard in Excel is, why studios need it, how it works, its page-wise dashboard structure, key features, advantages, best practices, and frequently asked questions. The content stays simple, practical, and easy to understand throughout.
Click to Purchases AR/VR Gaming Studios Dashboard in Excel
What Is an AR/VR Gaming Studios Dashboard in Excel?
An AR/VR Gaming Studios Dashboard in Excel is a ready-to-use analytical template designed to help gaming studios track and analyze their financial performance, user engagement, platform performance, regional trends, and monthly growth from a single Excel file.
Instead of managing multiple spreadsheets or scattered reports, this dashboard brings all critical metrics together into interactive KPI cards, charts, and slicers. Consequently, studio owners, finance teams, and product managers can make faster and smarter decisions.
Moreover, because this dashboard runs entirely in Excel, teams do not need expensive BI tools or advanced technical skills.
Why Do AR/VR Gaming Studios Need a Dashboard in Excel?
AR/VR gaming studios operate in a highly competitive environment. Costs rise quickly, user behavior changes often, and platform performance varies significantly. Therefore, studios need clear visibility into their data.
An AR/VR Gaming Studios Dashboard in Excel helps studios:
-
Monitor costs, revenue, and profit margins
-
Track DAU and MAU trends
-
Compare performance across studios, platforms, and regions
-
Identify profitable genres and monetization models
-
Analyze monthly performance trends
As a result, studios gain control, clarity, and confidence in their business decisions.
How Does an AR/VR Gaming Studios Dashboard in Excel Work?
The dashboard works on a simple yet powerful structure:
-
Data Sheet – Stores all raw gaming data such as costs, revenue, users, platforms, regions, genres, and dates
-
Support Sheet – Handles calculations, helper columns, and structured references
-
Dashboard Pages – Visual pages with KPI cards, charts, and slicers
Once users update the data sheet, the dashboard refreshes automatically. Therefore, teams always see the latest insights without manual reporting.
Key Features of the AR/VR Gaming Studios Dashboard in Excel
Before exploring the pages, let’s look at the core features that make this dashboard effective.
Page Navigator for Easy Navigation
The dashboard includes a page navigator on the left side, allowing users to switch between analysis pages instantly. This feature improves usability and saves time.
Right-Side Slicers for Dynamic Filtering
Each dashboard page includes right-side slicers. Users can filter data by studio, platform, region, genre, or time period. As a result, analysis becomes quick and interactive.
KPI Cards for Instant Insights
The dashboard uses clean KPI cards to show critical metrics at a glance. These cards help decision-makers focus on what matters most.
Click to Purchases AR/VR Gaming Studios Dashboard in Excel
Page-Wise Structure of the AR/VR Gaming Studios Dashboard in Excel
The dashboard contains five structured pages, each designed for a specific type of analysis.
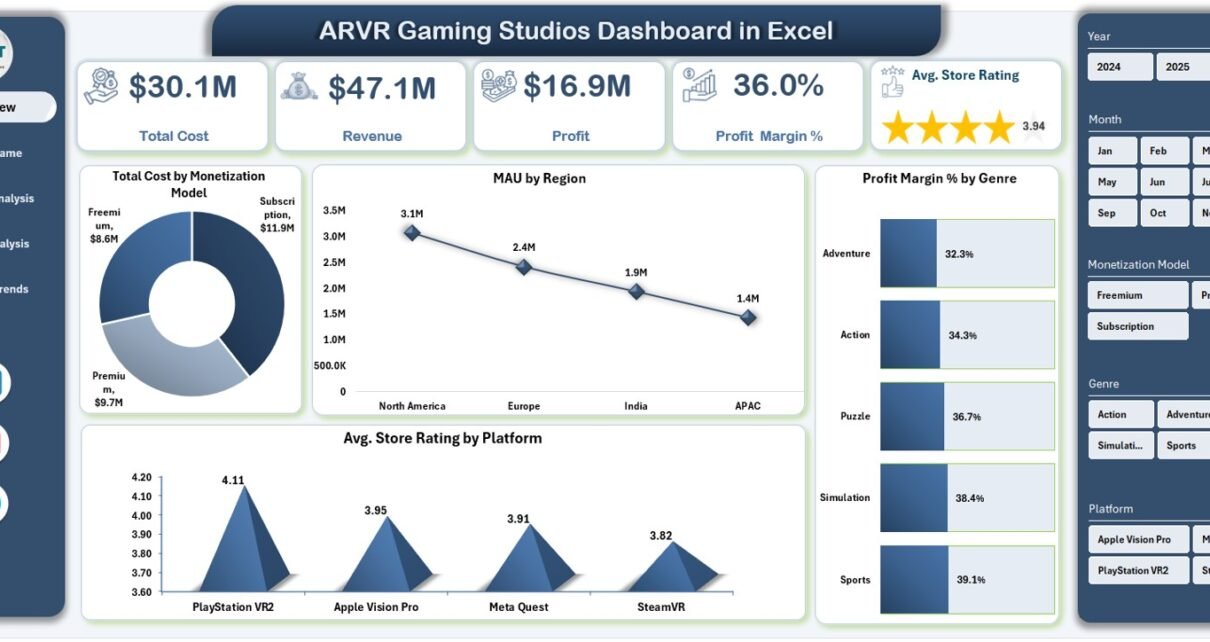
1. Overview Page: How Is the Overall Studio Performance?
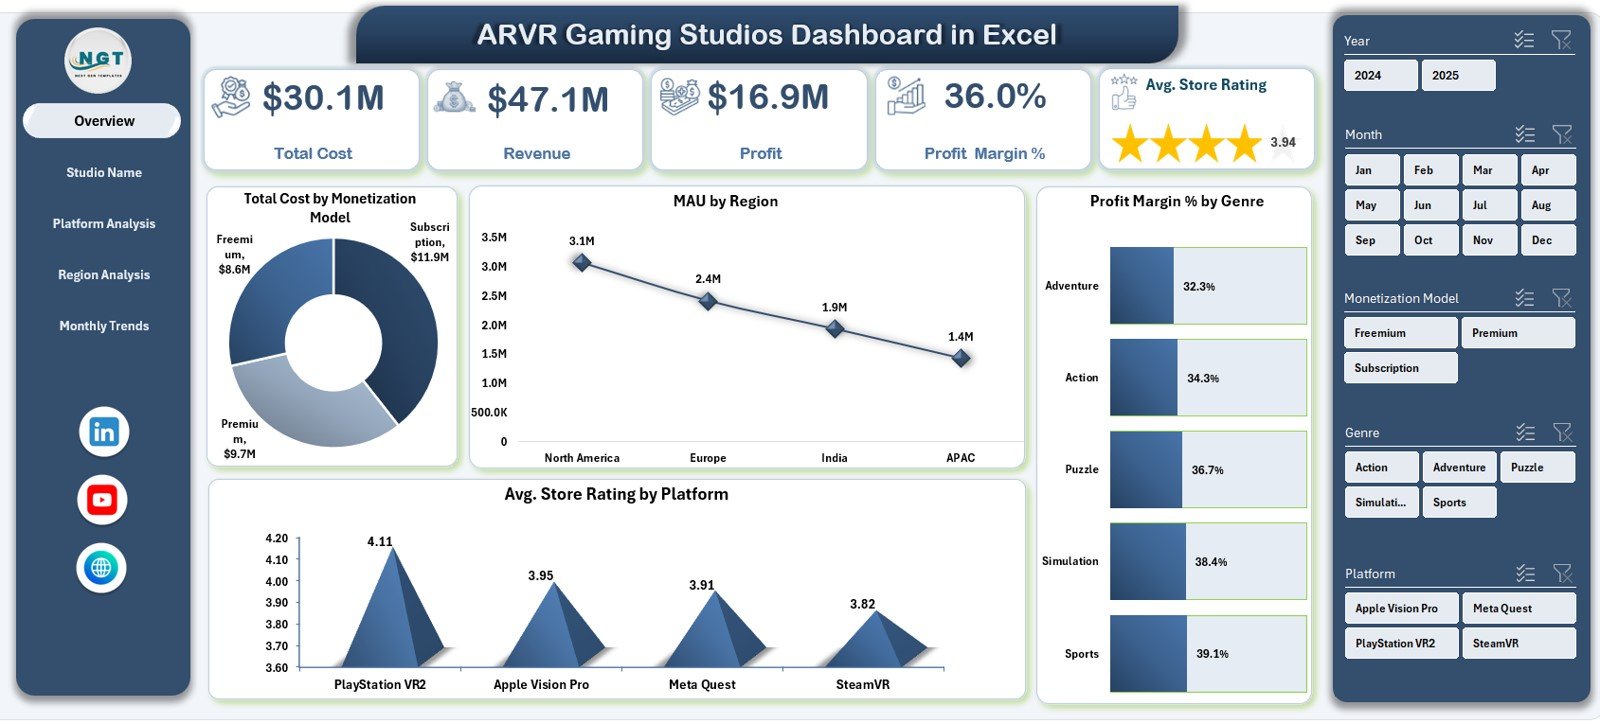
The Overview Page serves as the main control center of the dashboard. It provides a high-level snapshot of overall business performance.
KPI Cards on the Overview Page
This page includes five KPI cards:
-
Total Cost
-
Revenue
-
Profit
-
Profit Margin %
-
Average Store Rating
These cards immediately highlight the studio’s financial health and customer satisfaction.
Charts on the Overview Page
The Overview Page includes four insightful charts:
-
Total Cost by Monetization Model
-
MAU by Region
-
Profit Margin % by Genre
-
Average Store Rating by Platform
Together, these visuals help stakeholders quickly understand cost drivers, regional engagement, and platform performance.
2. Studio Name Analysis: Which Studios Perform the Best?
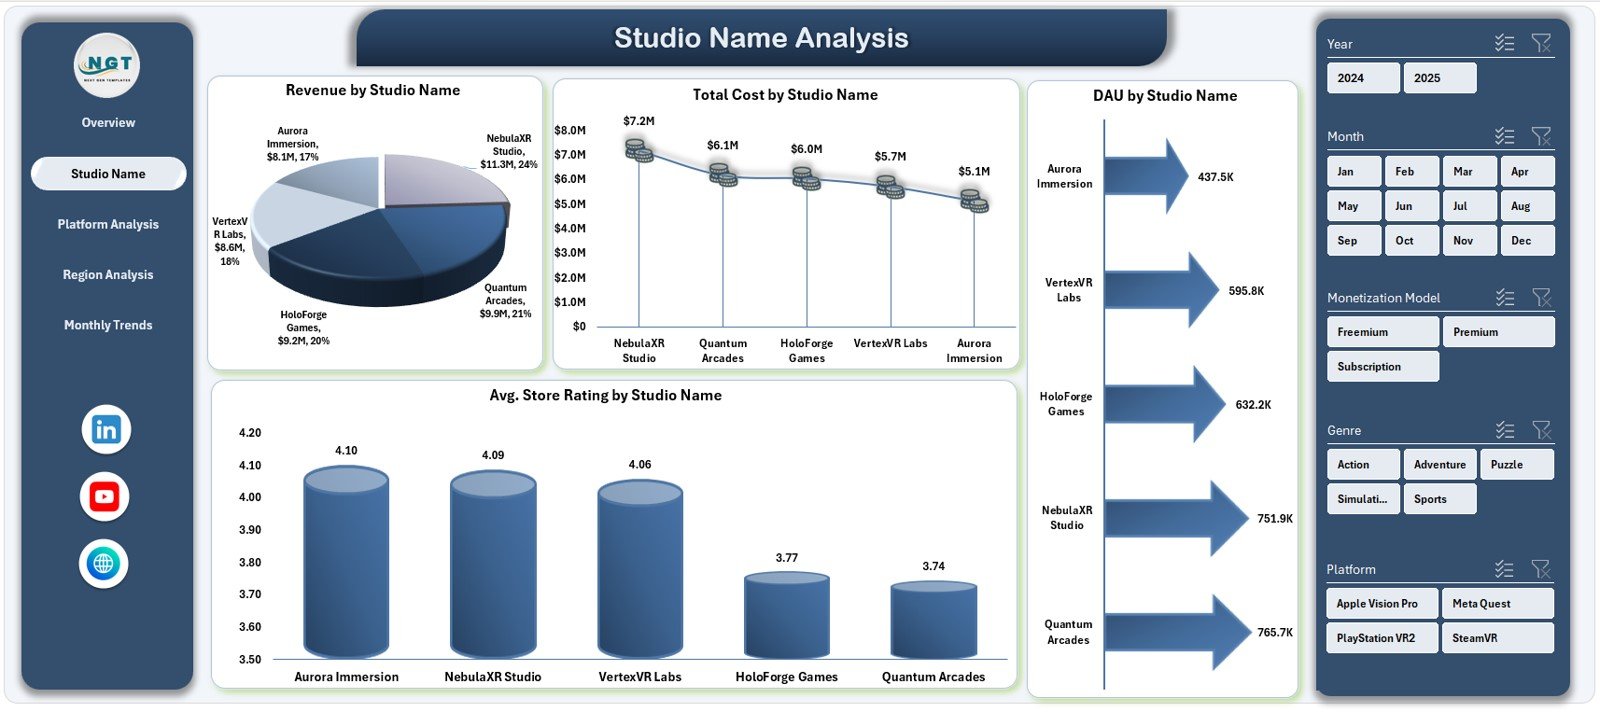
The Studio Name Analysis Page focuses on comparing performance across different gaming studios under the same organization or portfolio.
Charts on the Studio Name Analysis Page
This page includes four key charts:
-
Cost vs Revenue by Studio Name
-
Total Cost by Studio Name
-
DAU by Studio Name
-
Average Store Rating by Studio Name
As a result, managers can identify high-performing studios, cost-heavy studios, and studios with strong user engagement.
Click to Purchases AR/VR Gaming Studios Dashboard in Excel
3. Platform Analysis: Which Platforms Drive Growth?
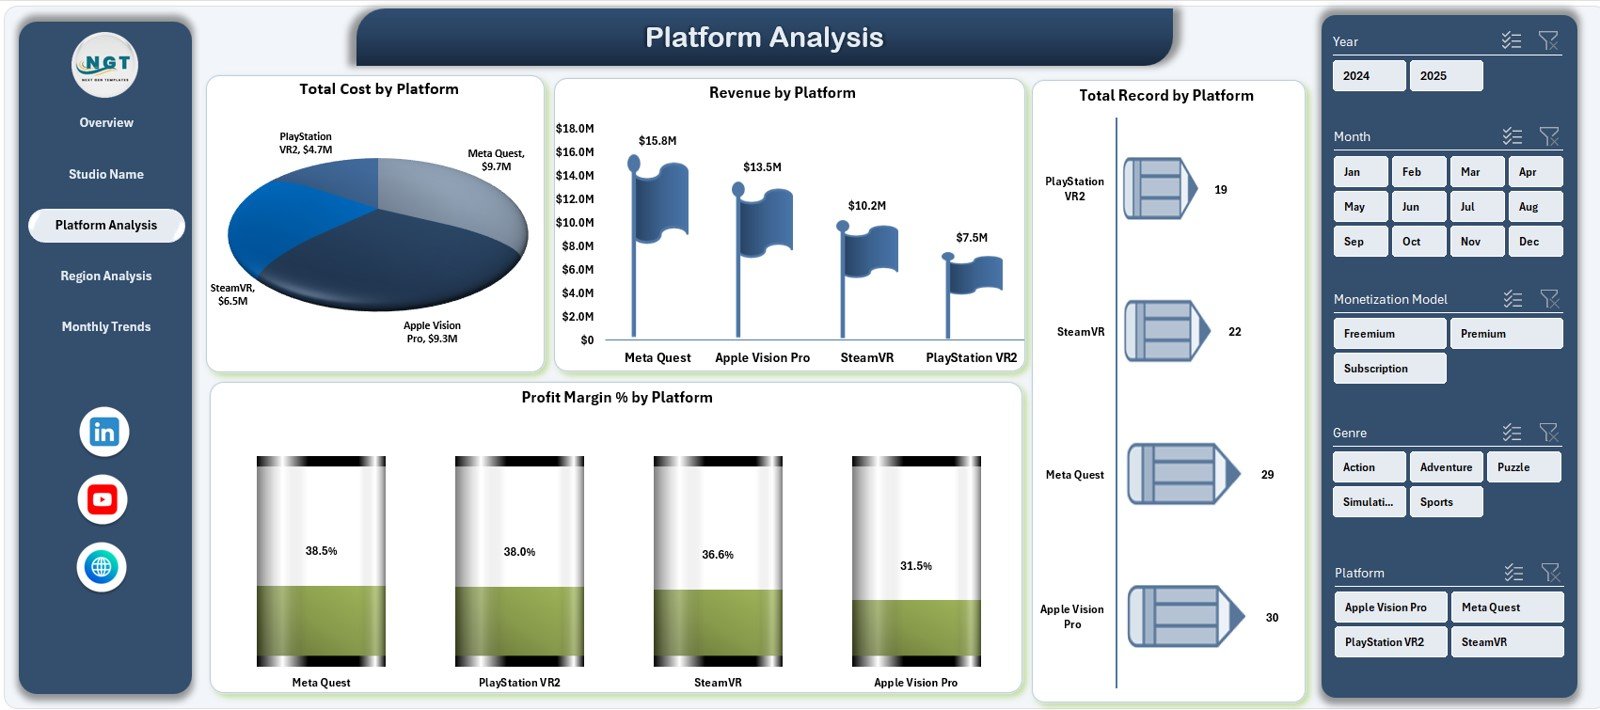
AR/VR games run on multiple platforms such as PC VR, console VR, mobile AR, and standalone headsets. Therefore, platform-level insights matter greatly.
Charts on the Platform Analysis Page
This page includes four charts:
-
Total Cost by Platform
-
Revenue by Platform
-
Total Records by Platform
-
Profit Margin % by Platform
Using these visuals, teams can easily decide where to invest more and which platforms need optimization.
4. Region Analysis: Where Are Players Most Active?
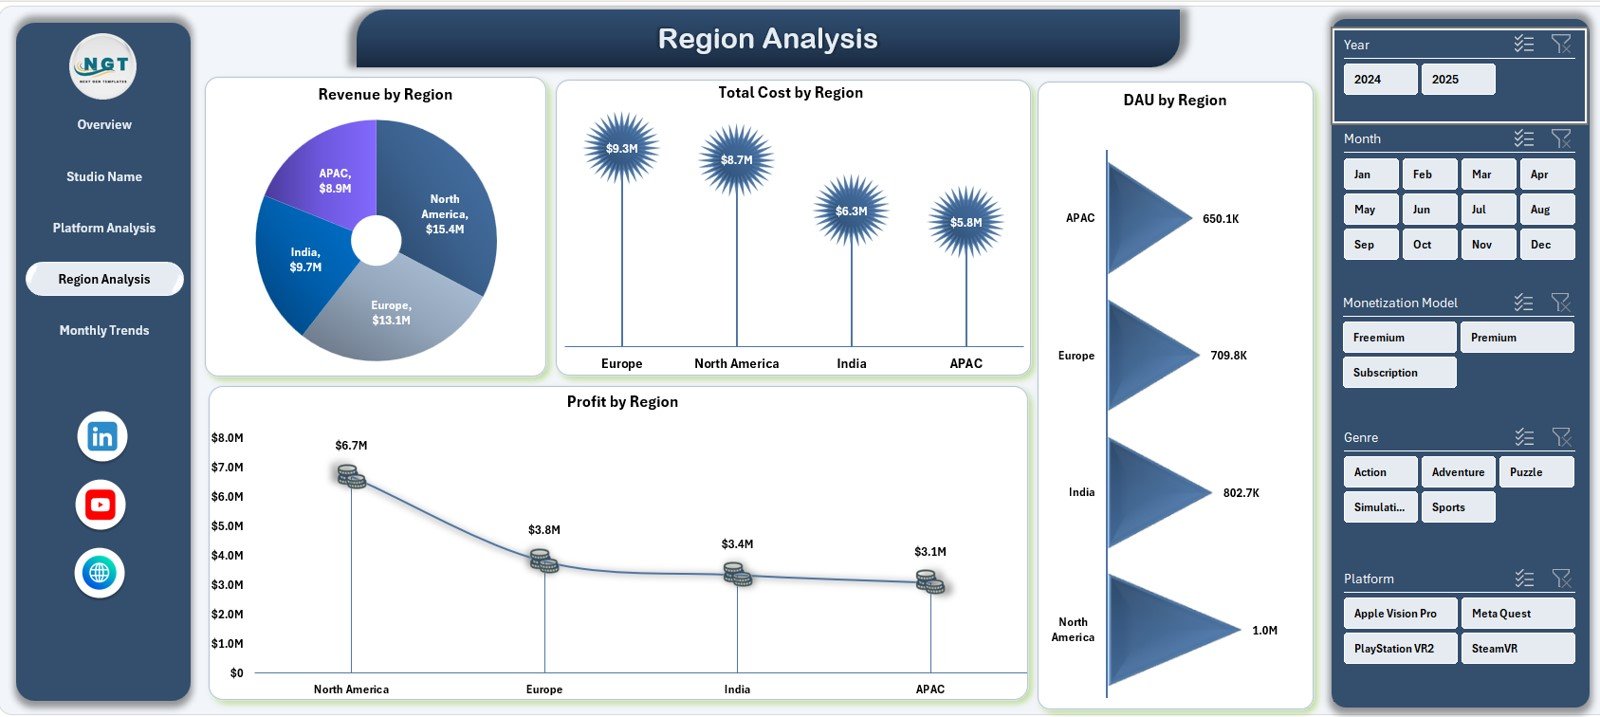
User behavior differs significantly across regions. Hence, the Region Analysis Page provides region-wise insights.
Charts on the Region Analysis Page
This page includes four charts:
-
Revenue by Region
-
Total Cost by Region
-
DAU by Region
-
Profit by Region
Consequently, studios can identify high-growth regions, control regional costs, and optimize localization strategies.
5. Monthly Trends: How Does Performance Change Over Time?
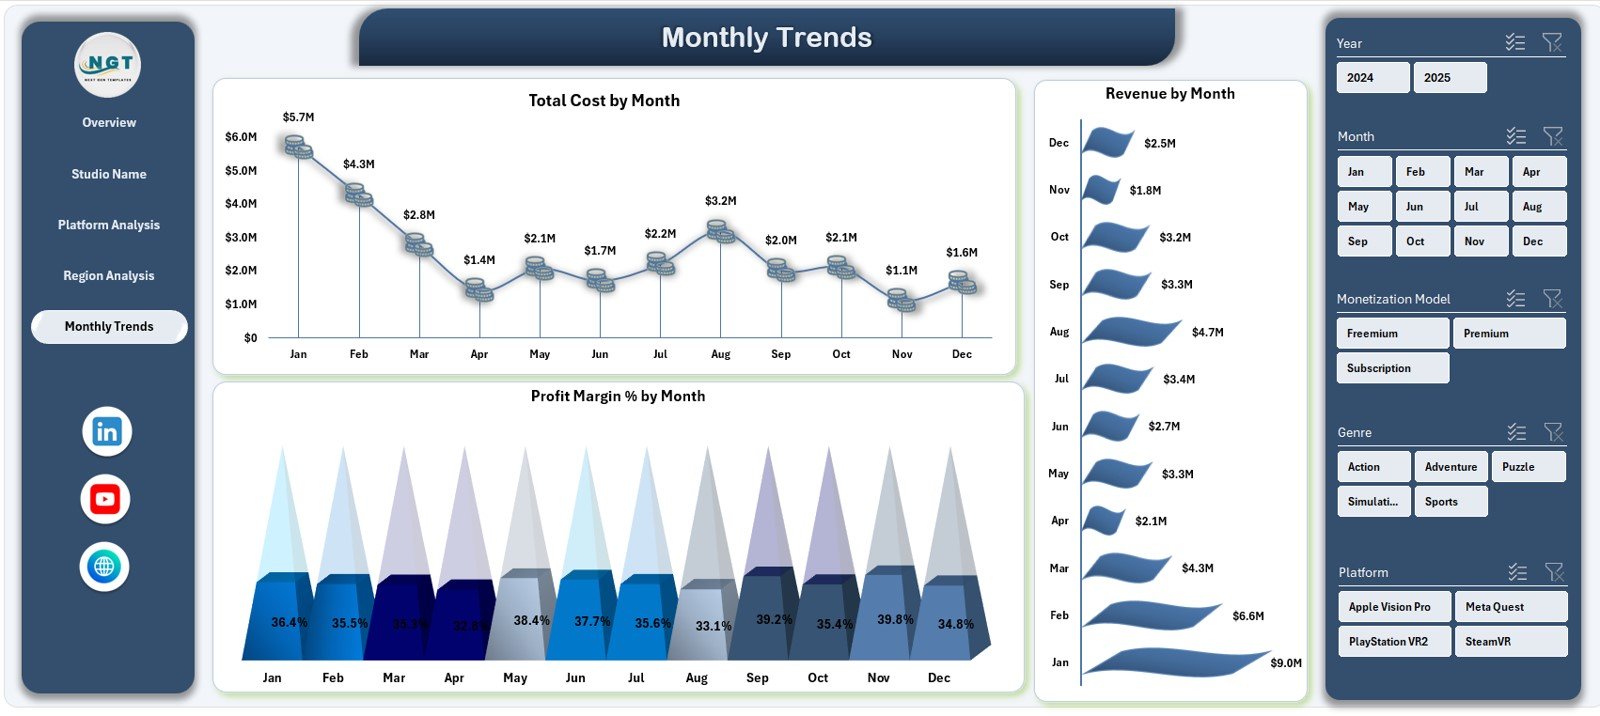
Trends matter more than static numbers. Therefore, the Monthly Trends Page tracks performance over time.
Charts on the Monthly Trends Page
This page includes three trend charts:
-
Total Cost by Month
-
Revenue by Month
-
Profit Margin % by Month
These charts help teams identify seasonality, launch impact, and long-term growth patterns.
Advantages of AR/VR Gaming Studios Dashboard in Excel
Using an AR/VR Gaming Studios Dashboard in Excel offers multiple benefits.
1. Centralized Performance Tracking
The dashboard consolidates all critical metrics into one file. As a result, teams avoid confusion and save time.
2. Cost and Profit Visibility
Studios can track costs, revenue, and profit margins clearly. Therefore, financial decisions become data-driven.
3. User Engagement Insights
By tracking DAU and MAU, studios understand player behavior better and improve retention strategies.
4. Platform and Region Comparison
The dashboard makes it easy to compare platforms and regions side by side, leading to smarter investments.
5. No Expensive BI Tools Required
Since the dashboard runs in Excel, studios avoid high software costs while still gaining powerful analytics.
Best Practices for the AR/VR Gaming Studios Dashboard in Excel
To get the maximum value from the dashboard, studios should follow these best practices.
Maintain Clean and Consistent Data
Always use consistent naming for studios, platforms, and regions. Clean data ensures accurate insights.
Update Data Regularly
Update the data sheet weekly or monthly. Regular updates keep trends meaningful and relevant.
Use Slicers for Focused Analysis
Instead of viewing all data at once, use slicers to analyze specific studios, platforms, or regions.
Monitor Trends, Not Just Totals
Focus on monthly trends and changes over time. Trends often reveal issues before totals do.
Review KPI Cards First
Start analysis with KPI cards, then drill down into charts. This approach saves time and improves clarity.
Click to Purchases AR/VR Gaming Studios Dashboard in Excel
Who Can Use an AR/VR Gaming Studios Dashboard in Excel?
This dashboard suits a wide range of users, including:
-
AR/VR gaming studio owners
-
Finance and accounting teams
-
Product and platform managers
-
Business analysts
-
Strategy and growth teams
-
Investors and stakeholders
Because the dashboard uses Excel, even non-technical users can work with it confidently.
How Does This Dashboard Support Better Decision-Making?
Better decisions require better visibility. This dashboard supports decision-making by:
-
Highlighting profitable genres and platforms
-
Identifying cost-heavy studios early
-
Revealing regional growth opportunities
-
Tracking performance trends consistently
As a result, studios move from reactive decisions to proactive strategies.
Conclusion: Is the AR/VR Gaming Studios Dashboard in Excel Worth It?
Absolutely.
The AR/VR Gaming Studios Dashboard in Excel provides a clear, structured, and practical way to track financial performance, user engagement, and growth trends. It replaces scattered spreadsheets with one powerful analytics tool.
Moreover, it saves time, improves clarity, and supports smarter decisions without complex systems. For any AR/VR gaming studio aiming for sustainable growth, this dashboard becomes an essential management asset.
Frequently Asked Questions About AR/VR Gaming Studios Dashboard in Excel
What is an AR/VR Gaming Studios Dashboard in Excel used for?
It tracks costs, revenue, profit, user engagement, platform performance, regional trends, and monthly growth in one Excel file.
Do I need advanced Excel skills to use this dashboard?
No. The dashboard is ready to use and designed for both technical and non-technical users.
Can I customize the dashboard?
Yes. Users can add metrics, charts, or modify layouts based on studio needs.
How often should I update the data?
You should update data weekly or monthly for accurate trend analysis.
Does this dashboard support multiple studios?
Yes. The Studio Name Analysis page allows easy comparison across multiple studios.
Can small AR/VR studios use this dashboard?
Yes. Both small and large studios can benefit from this dashboard structure.
Click to Purchases AR/VR Gaming Studios Dashboard in Excel
Visit our YouTube channel to learn step-by-step video tutorials