In today’s legal and corporate environment, organizations handle a growing number of disputes related to contracts, commercial agreements, financial claims, and regulatory matters. Because disputes directly impact business relationships, financial outcomes, and operational stability, companies must track dispute resolution processes carefully.
However, many legal teams still rely on scattered spreadsheets, emails, and manual reports to monitor arbitration and mediation cases. As a result, decision-makers struggle to analyze case progress, settlement outcomes, hearing durations, and financial implications in real time.
Therefore, organizations increasingly adopt data-driven dashboards to transform complex legal case data into clear and actionable insights. One powerful solution is the Arbitration and Mediation Dashboard in Power BI.
Click to Purchases Arbitration and Mediation Dashboard in Power BI
The Arbitration and Mediation Dashboard in Power BI helps legal departments, arbitration centers, law firms, and compliance teams monitor dispute resolution cases, analyze settlement trends, evaluate hearing durations, and track financial outcomes using interactive visual reports.
Moreover, this dashboard centralizes dispute data and converts it into easy-to-understand charts, KPIs, and filters. As a result, legal professionals can quickly understand case performance and make informed decisions.
In this article, you will learn everything about the Arbitration and Mediation Dashboard in Power BI, including its structure, key features, advantages, best practices, and frequently asked questions.
What Is an Arbitration and Mediation Dashboard in Power BI?
An Arbitration and Mediation Dashboard in Power BI is an interactive analytical report created using Microsoft Power BI that helps organizations track dispute resolution cases.
The dashboard collects and analyzes dispute data such as:
-
Case ID
-
Claim amount
-
Settlement amount
-
Case type
-
Dispute category
-
Resolution method (arbitration or mediation)
-
Hearing duration
-
Case priority
-
Case status
-
Region or jurisdiction
Because Power BI transforms raw data into visual reports, legal teams can quickly monitor dispute performance, evaluate settlement trends, and analyze case outcomes.
Furthermore, the dashboard allows users to apply filters and slicers to explore data by case type, jurisdiction, claimant type, or time period. Consequently, legal professionals gain deeper insights into dispute resolution performance.
Why Do Organizations Need an Arbitration and Mediation Dashboard?
Legal disputes involve complex processes, multiple stakeholders, and significant financial implications. Therefore, organizations need a centralized system to track and analyze dispute data effectively.
Without a proper dashboard, legal teams may face several challenges:
-
Difficulty tracking ongoing cases
-
Limited visibility into settlement outcomes
-
Lack of financial dispute analysis
-
Slow reporting and decision-making
-
Poor monitoring of hearing durations
However, a Power BI dashboard solves these challenges by providing real-time visual insights.
As a result, organizations can manage disputes more efficiently and improve legal strategy.
Key Features of the Arbitration and Mediation Dashboard in Power BI
This dashboard includes five interactive pages designed to provide complete visibility into arbitration and mediation performance.
Each page focuses on a specific analytical area.
Click to Purchases Arbitration and Mediation Dashboard in Power BI
1. Overview Page
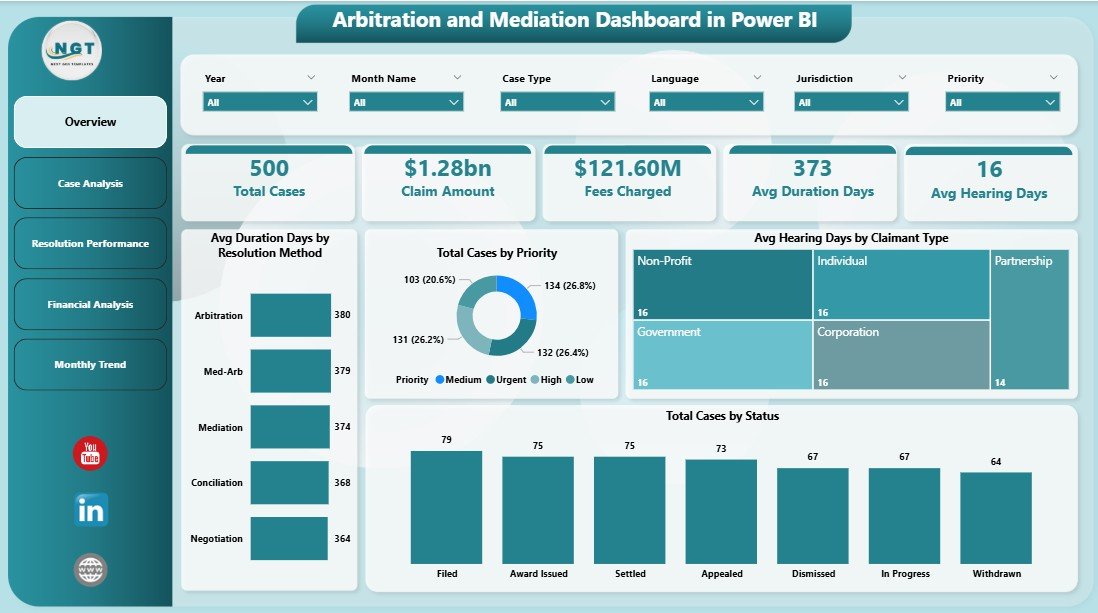
The Overview Page serves as the main summary page of the dashboard.
This page provides a high-level view of dispute resolution performance.
Users can quickly understand the overall case status, hearing durations, and resolution performance.
KPI Cards Available on This Page
The dashboard displays the following key performance indicators:
-
Average Duration Days by Resolution Method
-
Total Cases by Priority
-
Average Hearing Days by Claim Type
-
Total Cases by Status
These KPI cards provide instant insights into dispute resolution efficiency.
Interactive Slicers
Users can filter the dashboard using slicers such as:
-
Case type
-
Resolution method
-
Claim type
-
Region
-
Month
Because of these filters, users can analyze dispute data from different perspectives.
2. Case Analysis Dashboard
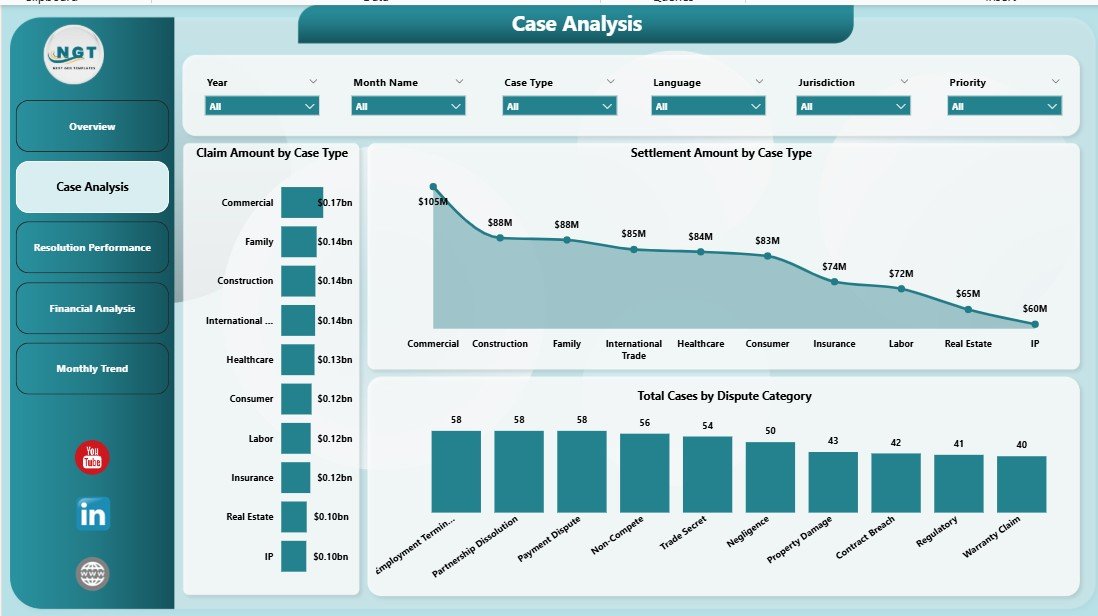
The Case Analysis Page provides deeper insights into dispute case structures and financial claims.
Legal professionals can analyze how different case types impact claim amounts and settlements.
Charts Included
This page includes the following charts:
-
Claim Amount by Case Type
-
Settlement Amount by Case Type
-
Total Cases by Dispute Category
These charts help legal teams identify which types of disputes generate higher claim amounts and settlement values.
Consequently, organizations can improve legal strategies and dispute management processes.
3. Resolution Performance Dashboard
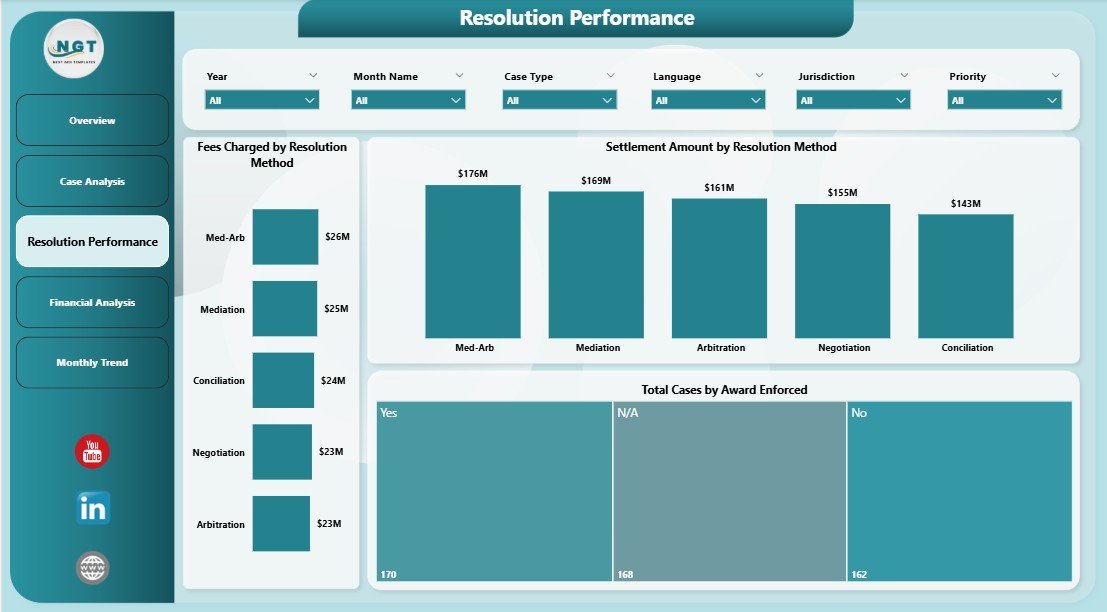
The Resolution Performance Page focuses on evaluating dispute resolution outcomes.
Because arbitration and mediation have different cost structures and success rates, organizations must analyze resolution performance carefully.
Charts Included
This page contains the following visual reports:
-
Fees Charged by Resolution Method
-
Settlement Amount by Resolution Method
-
Total Cases by Award Enforced
These visuals help organizations understand how effectively disputes get resolved through arbitration or mediation.
Furthermore, decision-makers can evaluate which resolution method delivers better financial outcomes.
4. Financial Analysis Dashboard
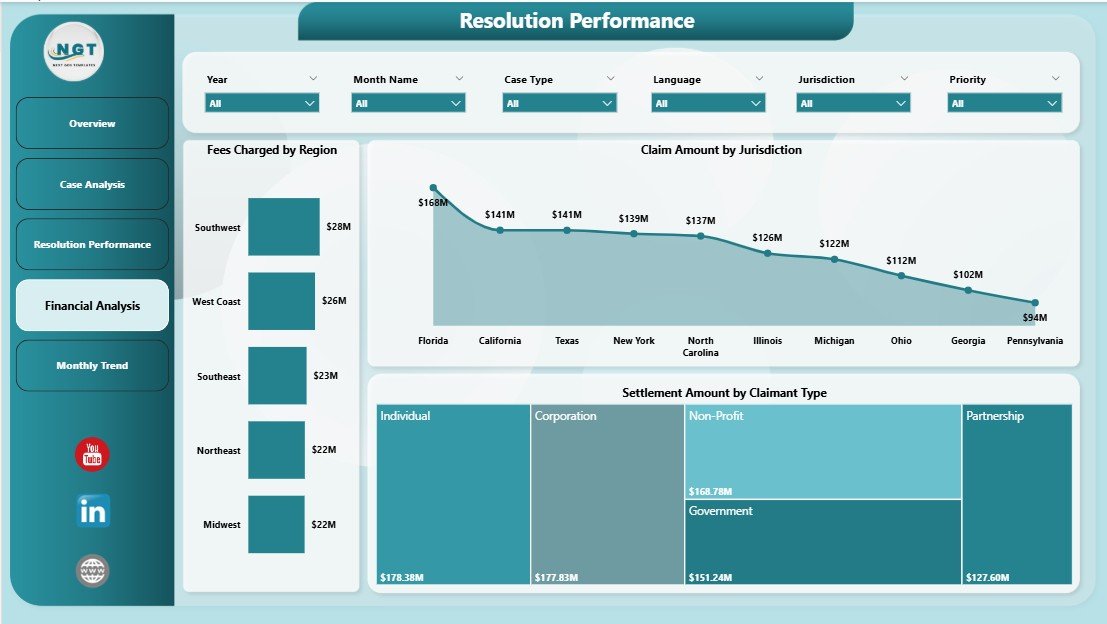
The Financial Analysis Page focuses on the monetary aspects of dispute resolution.
Because legal disputes often involve large claim amounts and settlement values, financial visibility becomes essential.
Charts Included
This page includes the following financial analytics charts:
-
Fees Charged by Region
-
Settlement Amount by Claimant Type
-
Claim Amount by Jurisdiction
These insights help organizations understand regional dispute trends and financial exposure.
As a result, legal teams can better plan dispute resolution strategies.
Click to Purchases Arbitration and Mediation Dashboard in Power BI
5. Monthly Analysis Dashboard
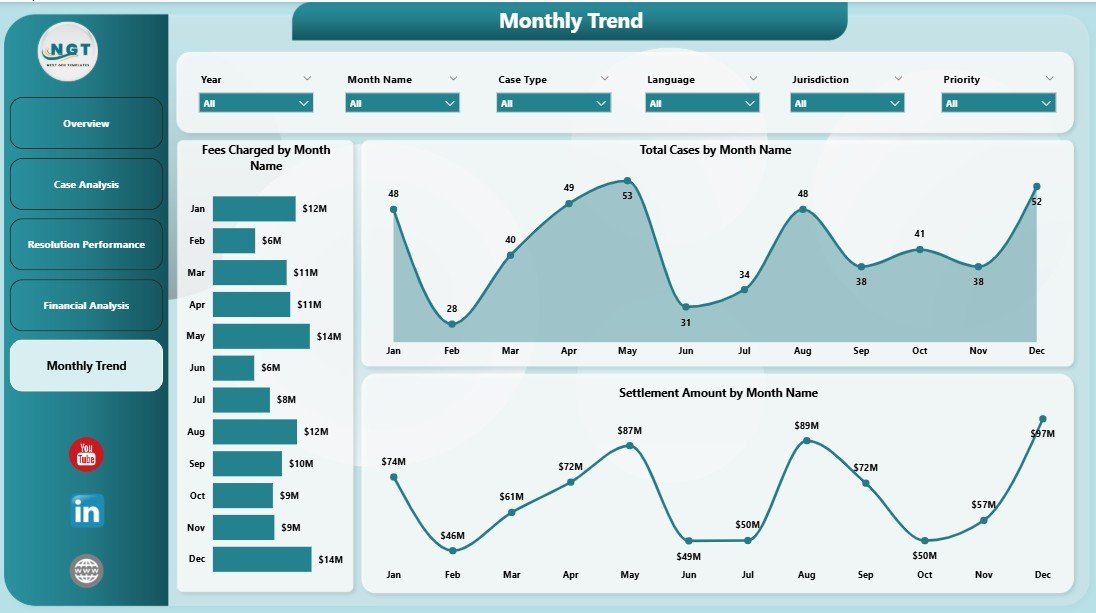
The Monthly Analysis Page tracks dispute resolution trends over time.
Because legal cases often take months to resolve, monthly analysis becomes important for monitoring progress.
Charts Included
This page includes:
-
Fees Charged by Month
-
Settlement Amount by Month
-
Claim Amount by Month
These charts allow users to analyze financial dispute trends across different months.
Consequently, organizations can identify seasonal patterns in dispute resolution activities.
Advantages of the Arbitration and Mediation Dashboard in Power BI
Using a Power BI arbitration dashboard offers several benefits for legal teams and dispute resolution professionals.
1. Centralized Case Monitoring
The dashboard centralizes dispute data in one system.
Therefore, legal teams no longer need to review multiple spreadsheets or reports.
2. Faster Decision-Making
Interactive visuals allow decision-makers to quickly understand case performance.
As a result, organizations can make faster legal decisions.
3. Better Financial Visibility
The dashboard provides insights into claim amounts, settlement values, and resolution fees.
Consequently, legal teams gain better control over financial risk.
4. Improved Dispute Strategy
By analyzing dispute trends and case types, organizations can refine their legal strategies.
5. Real-Time Insights
Power BI allows dashboards to update automatically when new data is added.
Therefore, decision-makers always work with the latest information.
Opportunities for Improvement in Arbitration and Mediation Analytics
Although dashboards provide powerful insights, organizations can further improve their dispute analytics.
Add Predictive Analytics
Organizations can use predictive models to estimate case outcomes.
Integrate Case Management Systems
Connecting the dashboard with legal case management software improves automation.
Use Advanced KPIs
Additional KPIs such as settlement success rate and case closure time can enhance analysis.
Automate Data Updates
Automated data refresh improves reporting efficiency.
Best Practices for the Arbitration and Mediation Dashboard
To get maximum value from the dashboard, organizations should follow certain best practices.
Maintain Clean Data
Ensure dispute data remains accurate and consistent.
Use Standard Case Categories
Standardizing dispute categories improves reporting accuracy.
Update Data Regularly
Regular updates ensure the dashboard reflects current case progress.
Focus on Key Legal Metrics
Prioritize metrics such as settlement value, hearing duration, and claim amounts.
Train Legal Teams
Legal professionals should understand how to interpret dashboard insights.
Click to Purchases Arbitration and Mediation Dashboard in Power BI
How Does Power BI Improve Legal Analytics?
Power BI transforms traditional legal reporting into a modern analytics system.
Key capabilities include:
-
Interactive visual dashboards
-
Real-time data updates
-
Advanced filtering and drill-down analysis
-
Automated reporting
-
Data integration from multiple sources
Because of these features, Power BI enables legal teams to monitor disputes more effectively.
Who Can Benefit from the Arbitration and Mediation Dashboard?
Several professionals and organizations can benefit from this dashboard.
Law Firms
Law firms can monitor client disputes and settlement performance.
Arbitration Centers
Arbitration institutions can track case workloads and resolution efficiency.
Corporate Legal Teams
Companies can analyze internal dispute management performance.
Government Legal Departments
Government agencies can monitor regulatory disputes and legal claims.
Compliance Teams
Compliance officers can evaluate dispute trends and risk exposure.
Conclusion
Managing arbitration and mediation cases requires careful monitoring of case details, financial outcomes, and resolution performance. However, traditional reporting methods often make it difficult to gain clear insights into dispute resolution processes.
The Arbitration and Mediation Dashboard in Power BI solves this challenge by transforming complex legal data into interactive visual insights.
With features such as case analysis, financial monitoring, resolution performance tracking, and monthly trend analysis, the dashboard provides a comprehensive view of dispute resolution activities.
As a result, legal teams can improve decision-making, reduce reporting time, and enhance dispute management strategies.
Organizations that adopt data-driven legal analytics gain a competitive advantage by resolving disputes more efficiently and managing legal risks effectively.
Frequently Asked Questions (FAQs)
What is an arbitration and mediation dashboard?
An arbitration and mediation dashboard is a data visualization system that tracks dispute resolution cases, settlement values, claim amounts, and case performance using interactive charts.
Why should legal teams use Power BI dashboards?
Legal teams should use Power BI dashboards because they provide real-time insights, automated reporting, and interactive analytics for dispute resolution management.
What data is required for this dashboard?
Typical data includes:
-
Case ID
-
Claim amount
-
Settlement amount
-
Case type
-
Resolution method
-
Hearing duration
-
Case priority
-
Case status
Can this dashboard track financial dispute outcomes?
Yes. The dashboard analyzes claim amounts, settlement values, and fees charged across different regions and resolution methods.
Is the dashboard suitable for law firms?
Yes. Law firms can use this dashboard to monitor client disputes, track settlements, and analyze arbitration outcomes.
How often should the dashboard data be updated?
Organizations should update dispute data regularly, preferably daily or weekly, to ensure accurate insights.
Visit our YouTube channel to learn step-by-step video tutorials