In today’s fast-growing art industry, data plays a powerful role in decision-making. Art galleries no longer rely only on creativity—they also depend on insights, numbers, and performance tracking. Therefore, having a structured and interactive tool becomes essential.
That is exactly where the Art Galleries Dashboard in Excel becomes a game-changer.
This ready-to-use dashboard helps gallery owners, curators, and art investors monitor sales, profit, buyer trends, and exhibition performance—all in one place. Moreover, it turns complex data into simple visuals, making it easier to take action quickly.
In this detailed guide, you will learn everything about the Art Galleries Dashboard in Excel, including its features, structure, advantages, best practices, and FAQs.
Click to buy Art Galleries Dashboard in Excel
What is an Art Galleries Dashboard in Excel?
An Art Galleries Dashboard in Excel is a powerful reporting tool that helps you track and analyze gallery performance using visual charts, KPIs, and data tables.
Instead of using multiple spreadsheets, you can manage everything in one centralized dashboard. As a result, you save time, reduce errors, and improve decision-making.
This dashboard typically tracks:
- Total Sales Performance
- Selling Price Trends
- Profit & Commission
- Art Category Performance
- Buyer & Market Insights
- Monthly Trends
Because of these features, it becomes an essential tool for modern art businesses.
Why Do Art Galleries Need a Dashboard?
Managing an art gallery involves multiple moving parts. You must track artists, buyers, exhibitions, pricing, and commissions at the same time.
However, without a dashboard:
- Data stays scattered
- Reports become slow
- Decisions get delayed
On the other hand, when you use an Excel dashboard:
- You get real-time insights
- You can compare performance easily
- You can identify trends quickly
Therefore, dashboards help you stay ahead in a competitive art market.
Key Features of the Art Galleries Dashboard in Excel
Let’s explore the main components of this dashboard. Each sheet plays a unique role in analyzing your data.
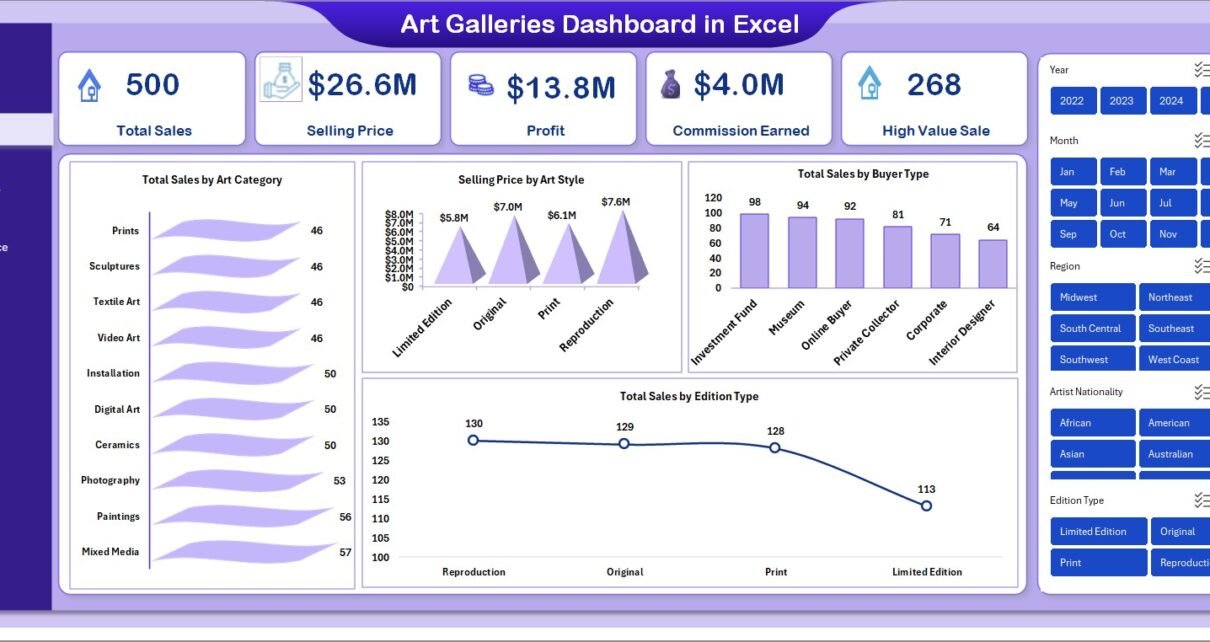
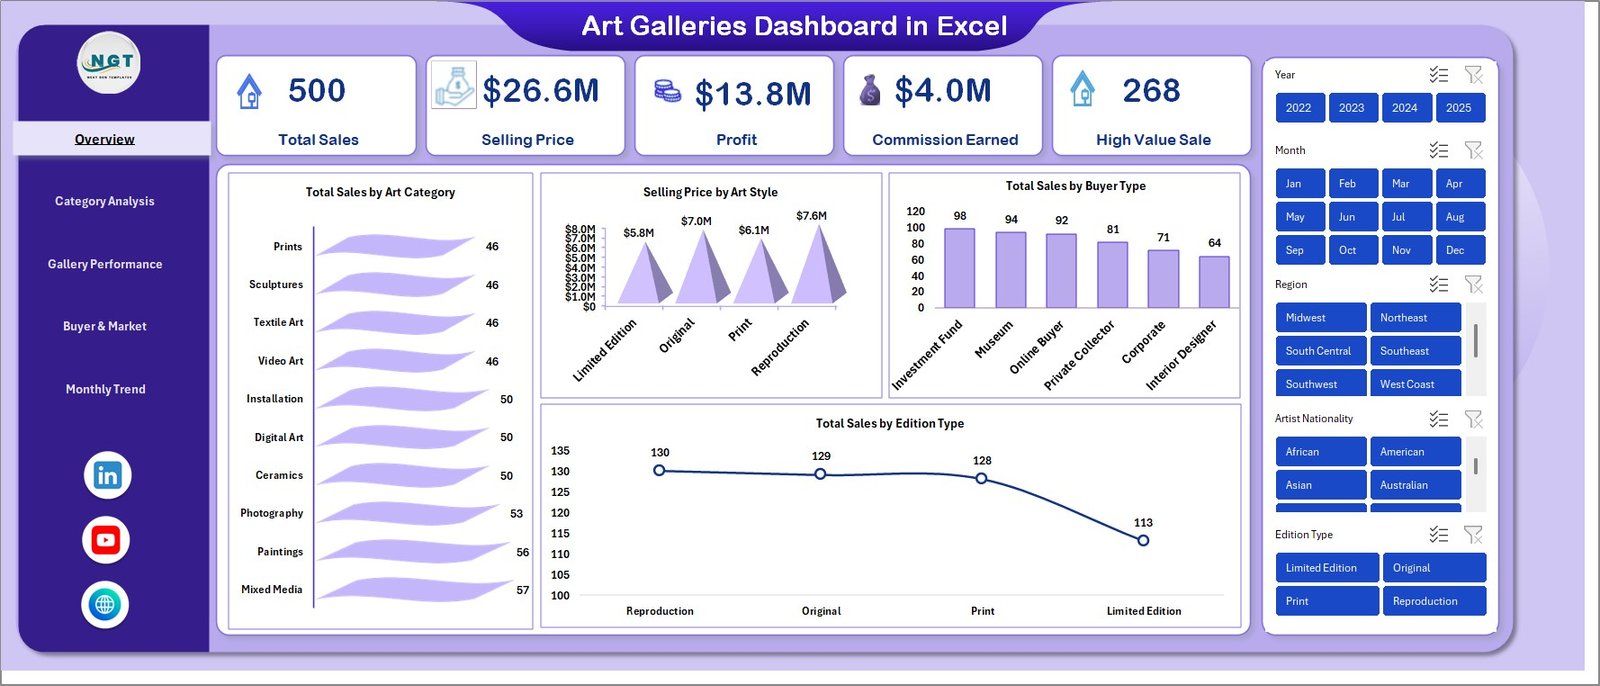
Overview Sheet – Your Complete Business Snapshot
The Overview Sheet gives you a high-level summary of your gallery performance. It helps you understand key metrics instantly.
KPI Cards Included:
- Total Sales
- Selling Price
- Profit
- Commission Earned
- High Value Sale
Charts Available:
- Total Sales by Art Category
- Selling Price by Art Style
- Total Sales by Buyer Type
- Total Sales by Edition Type
Because of this, you can quickly identify which art categories and styles perform best.
Click to buy Art Galleries Dashboard in Excel
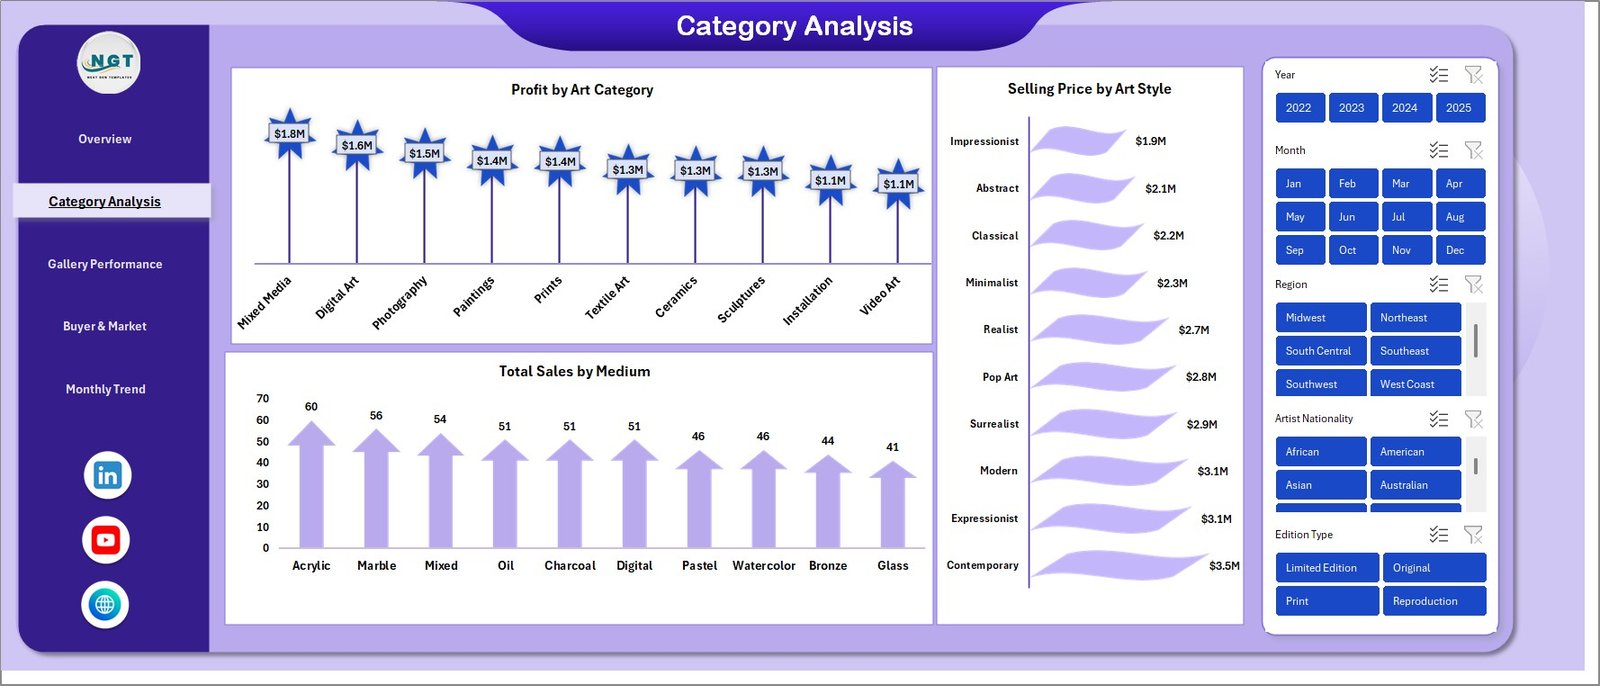
Category Analysis – Which Art Type Performs Best4
The Category Analysis Sheet helps you break down performance by art characteristics.
Key Insights:
- Profit by Art Category
- Selling Price by Art Style
- Total Sales by Medium
For example, you can easily see whether paintings, sculptures, or digital art generate more profit.
Click to buy Art Galleries Dashboard in Excel
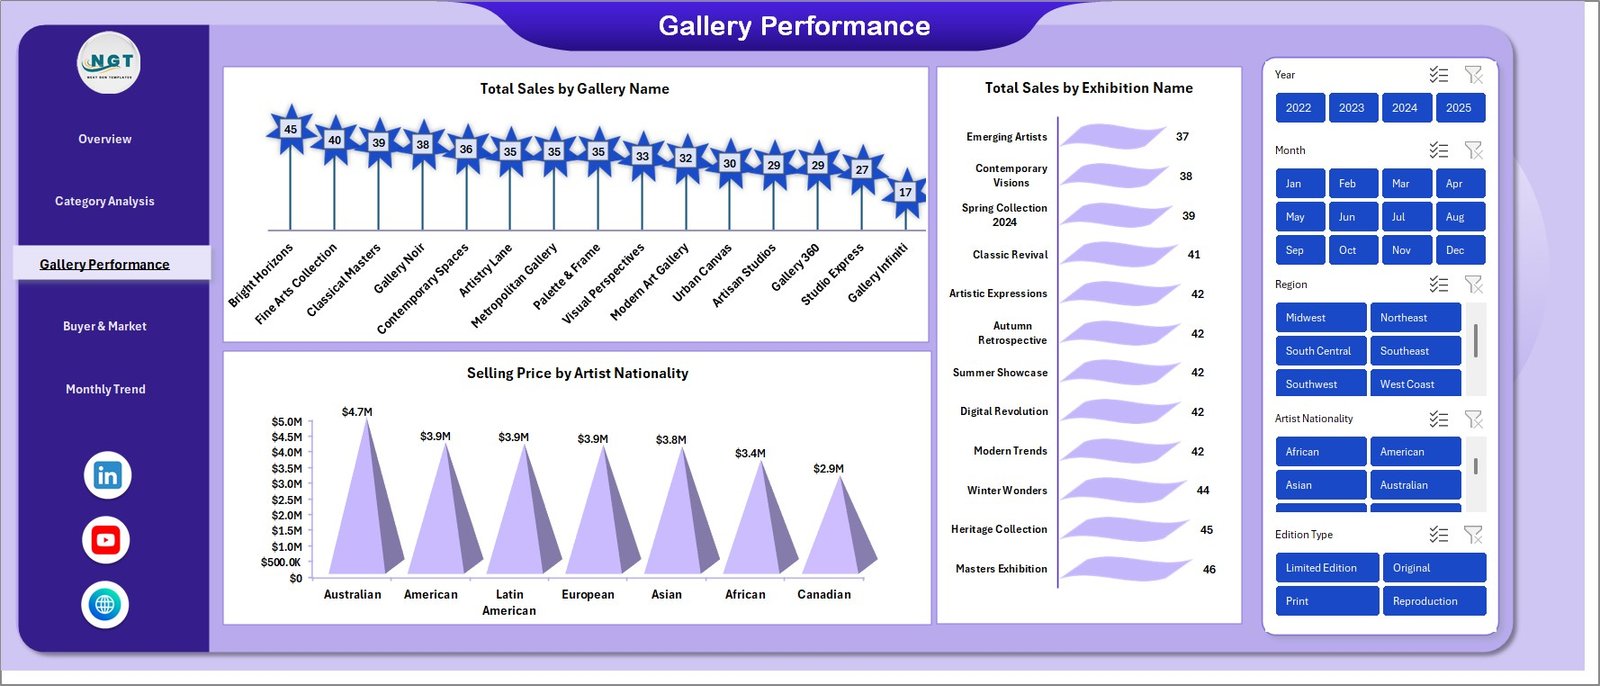
Gallery Performance – How Are Your Exhibitions Doing?
This sheet focuses on how individual galleries and exhibitions perform.
Key Metrics:
- Total Sales by Gallery Name
- Total Sales by Exhibition Name
- Selling Price by Artist Nationality
As a result, you can identify which exhibitions attract more buyers and which artists perform better.
Click to buy Art Galleries Dashboard in Excel
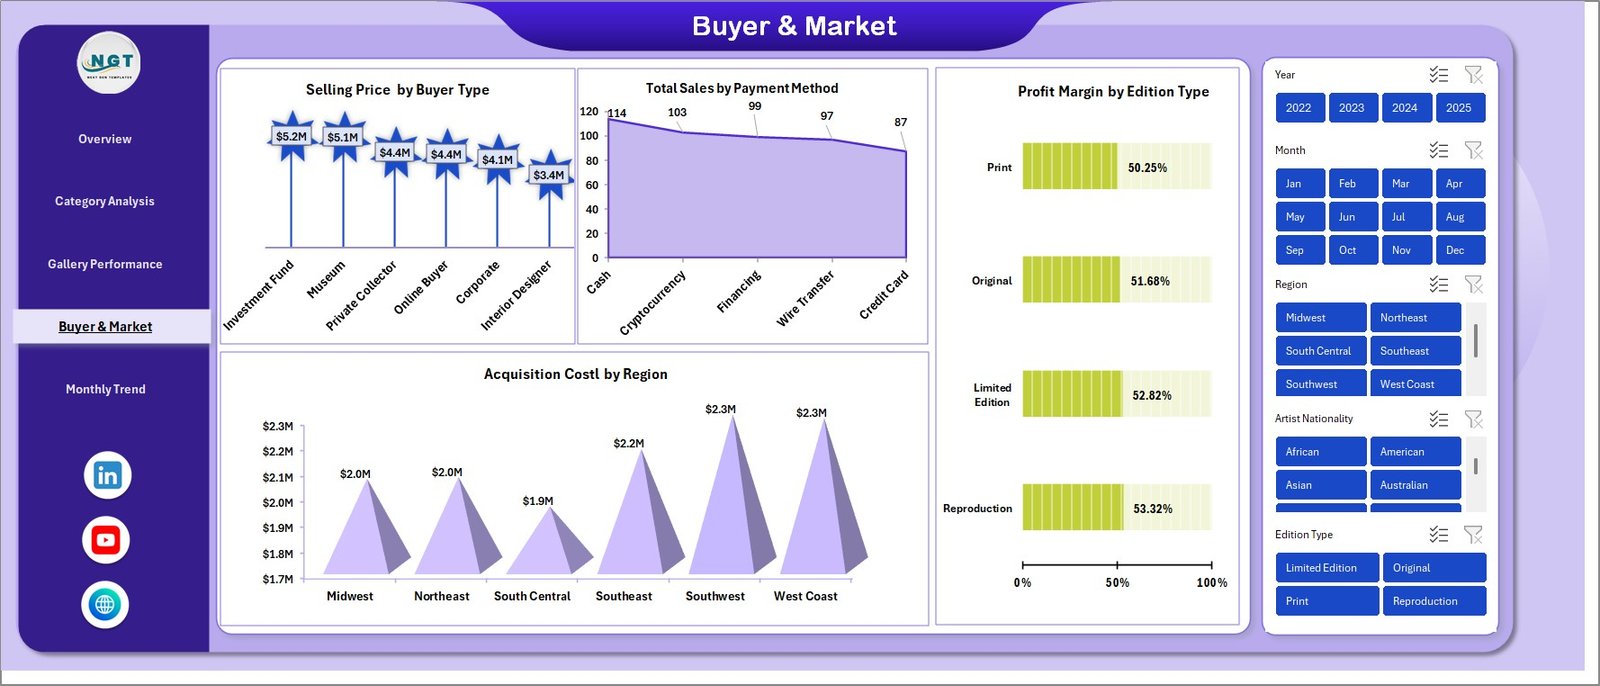
Buyer & Market Analysis – Understand Your Customers
Understanding your buyers helps you grow your business. Therefore, this sheet focuses on market insights.
Key Metrics:
- Selling Price by Buyer Type
- Total Sales by Payment Method
- Acquisition Cost by Region
- Profit Margin by Edition Type
This helps you understand buyer preferences and optimize pricing strategies.
Click to buy Art Galleries Dashboard in Excel
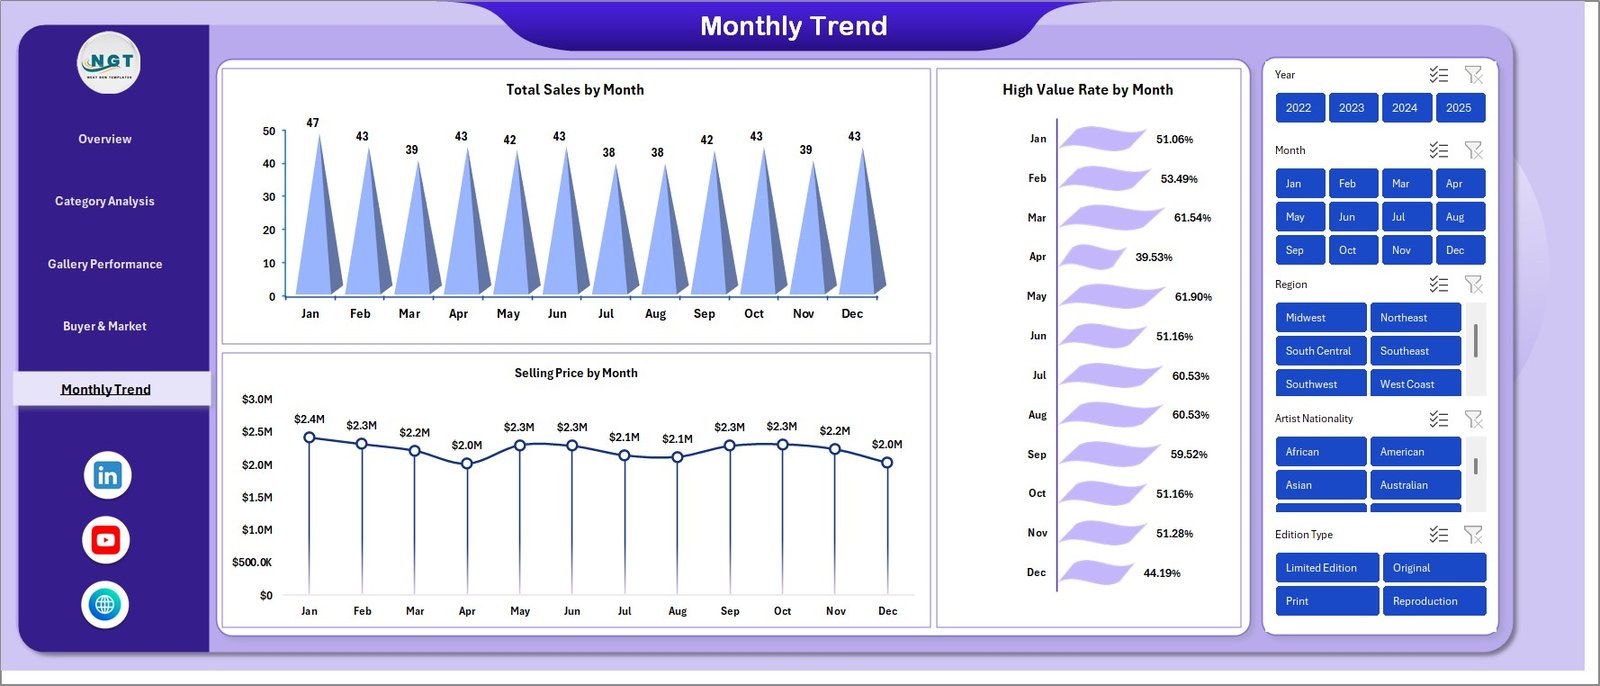
Monthly Trends – Track Performance Over Time
The Monthly Trends Sheet allows you to analyze performance over time.
Key Metrics:
- Total Sales by Month
- Selling Price by Month
- High Value Rate by Month
Therefore, you can identify seasonal trends and plan future exhibitions effectively.
Click to buy Art Galleries Dashboard in Excel
How Does the Art Galleries Dashboard Work?
The dashboard works in a simple and structured way:
- Enter your data into the input sheet
- Excel processes the data automatically
- Charts and KPIs update instantly
- Use filters to analyze specific segments
Because of this automation, you do not need advanced Excel skills.
Advantages of Art Galleries Dashboard in Excel
Using this dashboard provides multiple benefits. Let’s explore them:
Better Decision-Making
- You can analyze data quickly
- You can make informed decisions
- You can reduce guesswork
Time Saving
- No need for manual reports
- Automatic calculations
- Instant insights
Improved Sales Strategy
- Identify high-performing categories
- Focus on profitable art styles
- Optimize pricing
Enhanced Buyer Understanding
- Track buyer behavior
- Analyze payment methods
- Improve targeting
Easy to Use
- Simple interface
- No coding required
- Fully interactive
Best Practices for the Art Galleries Dashboard in Excel
To get the best results, you should follow these best practices:
Keep Data Clean
- Always enter accurate data
- Avoid duplicates
- Maintain consistent formats
Update Regularly
- Update data weekly or monthly
- Keep information current
- Track recent trends
Use Filters Smartly
- Analyze by category
- Compare galleries
- Focus on specific time periods
Monitor KPIs Frequently
- Check profit regularly
- Track high-value sales
- Watch commission trends
Customize When Needed
- Add new KPIs
- Adjust charts
- Modify layouts
How Can This Dashboard Improve Your Art Business?
This dashboard does more than just display numbers. It transforms how you run your gallery.
Key Improvements:
- Better exhibition planning
- Smarter pricing decisions
- Stronger buyer engagement
- Increased profitability
Who Can Benefit from This Dashboard?
This dashboard suits many professionals in the art industry:
- Art Gallery Owners
- Curators
- Art Dealers
- Investo
- Museum Managers
Because of its flexibility, anyone managing art sales can use it effectively.
Future of Art Analytics with Excel Dashboards
The art industry continues to evolve. Therefore, data analytics becomes even more important.
In the future:
- Galleries will rely more on dashboards
- Data-driven decisions will dominate
- Automation will increase
As a result, tools like this dashboard will become essential for success.
Conclusion
The Art Galleries Dashboard in Excel offers a complete solution to manage, analyze, and grow your art business.
It simplifies complex data, improves decision-making, and saves time. Moreover, it provides valuable insights into sales, buyers, and performance.
If you want to take your gallery to the next level, this dashboard is the perfect tool.
Frequently Asked Questions (FAQs)
What is an Art Galleries Dashboard in Excel?
It is a tool that helps track and analyze art gallery performance using charts, KPIs, and data tables.
Can beginners use this dashboard?
Yes, beginners can easily use it because it requires no advanced Excel skills.
What data do I need for this dashboard?
You need sales data, buyer details, art categories, pricing, and exhibition information.
Can I customize the dashboard?
Yes, you can modify charts, KPIs, and layouts based on your needs.
How often should I update the dashboard?
You should update it regularly, preferably weekly or monthly.
Does this dashboard help increase sales?
Yes, because it provides insights that help improve pricing, marketing, and decision-making.
Is this dashboard suitable for multiple galleries?
Yes, it can track performance across multiple galleries and exhibitions.
Click to buy Art Galleries Dashboard in Excel
Visit our YouTube channel to learn step-by-step video tutorials
Watch the step-by-step video tutorial: