Artificial Intelligence has transformed how organizations operate, make decisions, and deliver services. Today, businesses rely on AI systems for automation, analytics, customer support, forecasting, and intelligent decision-making. However, managing AI performance without proper monitoring creates confusion, inefficiency, and rising operational costs.
Therefore, organizations increasingly adopt structured analytics dashboards to track AI performance in real time. One powerful solution is the Artificial Intelligence (AI) Dashboard in Power BI — an interactive reporting system designed to monitor AI tasks, model efficiency, cost performance, latency, throughput, and user satisfaction in one centralized platform.
In this comprehensive guide, you will learn everything about the Artificial Intelligence (AI) Dashboard in Power BI, including its structure, features, benefits, analysis capabilities, best practices, and frequently asked questions. Moreover, you will understand how this dashboard helps organizations transform AI operations into measurable and optimized business outcomes.
Click to buy Artificial Intelligence (AI) Dashboard in Power BI
What Is an Artificial InteArtificial Intelligence (AI) Dashboard in Power BIlligence (AI) Dashboard in Power BI?
An Artificial Intelligence Dashboard in Power BI is a data visualization and analytics solution that tracks the performance of AI systems using interactive charts, KPIs, and filters.
Instead of reviewing scattered reports or technical logs, decision-makers analyze AI performance through a single dashboard interface. As a result, teams quickly identify bottlenecks, monitor efficiency, control costs, and improve model accuracy.
This dashboard converts complex AI operational data into easy-to-understand visuals. Consequently, both technical and non-technical stakeholders gain clear insights into AI performance.
The dashboard helps organizations to:
- Monitor total AI tasks executed
- Track success and failure rates
- Measure latency and throughput
- Analyze AI model efficiency
- Control cost per AI task
- Evaluate regional performance
- Monitor monthly trends
Why Do Organizations Need an AI Dashboard?
Many companies deploy AI solutions successfully; however, they struggle to monitor performance consistently. Without analytics visibility, organizations cannot measure whether AI systems actually deliver value.
For example:
- AI models may process tasks slowly.
- Operational costs may increase unnoticed.
- Departments may experience higher failure rates.
- User satisfaction may decline over time.
Therefore, an AI dashboard becomes essential because it provides continuous performance monitoring.
Key challenges solved by the dashboard:
- Lack of centralized AI reporting
- Difficulty measuring AI ROI
- Poor visibility into model performance
- Delayed problem detection
- Inefficient resource allocation
As a result, businesses move from reactive management to proactive optimization.
Key Features of the Artificial Intelligence (AI) Dashboard in Power BI
The dashboard contains five interactive pages, each designed to analyze AI operations from a different perspective.
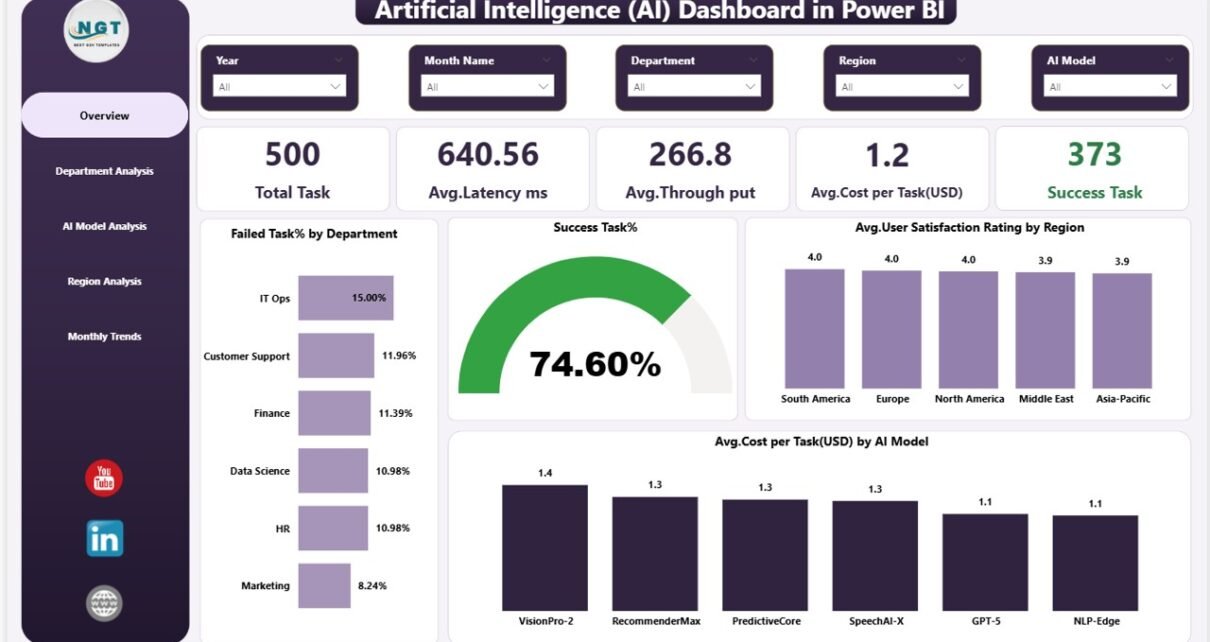
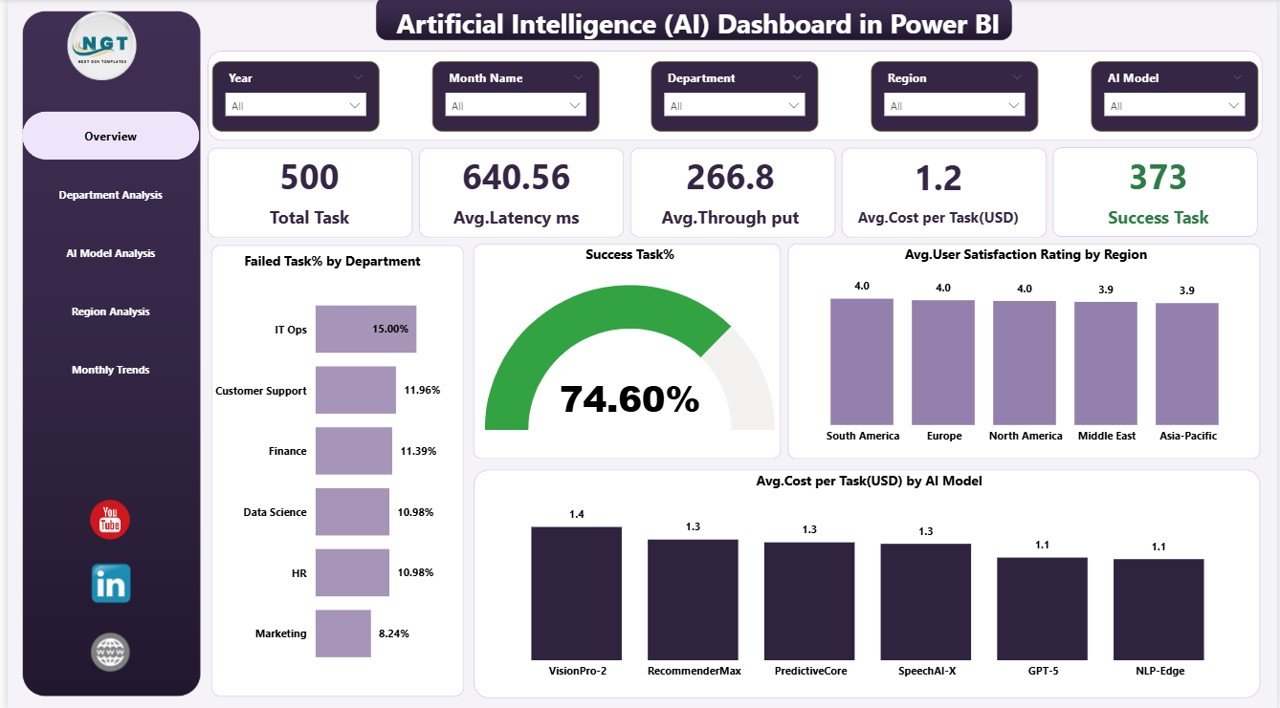
Overview Page – How Does the AI System Perform Overall?
The Overview Page acts as the main control center of the dashboard. It provides a high-level summary of AI performance metrics.
KPI Cards Available
- Total Tasks – Total AI tasks processed
- Average Latency (ms) – Response time measurement
- Average Throughput – Processing capacity
- Average Cost per Task (USD) – Operational expense indicator
- Successful Tasks – Completed AI operations
These KPIs allow managers to evaluate performance instantly.
Charts Included
- Failed Task % by Department
- Success Task %
- Average User Satisfaction Rating by Region
- Average Cost per Task (USD) by AI Model
Because all critical KPIs appear on one page, executives quickly understand system health.
Click to buy Artificial Intelligence (AI) Dashboard in Power BI
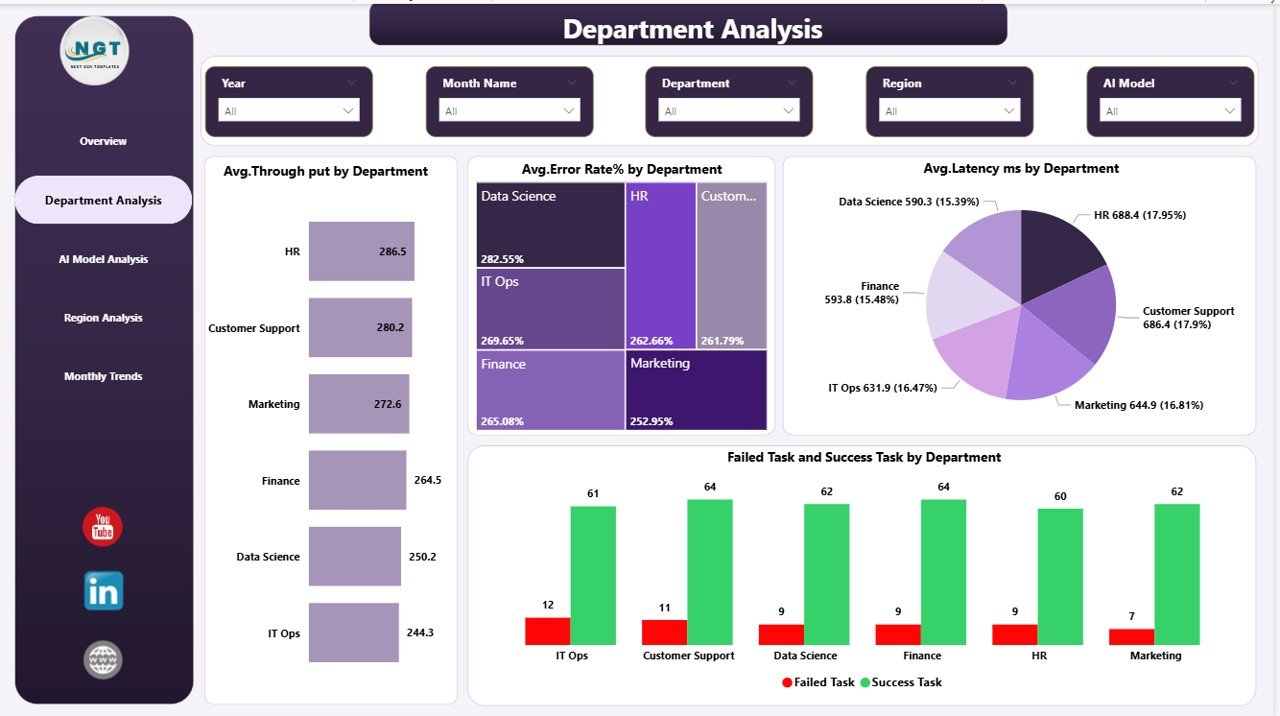
Department Analysis – Which Department Uses AI Most Efficiently?
The Department Analysis Page evaluates AI performance across organizational departments.
Charts Available
- Average Throughput by Department
- Average Error Rate % by Department
- Average Latency (ms) by Department
- Failed Tasks vs Successful Tasks by Department
This page helps managers compare operational efficiency.
For instance, if one department shows higher latency, leaders can investigate workflow issues immediately. Similarly, departments with higher success rates can serve as performance benchmarks.
Click to buy Artificial Intelligence (AI) Dashboard in Power BI
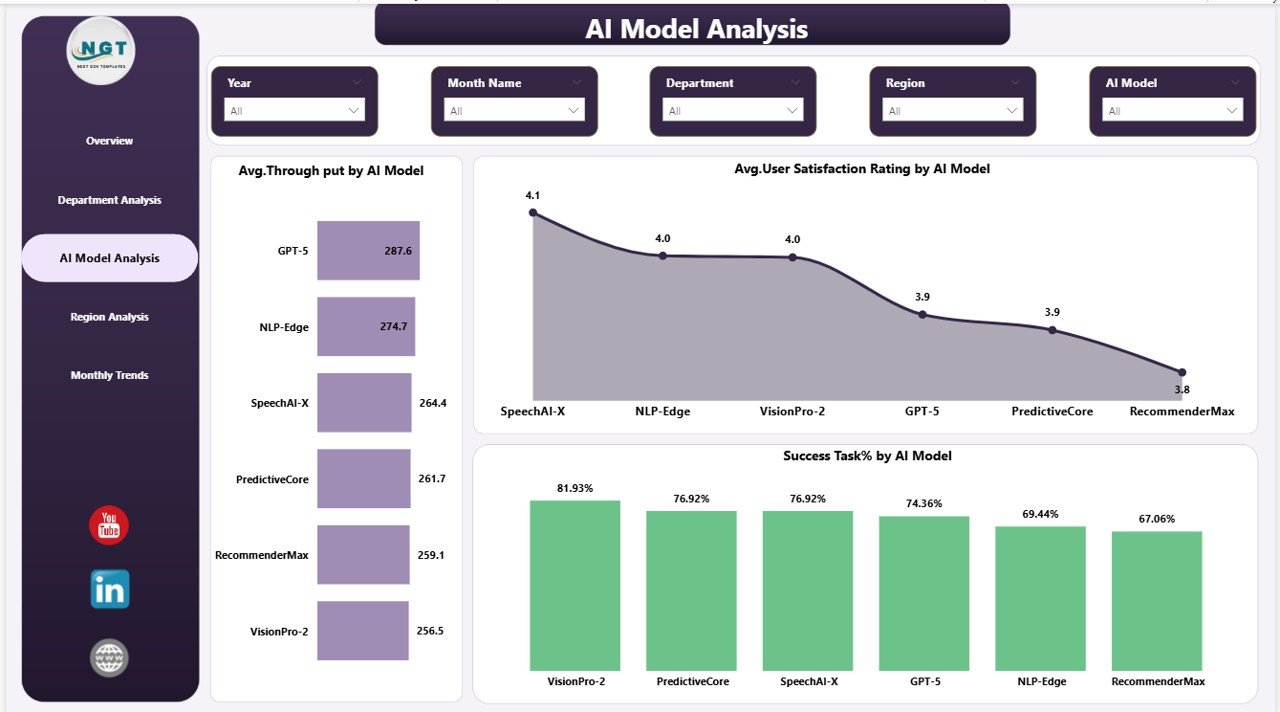
AI Model Analysis – Which AI Model Performs Best?
Organizations often deploy multiple AI models simultaneously. Therefore, comparing model performance becomes critical.
The AI Model Analysis Page provides model-level insights.
Charts Included
- Average Throughput by AI Model
- Average User Satisfaction Rating by AI Model
- Success Task % by AI Model
Through this analysis, data teams identify:
- High-performing models
- Cost-efficient models
- Models requiring optimization
Consequently, organizations allocate resources more effectively.
Click to buy Artificial Intelligence (AI) Dashboard in Power BI
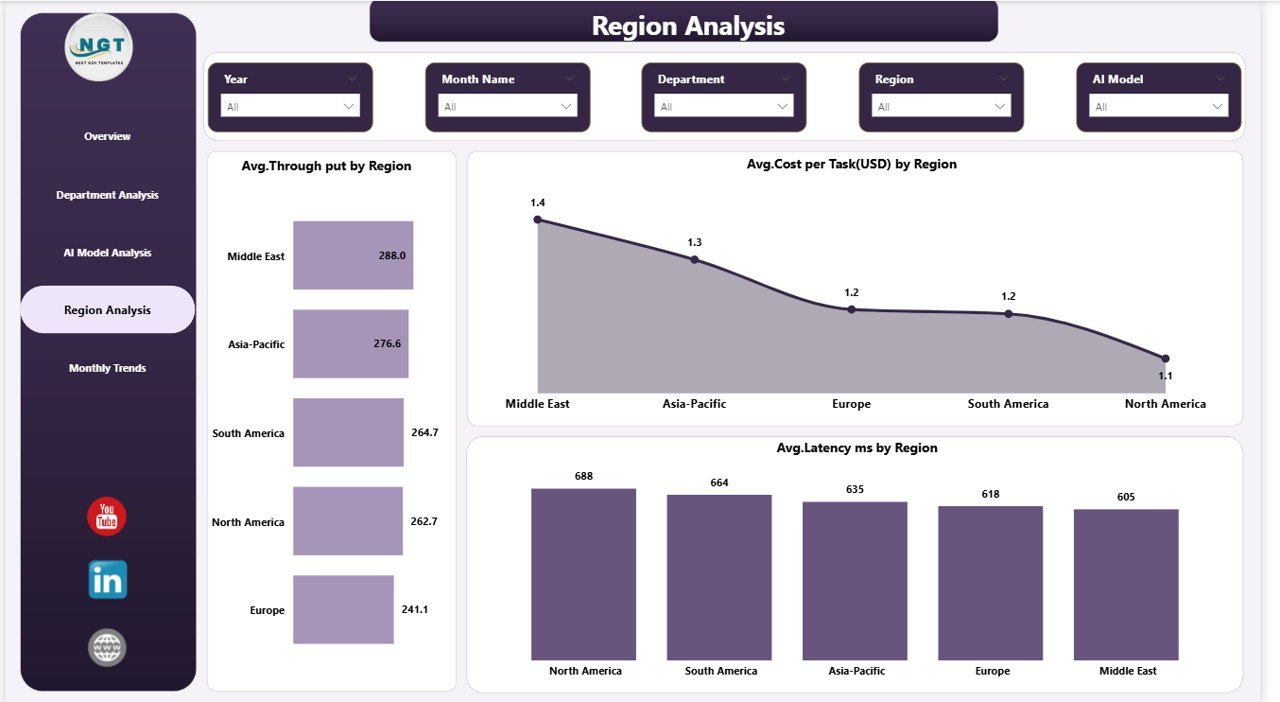
Region Analysis – How Does AI Performance Differ by Location?
Global organizations operate AI systems across multiple regions. However, performance often varies due to infrastructure or user behavior.
The Region Analysis Page highlights geographic performance differences.
Charts Available
- Average Throughput by Region
- Average Cost per Task (USD) by Region
- Average Latency (ms) by Region
This analysis enables companies to:
- Detect regional inefficiencies
- Optimize infrastructure deployment
- Improve user experience worldwide
Click to buy Artificial Intelligence (AI) Dashboard in Power BI
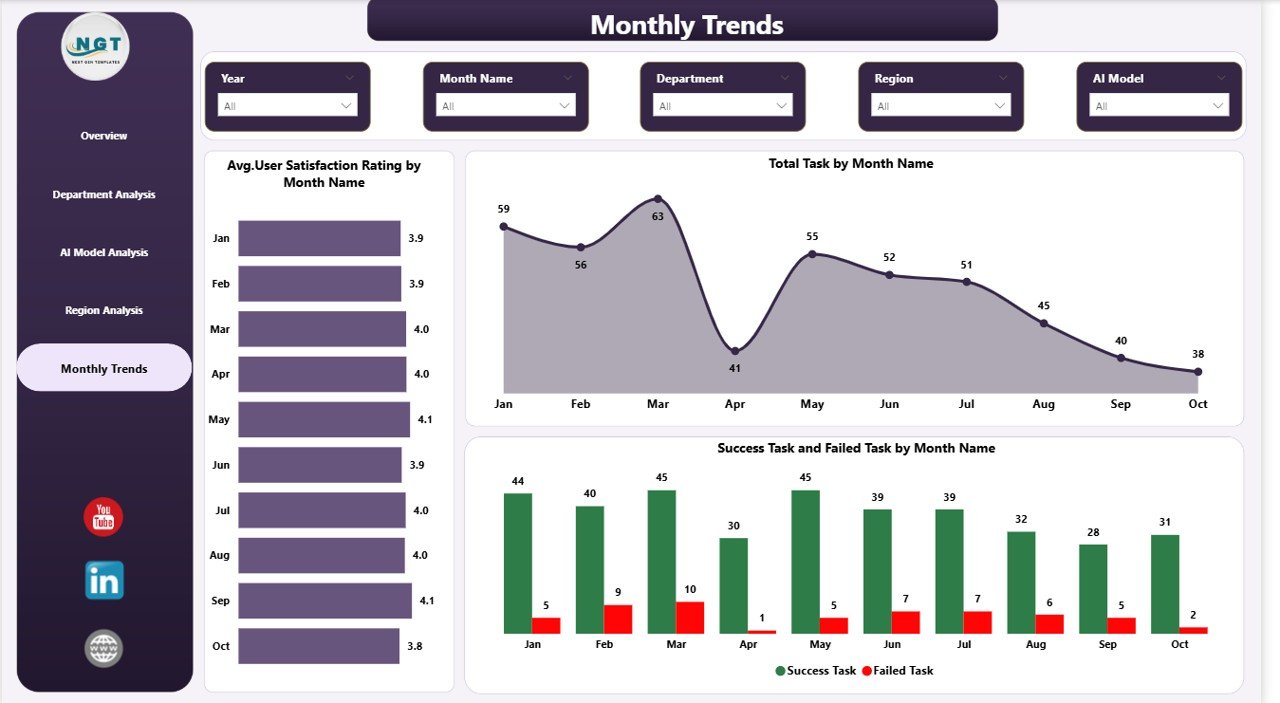
Monthly Trends – How Is AI Performance Changing Over Time?
Performance monitoring requires trend analysis. Therefore, the Monthly Trends Page focuses on historical performance.
Charts Included
- Average User Satisfaction Rating by Month
- Total Tasks by Month
- Success vs Failed Tasks by Month
Because trends become visible over time, organizations identify performance improvements or emerging risks early.
Click to buy Artificial Intelligence (AI) Dashboard in Power BI
What KPIs Does the AI Dashboard Track?
A strong AI dashboard depends on meaningful KPIs. This solution tracks operational, financial, and user experience metrics together.
Operational KPIs
- Total Tasks
- Throughput
- Latency
- Error Rate
- Success Rate
Financial KPIs
- Cost per Task
- Model Cost Efficiency
- Regional Cost Analysis
User Experience KPIs
- Satisfaction Ratings
- Performance Consistency
- Reliability Indicators
Together, these KPIs provide a complete performance picture.
How Does the AI Dashboard Improve Decision-Making?
Organizations make better decisions when data becomes clear and accessible.
The dashboard improves decisions by:
- Providing real-time insights
- Highlighting performance gaps
- Supporting data-driven planning
- Improving accountability
- Enabling faster corrective actions
Moreover, Power BI allows interactive filtering, so users explore insights instantly.
Advantages of Artificial Intelligence (AI) Dashboard in Power BI
Using an AI dashboard delivers several strategic advantages.
Centralized Monitoring
Teams analyze all AI operations from one location instead of multiple reports.
Faster Problem Detection
Managers identify performance issues immediately.
Improved Cost Control
Organizations monitor cost per task and optimize spending.
Better Model Optimization
Data teams compare models using measurable metrics.
Enhanced User Experience
Tracking satisfaction ratings helps improve AI outputs.
Real-Time Insights
Power BI updates visuals automatically when data refreshes.
How Does Power BI Enhance AI Analytics?
Power BI offers advanced capabilities that make AI dashboards powerful and scalable.
Key Power BI Advantages
- Interactive slicers and filters
- Real-time data refresh
- Drill-down analysis
- Dynamic visualizations
- Cloud sharing capabilities
- Secure access control
Because of these features, organizations scale AI analytics easily.
Best Practices for the Artificial Intelligence (AI) Dashboard
To achieve maximum value, organizations should follow proven best practices.
Define Clear KPIs
Always select KPIs aligned with business goals.
Maintain Data Quality
Clean and consistent data improves dashboard accuracy.
Monitor Performance Regularly
Review dashboards weekly or daily.
Compare Trends Instead of Single Metrics
Trend analysis reveals long-term patterns.
Optimize Visual Design
Use clear visuals to avoid information overload.
Set Performance Benchmarks
Define acceptable latency, throughput, and success targets.
Automate Data Refresh
Automated updates ensure timely insights.
Who Can Benefit from This AI Dashboard?
Many roles benefit from structured AI analytics.
Business Leaders
- Evaluate ROI of AI initiatives
- Monitor operational efficiency
Data Scientists
- Compare model performance
- Optimize algorithms
IT Teams
- Monitor infrastructure performance
- Reduce downtime
Operations Managers
- Improve departmental efficiency
Product Managers
- Track user satisfaction trends
How Does This Dashboard Support AI Governance?
AI governance ensures responsible and efficient AI usage.
This dashboard supports governance by:
- Tracking performance transparency
- Monitoring reliability metrics
- Identifying bias indicators through satisfaction patterns
- Supporting compliance reporting
- Documenting performance history
Therefore, organizations maintain accountability in AI operations.
Common Use Cases of the AI Dashboard
Organizations apply this dashboard across multiple industries.
Technology Companies
Monitor AI APIs and automation services.
Customer Support Automation
Track chatbot performance.
Healthcare AI Systems
Measure diagnostic processing efficiency.
Financial Services
Monitor fraud detection systems.
E-commerce Platforms
Evaluate recommendation engines.
How to Implement an Artificial Intelligence Dashboard in Power BI?
Implementation becomes simple when organizations follow structured steps.
Step-by-Step Process
- Collect AI operational data.
- Prepare structured datasets.
- Import data into Power BI.
- Create KPI measures.
- Build visualization pages.
- Add slicers and filters.
- Validate metrics accuracy.
- Publish dashboard for users.
As a result, teams deploy analytics quickly.
Future of AI Dashboards in Business Analytics
AI monitoring will become even more important as AI adoption grows.
Future dashboards may include:
- Predictive performance alerts
- Automated anomaly detection
- AI-generated insights
- Real-time optimization recommendations
- Integrated machine learning monitoring
Therefore, AI dashboards will evolve into intelligent decision assistants.
Conclusion: Why Every Organization Needs an AI Dashboard
Artificial Intelligence delivers value only when organizations measure performance continuously. Without analytics visibility, AI systems become expensive and inefficient.
The Artificial Intelligence (AI) Dashboard in Power BI solves this challenge by transforming complex operational data into clear insights. It enables organizations to monitor tasks, evaluate models, manage costs, analyze regions, and track long-term trends.
As a result, businesses improve efficiency, enhance user satisfaction, and maximize AI investments.
Simply put, this dashboard turns AI operations into measurable and controllable business assets.
Frequently Asked Questions (FAQs)
What is an AI Dashboard in Power BI?
An AI Dashboard in Power BI is a reporting tool that visualizes AI system performance using KPIs, charts, and interactive analytics.
Why is latency important in AI monitoring?
Latency measures response time. Lower latency improves user experience and operational efficiency.
What does throughput mean in AI analytics?
Throughput represents the number of tasks processed within a specific time period.
Can non-technical users use this dashboard?
Yes. Power BI visuals simplify complex AI data, making insights easy to understand.
How often should AI dashboards be reviewed?
Organizations should review dashboards daily or weekly depending on operational volume.
Does this dashboard help reduce AI costs?
Yes. Monitoring cost per task helps organizations optimize resources and reduce unnecessary expenses.
Can the dashboard track multiple AI models?
Yes. The AI Model Analysis page compares performance across different models.
Is Power BI suitable for enterprise AI monitoring?
Absolutely. Power BI supports scalability, security, and real-time analytics for enterprise environments.
Click to buy Artificial Intelligence (AI) Dashboard in Power BI
Visit our YouTube channel to learn step-by-step video tutorials
Watch the step-by-step video tutorial: