Auction houses operate in a fast-moving and highly competitive environment. Every auction event involves buyers, sellers, consignments, bids, commissions, and revenue targets. Therefore, auction managers must monitor performance continuously. However, many auction businesses still depend on scattered spreadsheets and manual reports. As a result, leaders struggle to track performance, identify trends, and make timely decisions.So, how can auction houses gain complete visibility over operational and financial performance without investing in expensive software?You need an Auction Houses KPI Dashboard in Power BI.This article explains everything you need to know about this powerful dashboard solution. Moreover, you will learn how it works, why auction houses need it, what KPIs it tracks, and how you can use it to improve decision-making.
Click to buy Auction Houses KPI Dashboard in Power BI
What Is an Auction Houses KPI Dashboard in Power BI?
An Auction Houses KPI Dashboard in Power BI is a ready-to-use analytical reporting solution designed to monitor auction performance using interactive visuals and structured KPI tracking.
Instead of reviewing multiple Excel files, this dashboard centralizes all performance metrics into one dynamic Power BI interface. Consequently, auction managers can evaluate results instantly.
The dashboard captures data through an Excel data source and transforms it into meaningful insights such as:
- Monthly performance tracking
- Target vs actual comparisons
- Year-over-year performance analysis
- KPI trend monitoring
- Operational efficiency measurement
Because Power BI provides interactive filtering and drill-through capabilities, users can analyze performance at both summary and detailed levels.
Why Do Auction Houses Need KPI Tracking?
Auction businesses manage complex operations. They handle inventory valuation, bidder participation, sales conversion, commissions, and revenue performance simultaneously. Therefore, decision-makers require real-time visibility.
Without KPI tracking:
- Managers rely on manual calculations
- Performance issues remain hidden
- Revenue opportunities get missed
- Strategic planning becomes difficult
However, a KPI dashboard changes everything.
Key Reasons Auction Houses Need KPI Dashboards
- Monitor auction success rates instantly
- Track revenue targets against actual results
- Analyze monthly and yearly performance trends
- Identify underperforming categories quickly
- Make faster and smarter decisions
As a result, auction houses operate with clarity and confidence.
How Does the Auction Houses KPI Dashboard Work?
The dashboard uses Power BI Desktop as the visualization layer and Excel worksheets as the data source. Therefore, updating performance data becomes simple and structured.
Users only need to update Excel input sheets. After refreshing Power BI, all visuals update automatically.
This workflow ensures:
- Easy maintenance
- High flexibility
- Minimal technical complexity
- Real-time reporting capability
Dashboard Structure: What Pages Are Included?
The Auction Houses KPI Dashboard includes three powerful analytical pages. Each page serves a specific business purpose.
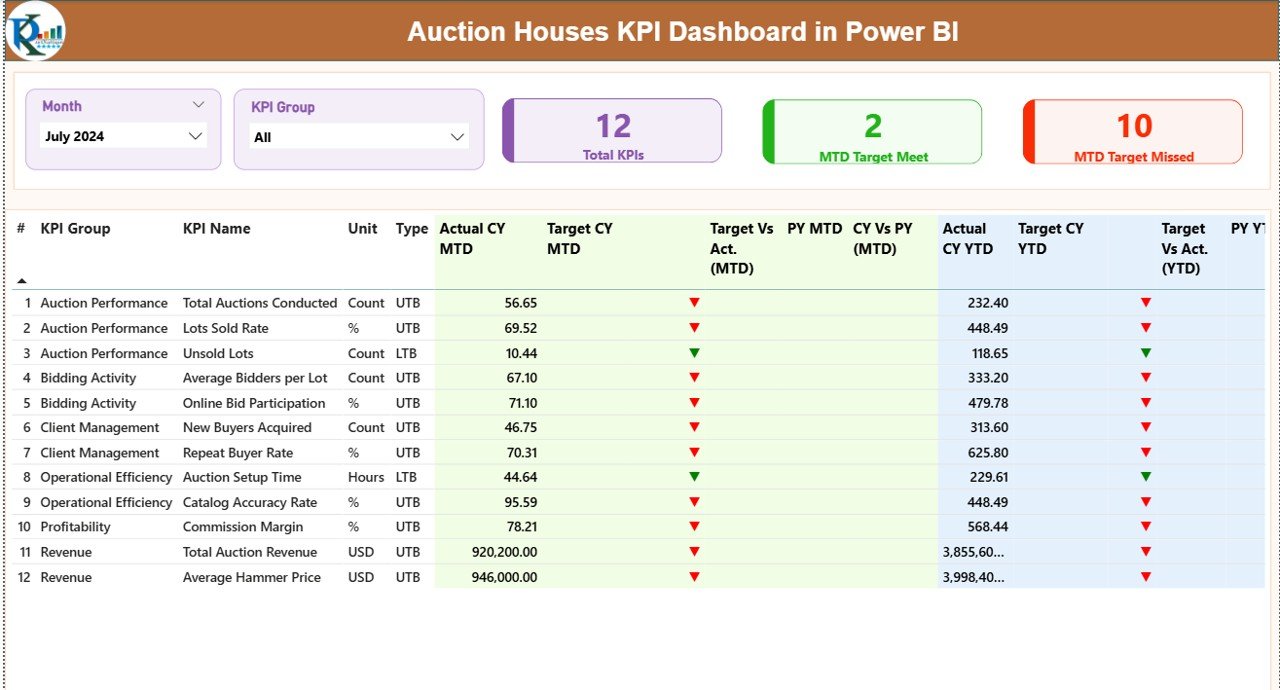
Summary Page – The Executive Performance Overview
The Summary Page acts as the main control center of the dashboard. Here, users can view overall KPI performance instantly.
Interactive Filters
At the top of the page, you will find:
- Month Slicer – Analyze performance for any selected month
- KPI Group Slicer – Filter KPIs by category
Because of these slicers, users can perform focused analysis quickly.
KPI Performance Cards
The dashboard displays three important KPI cards:
- Total KPIs Count – Number of KPIs tracked
- MTD Target Meet Count – KPIs achieving targets
- MTD Target Missed Count – KPIs below expectations
These cards provide an immediate health check of business performance.
Detailed KPI Performance Table
Below the cards, a structured table presents complete KPI insights.
Information Included:
- KPI Number
- KPI Group
- KPI Name
- Unit of Measurement
- KPI Type (LTB or UTB)
Monthly (MTD) Performance Metrics
The dashboard tracks Month-To-Date performance using:
- Actual CY MTD
- Target CY MTD
- Target vs Actual Percentage
- PY MTD Comparison
- CY vs PY Growth %
Additionally, colored icons improve interpretation:
- ▲ Green icon → Target achieved
- ▼ Red icon → Target missed
Therefore, managers understand performance instantly without deep analysis.
Yearly (YTD) Performance Metrics
The dashboard also analyzes Year-To-Date performance:
- Actual CY YTD
- Target CY YTD
- Target vs Actual (YTD)
- Previous Year YTD
- CY vs PY (YTD) comparison
Consequently, users gain both short-term and long-term performance insights.
Click to buy Auction Houses KPI Dashboard in Power BI
KPI Trend Page – Performance Over Time
While the Summary Page shows status, the KPI Trend Page explains performance movement.
Here, users can analyze trends using two combo charts.
Charts Included
- MTD Trend Comparison
- YTD Trend Comparison
Each chart displays:
- Current Year Actual values
- Previous Year values
- Target values
A KPI slicer on the left allows users to select any KPI dynamically.
Because of this feature, managers can identify:
- Seasonal patterns
- Growth trends
- Performance decline
- Target gaps
As a result, strategic planning becomes easier.

Click to buy Auction Houses KPI Dashboard in Power BI
KPI Definition Page – Drill-Through Intelligence
The KPI Definition Page remains hidden and works as a drill-through page.
From the Summary Page, users can drill into any KPI to view:
- KPI Formula
- KPI Definition
- Measurement logic
- KPI Type (LTB or UTB)
This feature ensures transparency and clarity across teams.
To return, users simply click the Back Button located at the top left.

Click to buy Auction Houses KPI Dashboard in Power BI
Excel Data Source Structure
The dashboard connects to an Excel file containing three worksheets.
Input_Actual Sheet
Here, users enter actual performance values.
Required fields include:
- KPI Name
- Month (First date of month)
- MTD Value
- YTD Value
After updating data, refreshing Power BI updates visuals automatically.

Click to buy Auction Houses KPI Dashboard in Power BI
Input_Target Sheet
This sheet contains KPI targets.
Users must fill:
- KPI Name
- Month
- Target MTD
- Target YTD
Targets help measure achievement levels accurately.
KPI Definition Sheet
This sheet defines KPI logic.
Columns include:
- KPI Number
- KPI Group
- KPI Name
- Unit
- Formula
- Definition
- KPI Type (LTB or UTB)
Because definitions remain centralized, reporting stays consistent.
What KPIs Can Auction Houses Track?
Auction houses can monitor multiple performance indicators such as:
Operational KPIs
- Number of auctions conducted
- Lots sold percentage
- Bid participation rate
- Average bidding time
Financial KPIs
- Total auction revenue
- Commission earned
- Average sale price
- Revenue per auction
Efficiency KPIs
- Auction turnaround time
- Unsold inventory rate
- Cost vs revenue ratio
Customer KPIs
- New bidder registrations
- Returning buyers
- Seller satisfaction score
Therefore, businesses gain a holistic performance view.
Advantages of Auction Houses KPI Dashboard in Power BI
A structured dashboard delivers significant business benefits.
Centralized Performance Monitoring
You view all KPIs in one location instead of switching between files.
Faster Decision-Making
Real-time insights allow quick corrective actions.
Improved Target Tracking
Managers instantly identify which KPIs meet expectations.
Better Trend Analysis
Historical comparisons reveal growth patterns.
Visual Data Interpretation
Icons and charts simplify complex numbers.
Scalable Reporting
You can add new KPIs without redesigning the dashboard.
Increased Operational Transparency
Teams understand KPI definitions through drill-through pages.
How Does Power BI Improve Auction Management?
Power BI transforms raw data into actionable insights.
Because visuals update dynamically:
- Leaders track auctions in real time
- Analysts discover performance gaps quickly
- Teams align with organizational goals
Moreover, Power BI reduces reporting time significantly. Instead of spending hours preparing reports, users focus on strategy.
Best Practices for the Auction Houses KPI Dashboard in Power BI
To achieve maximum value, follow these best practices.
- Define Clear KPIs
Choose KPIs aligned with business goals.
- Maintain Clean Data
Always validate Excel input data before refreshing Power BI.
- Update Data Regularly
Monthly updates ensure accurate analysis.
- Use KPI Groups
Categorize KPIs into Finance, Operations, and Customer groups.
- Monitor Trends, Not Just Numbers
Always analyze performance over time.
- Train Team Members
Ensure users understand KPI definitions and formulas.
- Review Targets Periodically
Adjust targets according to market conditions.
- Use Drill-Through Analysis
Investigate underperforming KPIs deeply.
Following these practices improves reporting accuracy and business outcomes.
Who Can Benefit from This Dashboard?
This dashboard supports multiple roles within auction organizations.
Auction Executives
- Monitor business performance instantly.
Financial Managers
- Track revenue and profitability metrics.
Operations Managers
- Improve auction efficiency.
Analysts
- Perform detailed performance analysis.
Business Owners
- Make data-driven strategic decisions.
How Does This Dashboard Improve Business Growth?
When businesses measure performance correctly, improvement becomes predictable.
The dashboard helps by:
- Identifying profitable auction categories
- Reducing operational inefficiencies
- Improving target achievement rates
- Increasing revenue visibility
Consequently, auction houses scale operations confidently.
Why Choose Power BI Instead of Traditional Reports?
Traditional reporting methods create delays and confusion. However, Power BI introduces interactive analytics.Therefore, modern auction businesses prefer Power BI dashboards.
Future of Auction Analytics with KPI Dashboards
Auction industries increasingly adopt data analytics. As competition grows, organizations rely more on KPI dashboards.
Future trends include:
- Predictive auction performance analysis
- AI-driven bidder behavior insights
- Automated reporting workflows
- Cloud-based collaboration
Hence, KPI dashboards will become essential management tools.
Conclusion
Auction houses must operate with precision, transparency, and speed. However, manual reporting methods limit visibility and slow decision-making.
The Auction Houses KPI Dashboard in Power BI solves these challenges by transforming Excel data into interactive insights. It combines KPI tracking, trend analysis, and performance monitoring into one centralized system.
Because the dashboard provides both MTD and YTD analysis, managers understand performance clearly. Moreover, drill-through definitions ensure reporting consistency across teams.
Ultimately, this dashboard empowers auction businesses to make smarter decisions, improve efficiency, and achieve sustainable growth.
Frequently Asked Questions (FAQs)
What is an Auction Houses KPI Dashboard?
It is a Power BI dashboard that tracks auction performance using KPIs such as revenue, targets, and operational metrics.
Do I need Power BI expertise to use this dashboard?
No. You only need to update Excel input sheets and refresh the dashboard.
Can I customize KPIs?
Yes. You can add or modify KPIs through the KPI Definition sheet.
How often should data be updated?
You should update data monthly or whenever new auction results become available.
What does LTB and UTB mean?
- LTB (Lower the Better) – Lower values indicate better performance.
- UTB (Upper the Better) – Higher values indicate better performance.
Can small auction businesses use this dashboard?
Yes. The dashboard works for both small and large auction houses.
Does the dashboard support trend analysis?
Yes. The KPI Trend Page shows MTD and YTD performance comparisons.
Why should auction houses use KPI dashboards?
Because KPI dashboards improve visibility, decision-making, and performance management.
Visit our YouTube channel to learn step-by-step video tutorials
Click to buy Auction Houses KPI Dashboard in Power BI