The autonomous vehicle industry evolves at a rapid pace. Every day, companies test new algorithms, deploy sensors, analyze driving data, and improve safety systems. However, despite advanced technology, many teams still struggle to track performance clearly. Data stays scattered across multiple sheets, tools, and reports. As a result, decision-making slows down.
That is exactly where an Autonomous Vehicles KPI Dashboard in Excel becomes a powerful solution.
In this detailed article, you will learn what an Autonomous Vehicles KPI Dashboard in Excel is, why it matters, how it works, and how each worksheet supports performance monitoring. Moreover, you will explore its advantages, opportunities for improvement, best practices, and frequently asked questions. By the end, you will clearly understand how this dashboard helps autonomous vehicle teams stay data-driven and competitive.
Click to Purchases Autonomous Vehicles KPI Dashboard in Excel
What Is an Autonomous Vehicles KPI Dashboard in Excel?
An Autonomous Vehicles KPI Dashboard in Excel is a ready-to-use performance monitoring tool designed to track, analyze, and visualize key performance indicators related to autonomous vehicle development, testing, and operations.
Instead of reviewing raw datasets or disconnected reports, teams can monitor all critical KPIs from one centralized dashboard. Consequently, managers gain clarity, engineers track progress efficiently, and leadership makes faster decisions.
Because this dashboard runs entirely in Microsoft Excel, it remains flexible, cost-effective, and easy to customize. At the same time, it delivers structured insights similar to advanced analytics tools.
Why Do Autonomous Vehicle Teams Need a KPI Dashboard?
Autonomous vehicle programs generate massive volumes of data. Therefore, teams must track safety, accuracy, efficiency, reliability, and compliance continuously. Without a clear KPI system, problems stay hidden.
Here is why a KPI dashboard becomes essential:
-
It centralizes KPI tracking in one place
-
It highlights performance gaps instantly
-
It compares actual results with targets and previous year data
-
It supports data-driven planning and accountability
-
It saves hours of manual reporting effort
As a result, organizations move from reactive reporting to proactive performance management.
How Does the Autonomous Vehicles KPI Dashboard in Excel Work?
This dashboard follows a structured and user-friendly design. Each worksheet serves a specific purpose, while all sheets connect dynamically.
The dashboard updates automatically when users enter or change data. Moreover, drop-down selections allow instant month-wise analysis. Because of this setup, teams always view accurate and up-to-date information.
Let us explore each worksheet in detail.
What Are the Key Worksheets in the Autonomous Vehicles KPI Dashboard?
1. Home Sheet: How Does It Improve Navigation?
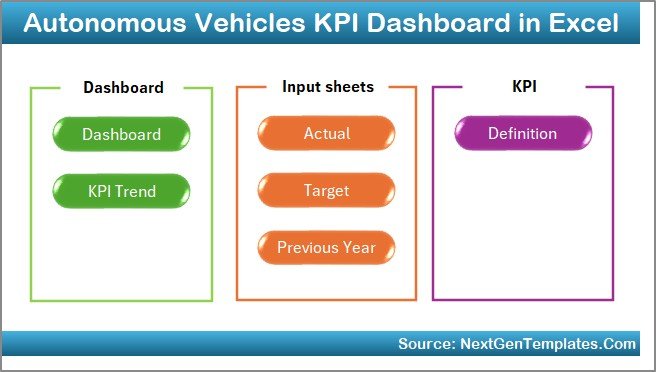
The Home sheet works as an index page for the entire dashboard.
Key highlights include:
-
Six navigation buttons for quick access
-
Clean and simple layout
-
One-click movement between worksheets
Instead of scrolling through tabs, users jump directly to the required analysis page. Therefore, usability improves significantly.
2. Dashboard Sheet: How Do You Monitor Overall KPI Performance?
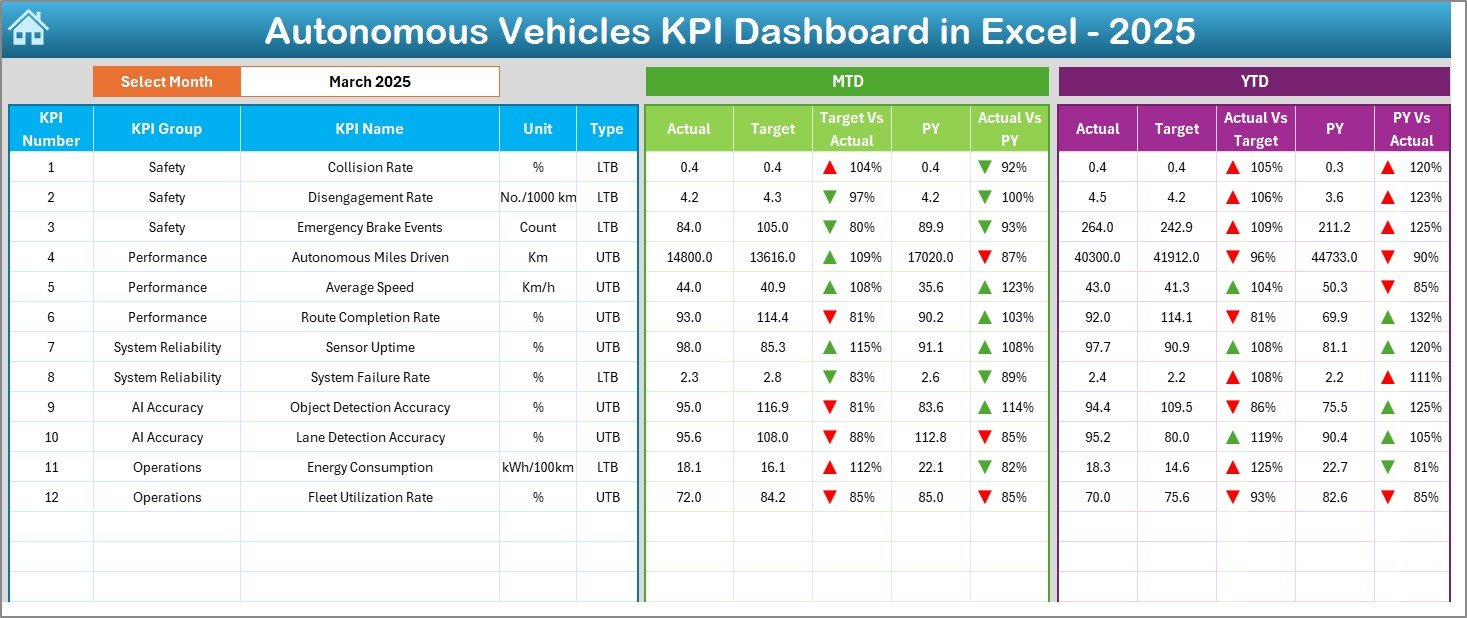
The Dashboard sheet acts as the heart of the entire file.
Here is what this sheet displays:
-
Month selector available in cell D3
-
Automatic update of all KPI values based on the selected month
-
MTD (Month-to-Date) Actual, Target, and Previous Year values
-
YTD (Year-to-Date) Actual, Target, and Previous Year values
-
Click to Purchases Autonomous Vehicles KPI Dashboard in Excel
Additionally, the dashboard shows:
-
Target vs Actual variance
-
Previous Year vs Actual variance
-
Conditional formatting with up and down arrows
As a result, users identify performance trends instantly without complex analysis.
3. KPI Trend Sheet: How Can You Analyze KPI Behavior Over Time?
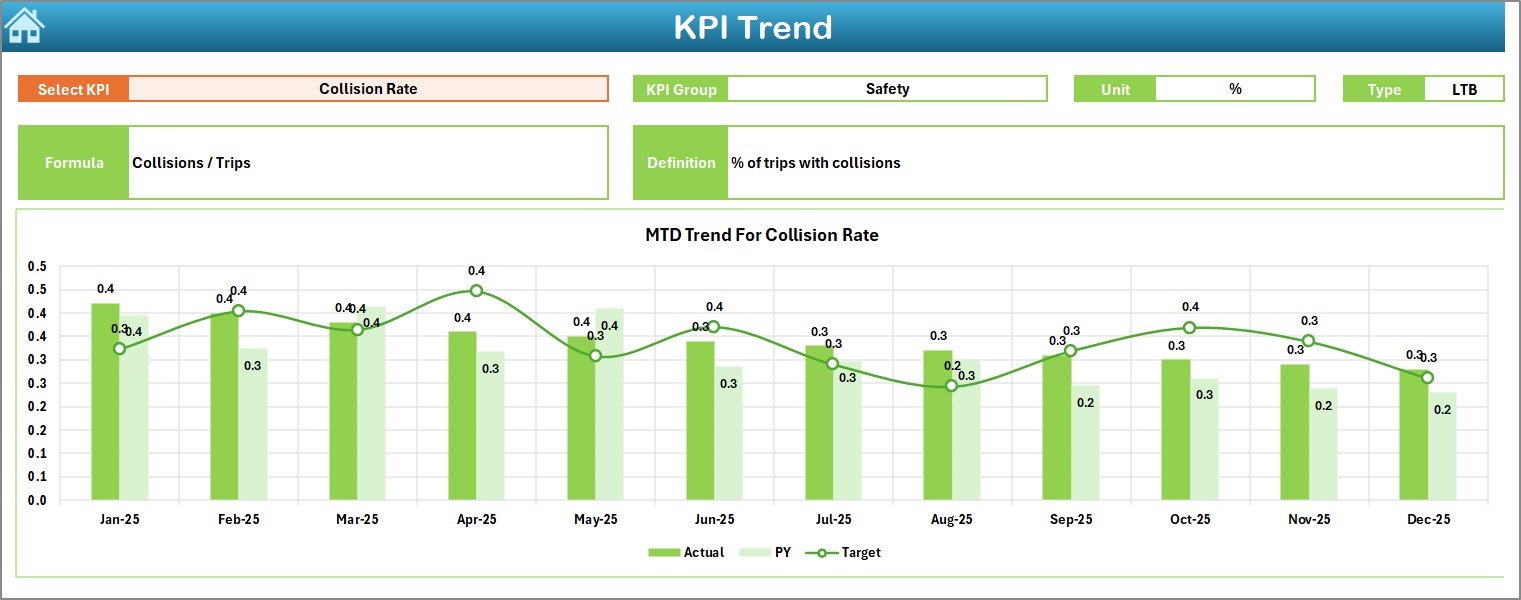
The KPI Trend sheet focuses on deep KPI-level analysis.
On this sheet, users can:
-
Select a KPI name from the drop-down in cell C3
-
View KPI Group, Unit, Type, Formula, and Definition
-
Analyze MTD and YTD trend charts for:
-
Actual values
-
Target values
-
Previous Year values
-
Because of visual trend charts, teams understand performance movement quickly. Consequently, root cause analysis becomes easier.
4. Actual Numbers Input Sheet: Where Do You Enter Real Performance Data?
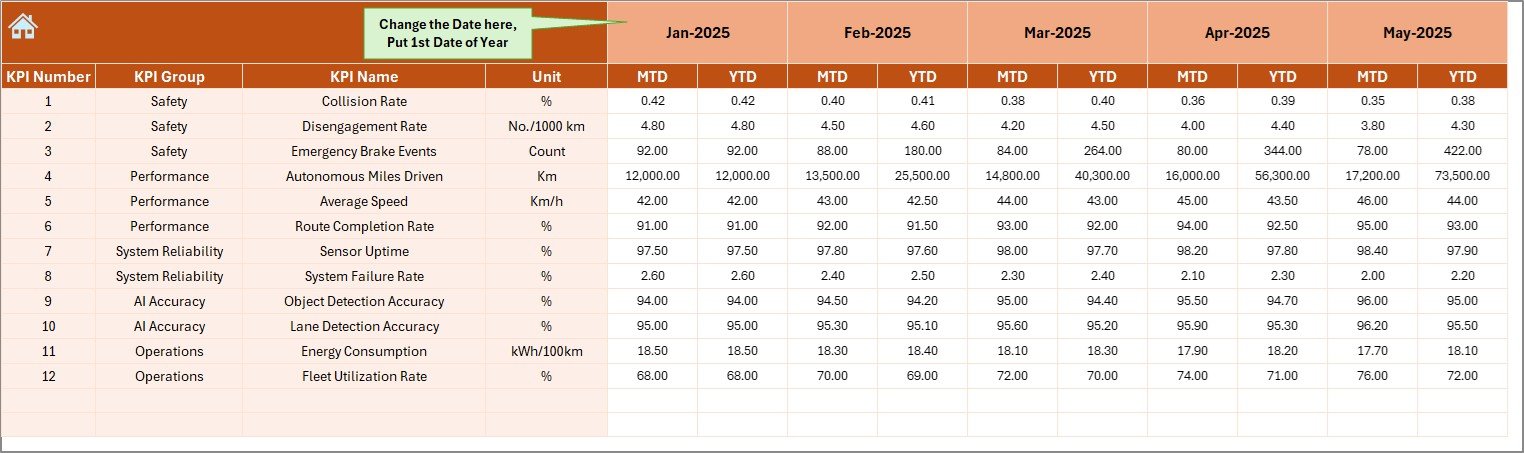
The Actual Numbers Input sheet captures real performance numbers.
Key features include:
-
Month selection in cell E1
-
Input fields for MTD and YTD actual values
-
Structured layout for accurate data entry
Users simply enter actual values once. After that, all dashboards and charts update automatically. Therefore, manual recalculation disappears.
5. Target Sheet: How Do You Track Performance Goals?
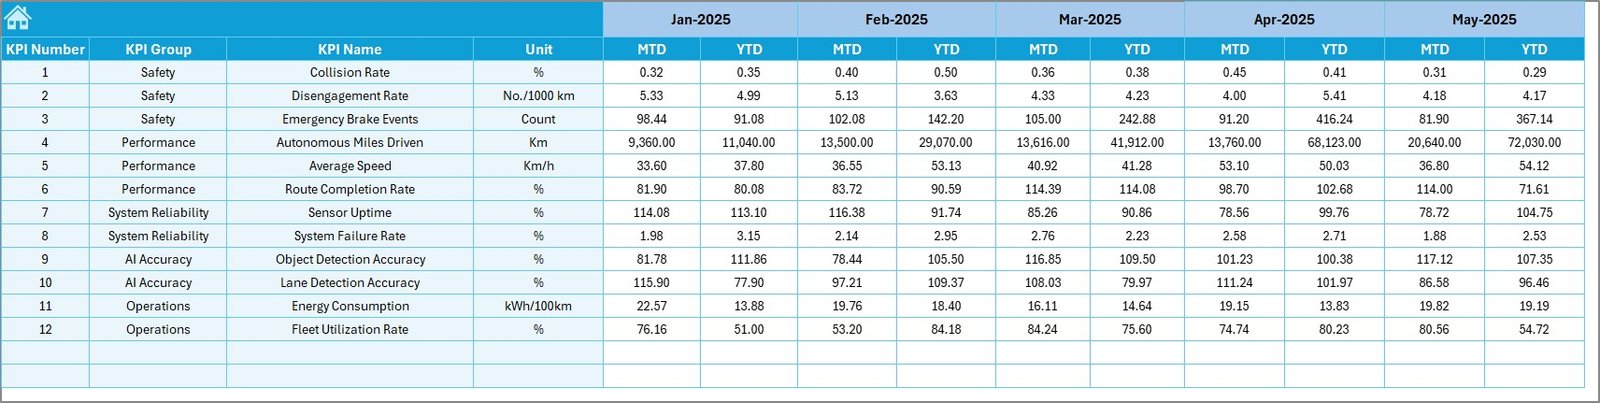
The Target Sheet stores planned or benchmark values.
On this sheet, users:
-
Enter monthly MTD targets for each KPI
-
Enter cumulative YTD targets
-
Align goals with operational strategy
Because targets stay visible alongside actuals, teams remain focused on objectives throughout the year.
6. Previous Year Number Sheet: Why Is Historical Comparison Important?
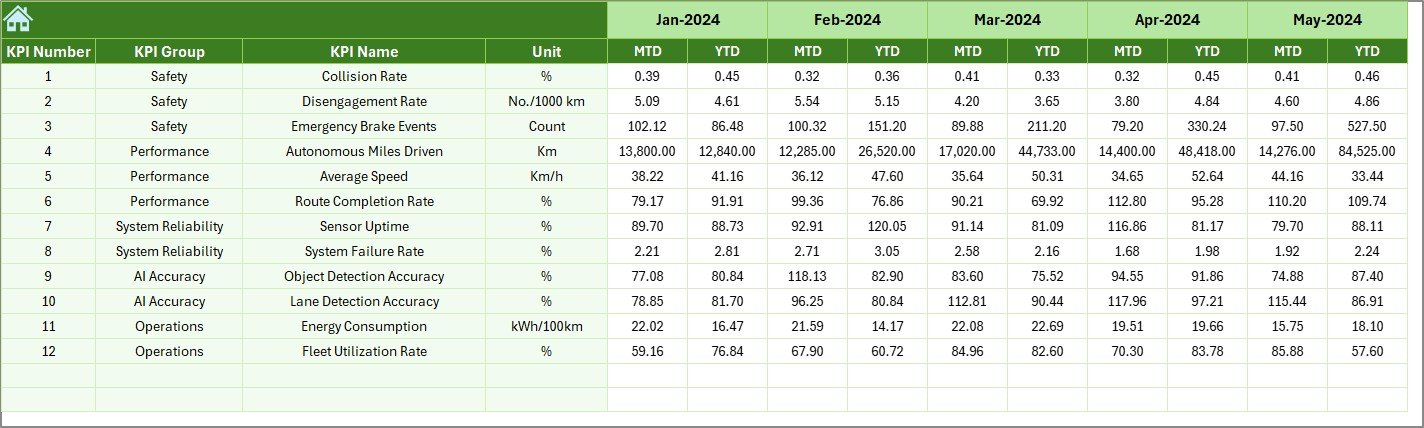
The Previous Year Number sheet captures last year’s KPI values.
This sheet allows teams to:
-
Enter prior year MTD and YTD numbers
-
Compare current performance against historical benchmarks
-
Identify long-term improvement or decline
As a result, leadership gains a broader performance perspective.
Click to Purchases Autonomous Vehicles KPI Dashboard in Excel
7. KPI Definition Sheet: How Do You Ensure KPI Clarity?
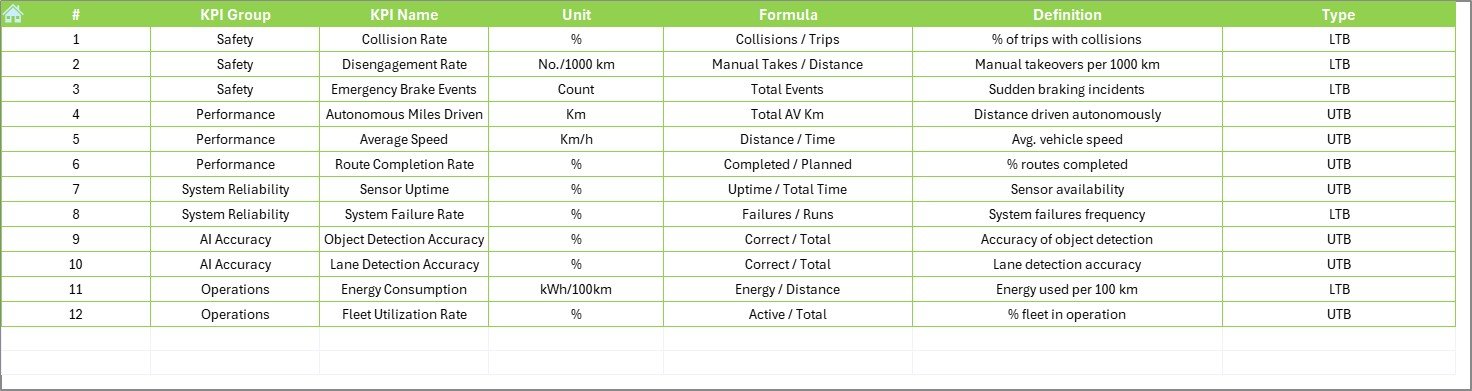
The KPI Definition sheet ensures consistency and understanding.
Here, users define:
-
KPI Name
-
KPI Group
-
Unit of measurement
-
Formula
-
KPI Definition
Because every KPI stays documented, confusion disappears. Moreover, new team members understand metrics quickly.
What KPIs Can You Track in an Autonomous Vehicles Dashboard?
This dashboard supports a wide range of autonomous vehicle KPIs, such as:
-
Autonomous miles driven
-
Disengagement rate
-
Safety incident frequency
-
Sensor accuracy percentage
-
System uptime
-
Software update success rate
-
AI model accuracy
-
Latency response time
Because of its flexible design, teams can add or modify KPIs easily.
Advantages of Autonomous Vehicles KPI Dashboard in Excel
The dashboard delivers several practical benefits. Below are the key advantages explained clearly.
Key Advantages
-
📊 Centralized Performance Tracking
All KPIs stay in one place, which improves visibility and control. -
⏱️ Time-Saving Reporting
Automated calculations eliminate manual effort. -
🎯 Target Alignment
Clear comparison between actuals, targets, and previous year data. -
📈 Trend-Based Insights
Visual charts highlight improvement or decline instantly. -
💰 Cost-Effective Solution
Excel removes the need for expensive analytics software. -
🔧 Highly Customizable
Users can modify KPIs, layouts, and formulas easily.
Opportunities for Improvement in Autonomous Vehicles KPI Dashboard
Even though the dashboard offers strong capabilities, continuous improvement always adds value.
Areas for Enhancement
-
🚀 Integration with Live Data Sources
Connecting sensors or databases can reduce manual data entry. -
📡 Advanced Automation Using Power Query
Automated data refresh improves accuracy and speed. -
📊 Additional Visuals for Predictive Insights
Forecast charts can support proactive planning. -
🔒 Improved Access Control
Sheet-level protection enhances data security. -
🌐 Cloud Collaboration
Sharing via cloud platforms improves team collaboration.
Best Practices for the Autonomous Vehicles KPI Dashboard in Excel
To get the maximum value from this dashboard, teams should follow proven best practices.
Recommended Best Practices
-
✅ Define KPIs Clearly Before Setup
Clear definitions prevent confusion later. -
📅 Update Data Regularly
Timely data entry ensures accurate insights. -
🎯 Align KPIs with Business Goals
Every metric should support strategic objectives. -
📊 Use Conditional Formatting Wisely
Visual indicators should highlight priorities, not clutter views. -
🧪 Validate Data Periodically
Regular checks improve data reliability. -
🧩 Train Team Members Properly
Knowledge sharing improves adoption and usage.
How Does This Dashboard Support Decision-Making?
Click to Purchases Autonomous Vehicles KPI Dashboard in Excel
This dashboard transforms raw data into actionable insights. Because of dynamic comparisons and visual cues, leaders spot issues early. Moreover, engineers track system improvements with clarity.
As a result, decisions rely on facts instead of assumptions.
Who Can Benefit from an Autonomous Vehicles KPI Dashboard in Excel?
This dashboard supports multiple roles across the organization:
-
Autonomous vehicle program managers
-
Data analysts and engineers
-
Safety and compliance teams
-
Operations managers
-
R&D leadership
Each role gains relevant insights without technical complexity.
Conclusion: Is an Autonomous Vehicles KPI Dashboard in Excel Worth Using?
Absolutely.
An Autonomous Vehicles KPI Dashboard in Excel provides a structured, flexible, and powerful way to monitor performance. It centralizes KPIs, improves transparency, and supports faster decisions. Moreover, it reduces reporting effort while increasing insight quality.
For organizations working in autonomous mobility, this dashboard acts as a reliable performance companion throughout the year.
Frequently Asked Questions About Autonomous Vehicles KPI Dashboard in Excel
What is the main purpose of an Autonomous Vehicles KPI Dashboard in Excel?
The main purpose is to track, analyze, and visualize autonomous vehicle performance metrics in one centralized location.
Can I customize KPIs in this dashboard?
Yes, users can add, remove, or modify KPIs easily using the KPI Definition sheet.
Does the dashboard support monthly and yearly analysis?
Yes, the dashboard shows both MTD and YTD performance with dynamic month selection.
Do I need advanced Excel skills to use this dashboard?
No, basic Excel knowledge is enough to operate and update the dashboard.
Can this dashboard replace BI tools?
While it does not replace enterprise BI tools fully, it delivers strong insights at a fraction of the cost.
Is this dashboard suitable for startups and large organizations?
Yes, its scalable design supports both small teams and large enterprises.
Visit our YouTube channel to learn step-by-step video tutorials