In today’s fast-changing healthcare environment, hospitals and bariatric surgery centers must make quick and accurate decisions. However, many professionals still rely on scattered reports and manual calculations. As a result, they struggle to track patient outcomes, surgery performance, and financial data effectively.
So, how can you monitor key metrics like BMI changes, surgery duration, costs, and patient recovery in one place?
The answer is simple: Bariatric Surgery Centers Dashboard in Excel
Biodegradable Packaging Dashboard in Excel
This ready-to-use Excel dashboard helps healthcare professionals track, analyze, and improve surgical performance with ease. In this article, you will learn everything about this dashboard, including its features, benefits, analysis sections, best practices, and FAQs.
Click to buy Bariatric Surgery Centers Dashboard in Excel
What is a Bariatric Surgery Centers Dashboard in Excel?
A Bariatric Surgery Centers Dashboard in Excel is a powerful data visualization tool designed to track and analyze bariatric surgery data. It combines multiple healthcare KPIs into a single, interactive interface.
Instead of switching between multiple reports, you can view everything in one place. Therefore, you can quickly understand trends, compare performance, and make data-driven decisions.
Moreover, this dashboard helps you monitor:
- Patient BMI changes
- Surgery performance
- Cost analysis
- Patient outcomes
- Regional comparisons
- Monthly trends
Why Do Bariatric Surgery Centers Need a Dashboard?
Many healthcare centers face challenges when managing large volumes of patient data. However, with a structured dashboard, you can simplify complex information.
Key reasons include:
- Better tracking of patient outcomes
- Faster decision-making
- Improved cost control
- Enhanced performance monitoring
- Centralized data management
As a result, hospitals can improve both operational efficiency and patient care quality.
What Does This Dashboard Include?
This ready-to-use Excel dashboard includes multiple sheet tabs. Each tab focuses on a specific area of analysis. Therefore, users can easily navigate and explore insights.
How Does the Overview Sheet Help in Decision-Making?
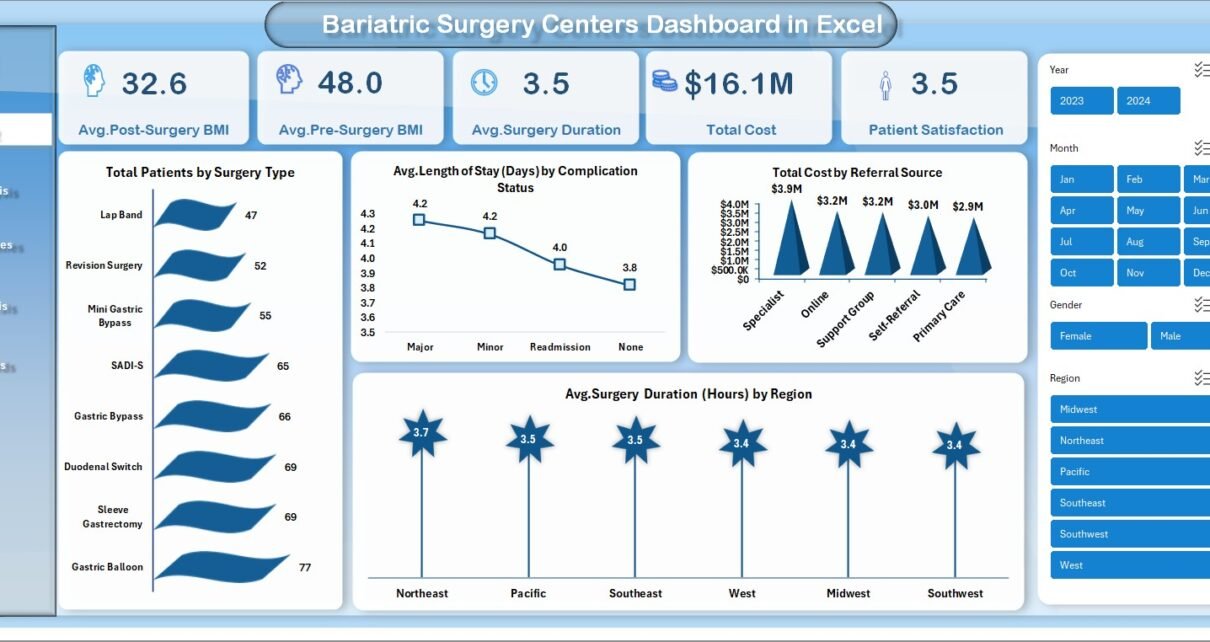
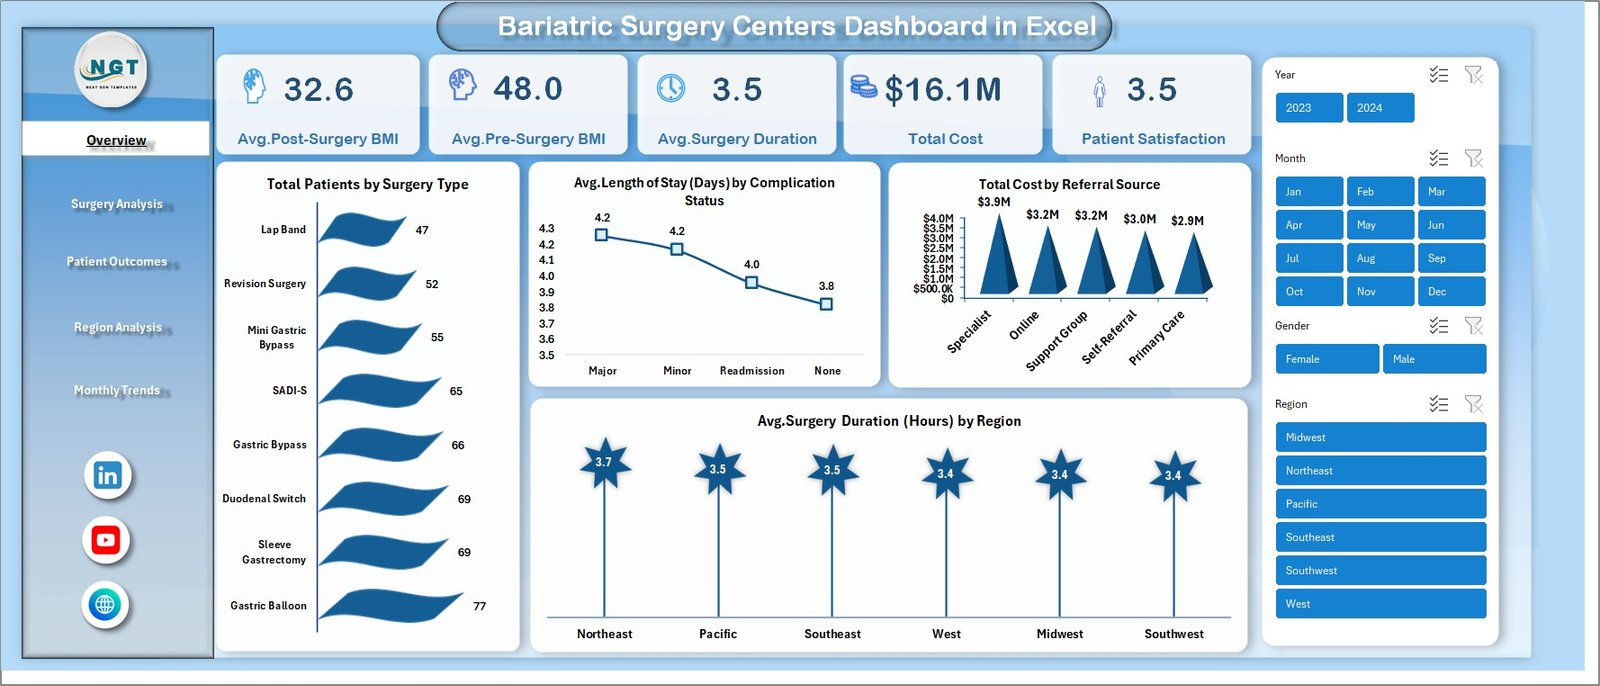
The Overview Sheet acts as the main dashboard page. It provides a quick summary of all important metrics.
Key KPIs Displayed:
- Avg. Post-Surgery BMI
- Avg. Pre-Surgery BMI
- Avg. Surgery Duration (Hours)
- Total Cost
Visual Insights Included:
- Total Patients by Surgery Type
- Avg. Length of Stay (Days) by Complication Status
- Total Cost by Referral Source
- Avg. Surgery Duration (Hours) by Region
Because of this summary view, decision-makers can quickly identify trends and issues.
Click to buy Bariatric Surgery Centers Dashboard in Excel
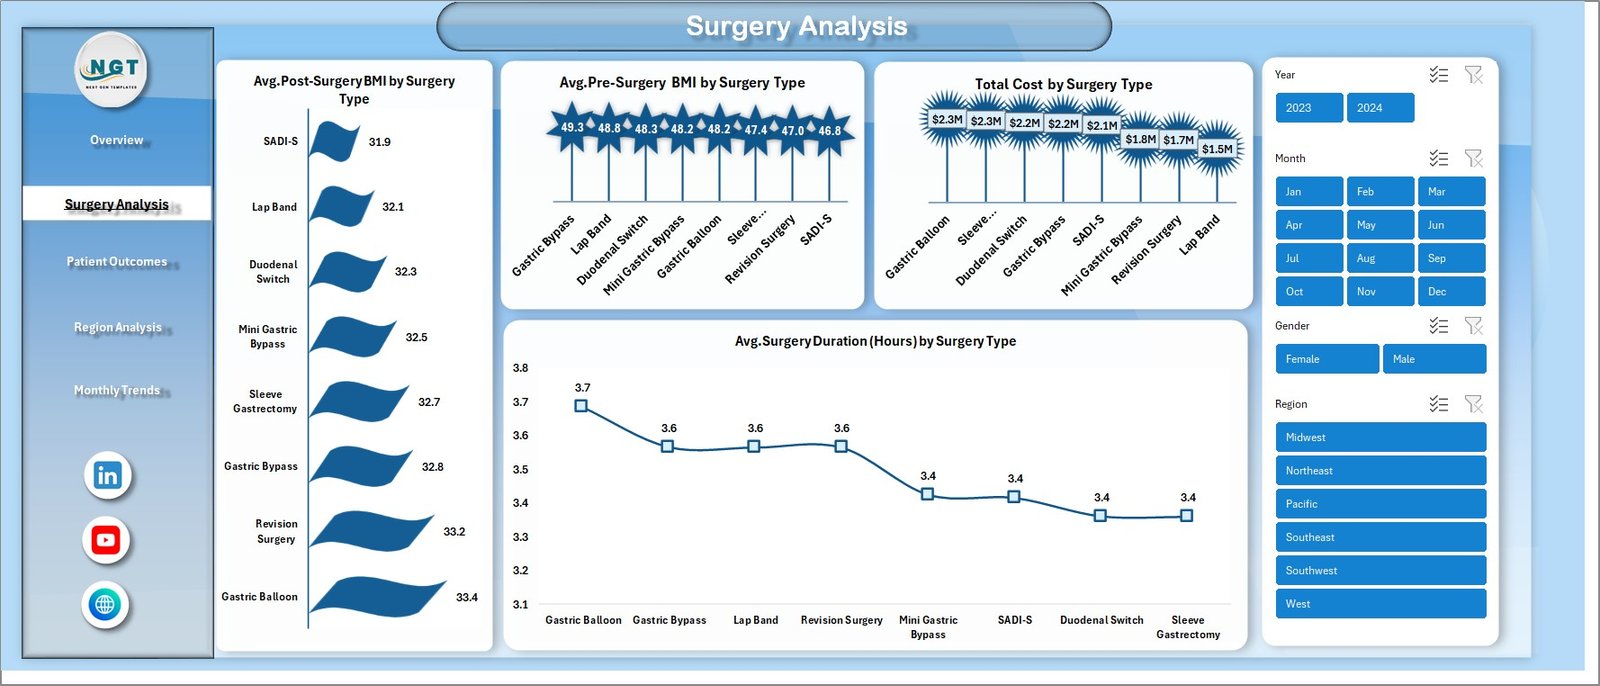
How Does Surgery Analysis Improve Performance?
The Surgery Analysis Sheet focuses on comparing different surgery types. Therefore, it helps in evaluating which procedures perform best.
Key Metrics:
- Avg. Post-Surgery BMI by Surgery Type
- Avg. Pre-Surgery BMI by Surgery Type
- Total Cost by Surgery Type
- Avg. Surgery Duration (Hours) by Surgery Type
Why It Matters:
- Helps identify cost-effective procedures
- Improves surgical planning
- Supports better resource allocation
Click to buy Bariatric Surgery Centers Dashboard in Excel
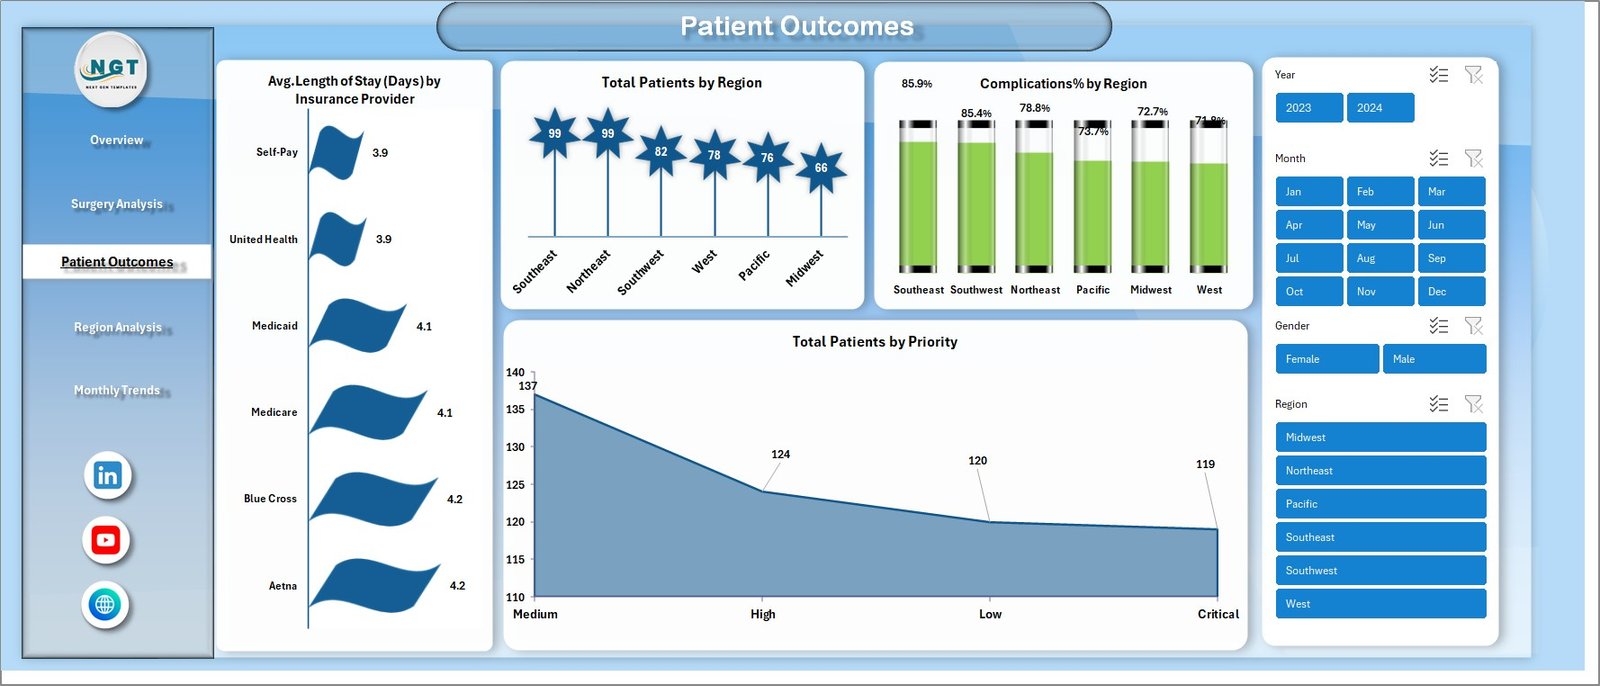
How Does Patient Outcomes Analysis Help Healthcare Providers?
The Patient Outcomes Sheet focuses on recovery and satisfaction. As a result, healthcare providers can improve patient care.
Key Insights:
- Avg. Length of Stay (Days) by Insurance Provider
- Total Patients by Region
- Complications % by Region
- Total Patients by Priority
Benefits:
- Tracks recovery performance
- Identifies high-risk areas
- Improves patient satisfaction
Click to buy Bariatric Surgery Centers Dashboard in Excel
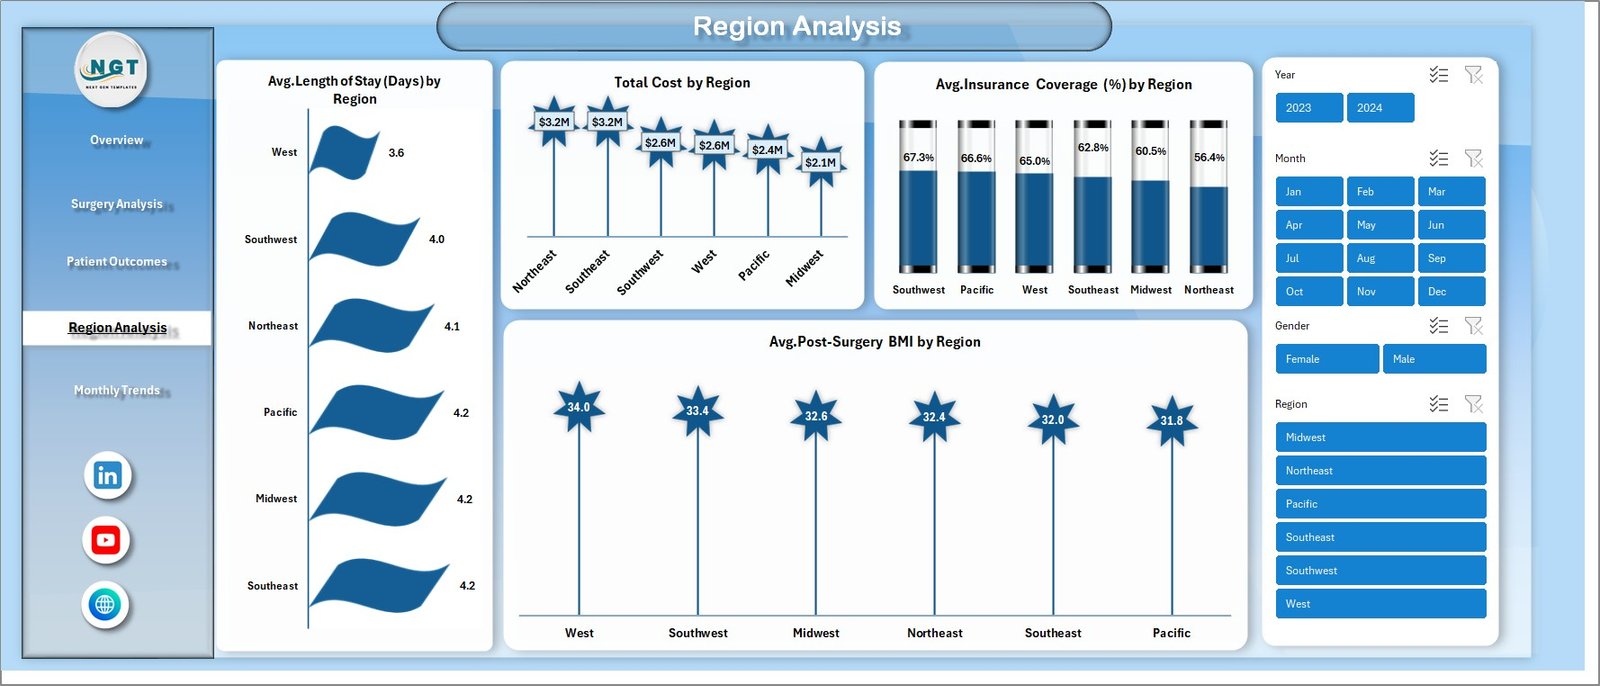
Why is Region Analysis Important for Healthcare Centers?
The Region Analysis Sheet helps compare performance across different locations.
Key Metrics:
- Avg. Length of Stay (Days) by Region
- Total Cost by Region
- Avg. Insurance Coverage (%) by Region
- Avg. Post-Surgery BMI by Region
Key Advantages:
- Identifies high-performing regions
- Helps optimize resource allocation
- Supports expansion planning
Click to buy Bariatric Surgery Centers Dashboard in Excel
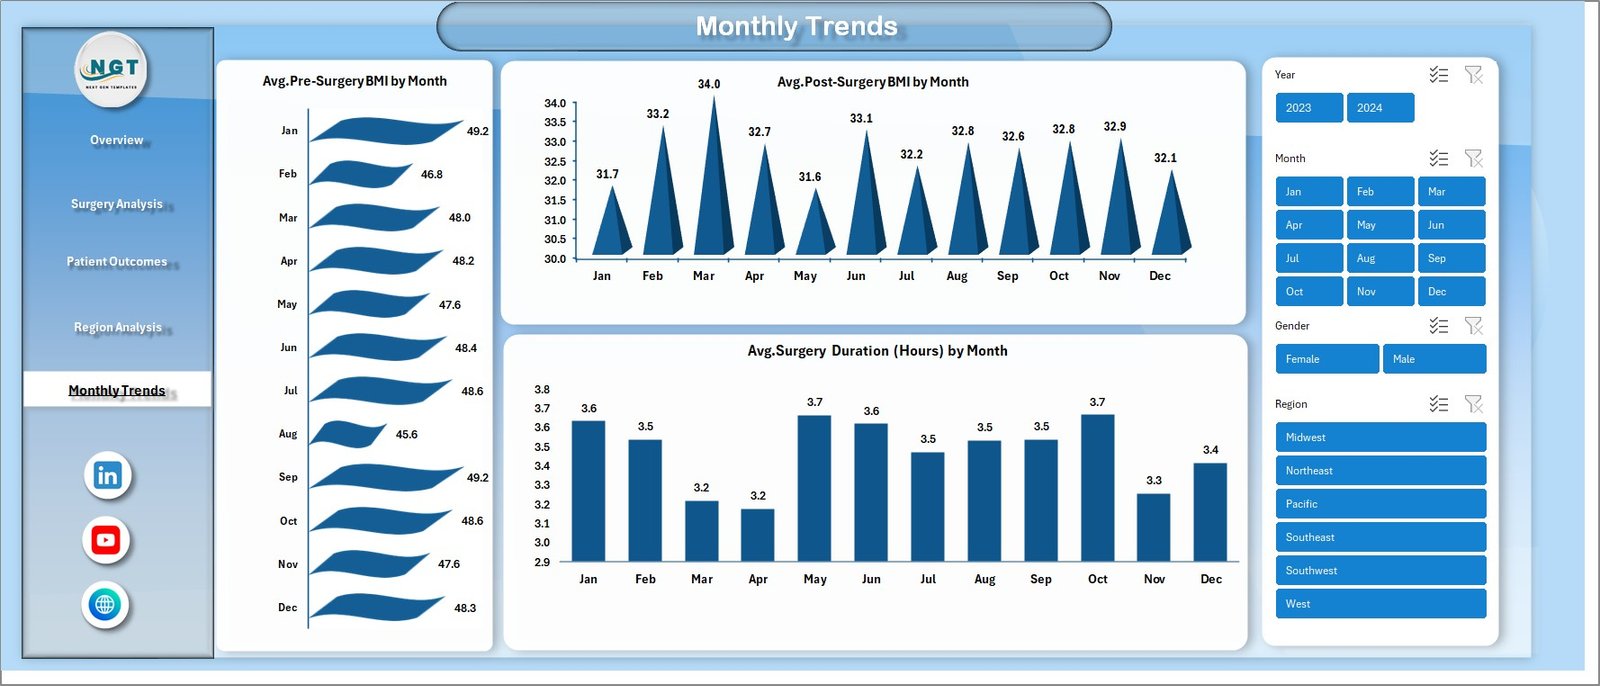
How Do Monthly Trends Help in Planning?
The Monthly Trends Sheet allows users to analyze performance over time.
Key Metrics:
- Avg. Pre-Surgery BMI by Month
- Avg. Post-Surgery BMI by Month
- Avg. Surgery Duration (Hours) by Month
Why It’s Useful:
- Detects seasonal trends
- Helps forecast future demand
- Improves long-term planning
Click to buy Bariatric Surgery Centers Dashboard in Excel
Advantages of Bariatric Surgery Centers Dashboard in Excel
Using this dashboard offers multiple benefits. Therefore, it becomes an essential tool for healthcare professionals.
Key Advantages:
- Easy to use and fully customizable
- Centralized data for better insights
- Real-time performance tracking
- Improved patient care decisions
- Enhanced cost management
- Faster reporting and analysis
Moreover, you do not need advanced technical skills to use it.
How Can This Dashboard Improve Hospital Efficiency?
This dashboard not only tracks data but also improves operations.
It helps by:
- Reducing manual work
- Automating calculations
- Highlighting key trends
- Supporting quick decisions
As a result, hospitals can focus more on patient care rather than data management.
Best Practices for the Bariatric Surgery Centers Dashboard in Excel
To get the best results, you should follow some important practices.
Best Practices:
- Always update data regularly
- Use clean and structured data
- Avoid duplicate entries
- Use filters and slicers effectively
- Monitor KPIs consistently
- Customize charts as per your needs
Additionally, you should review the dashboard weekly or monthly for better insights.
Who Can Benefit from This Dashboard?
This dashboard is useful for multiple healthcare professionals.
Target Users:
- Hospital administrators
- Surgeons and medical staff
- Healthcare analysts
- Insurance companies
- Financial managers
Therefore, anyone involved in healthcare data can benefit from it.
How to Use the Bariatric Surgery Dashboard in Excel?
Using this dashboard is simple and straightforward.
Steps to Use:
- Enter your data in the data sheet
- Refresh pivot tables and charts
- Use slicers to filter data
- Analyze insights from different sheets
Because of its user-friendly design, even beginners can use it easily.
Conclusion: Why Should You Use This Dashboard?
In conclusion, the Bariatric Surgery Centers Dashboard in Excel is a powerful and practical tool for healthcare analytics.
It helps you:
- Track patient outcomes
- Monitor surgery performance
- Control costs
- Improve decision-making
Therefore, if you want to simplify healthcare data and gain actionable insights, this dashboard is the perfect solution.
Frequently Asked Questions (FAQs)
What is the main purpose of this dashboard?
The main purpose is to track and analyze bariatric surgery data in one place. It helps improve decision-making and patient outcomes.
Can beginners use this Excel dashboard?
Yes, beginners can easily use it. The dashboard is user-friendly and requires basic Excel knowledge.
Can I customize this dashboard?
Absolutely! You can modify charts, KPIs, and layouts based on your needs.
Does this dashboard support real-time data?
It depends on your data source. However, you can update data regularly for near real-time insights.
What type of data is required?
You need data related to:
- Patient details
- Surgery information
- BMI values
- Costs
- Insurance details
Is this dashboard suitable for small clinics?
Yes, both small clinics and large hospitals can use this dashboard effectively.
Visit our YouTube channel to learn step-by-step video tutorials