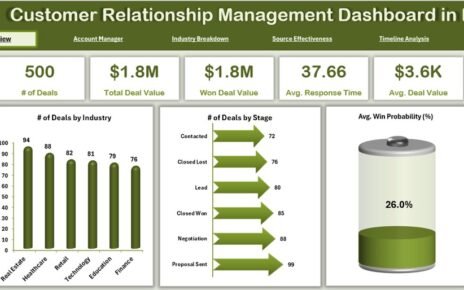
Customer relationships drive the success of every business. But managing those relationships manually can quickly become overwhelming. That’s where a
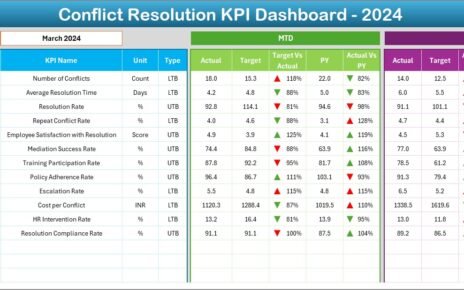
In this article, we introduce the Conflict Resolution KPI Dashboard in Excel—a ready-to-use template designed to help businesses track key
Managing travel plans and expenses can be overwhelming, but with a well-structured Travel and Expense Calendar in Excel, you can