Introduction
The Biodegradable Packaging Dashboard in Excel is a powerful ready-to-use tool that helps businesses monitor and analyze their sustainability efforts and operational performance related to biodegradable packaging. You only need to update your data in the Data sheet and refresh the dashboard from the Data tab on the Excel Ribbon to get instant, actionable insights.
Click to Purchases Biodegradable Packaging Dashboard in Excel
Key Features of Biodegradable Packaging Dashboard in Excel
- Easy data update and refresh using the Data tab in Excel Ribbon
- Comprehensive multi-page dashboard covering various performance and sustainability metrics
- Interactive slicers for fast filtering and customized views
- High-level summary cards for quick status checks
- Visually rich and detailed charts to analyze revenue, production cost, sustainability, and more
Dashboard Pages Explanation
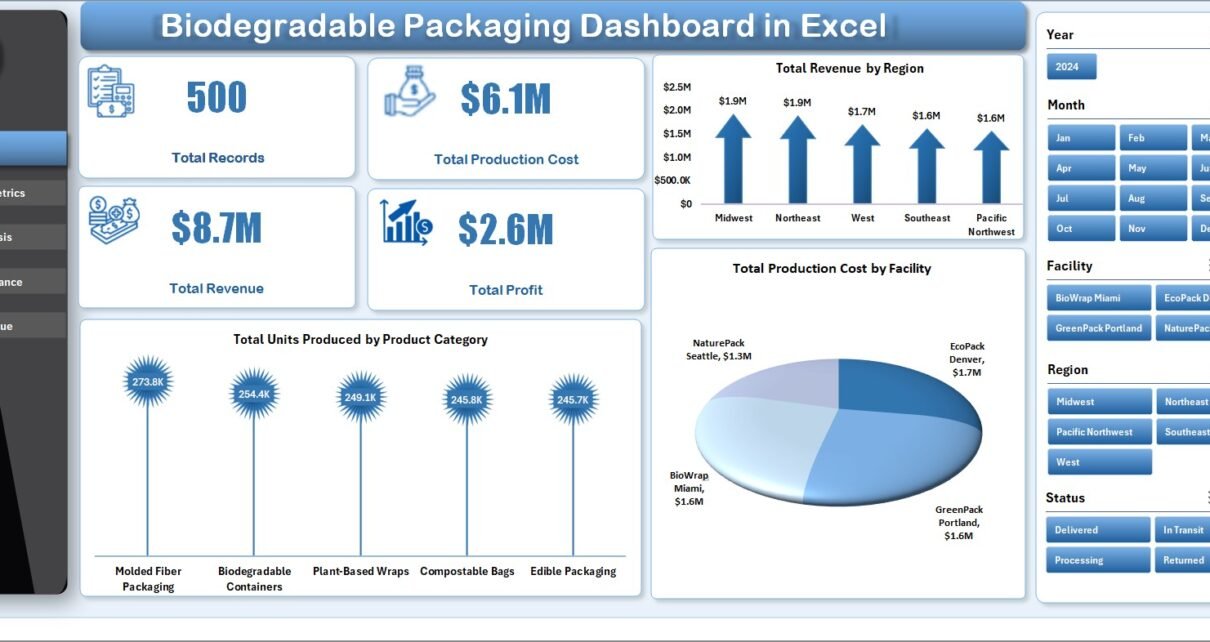
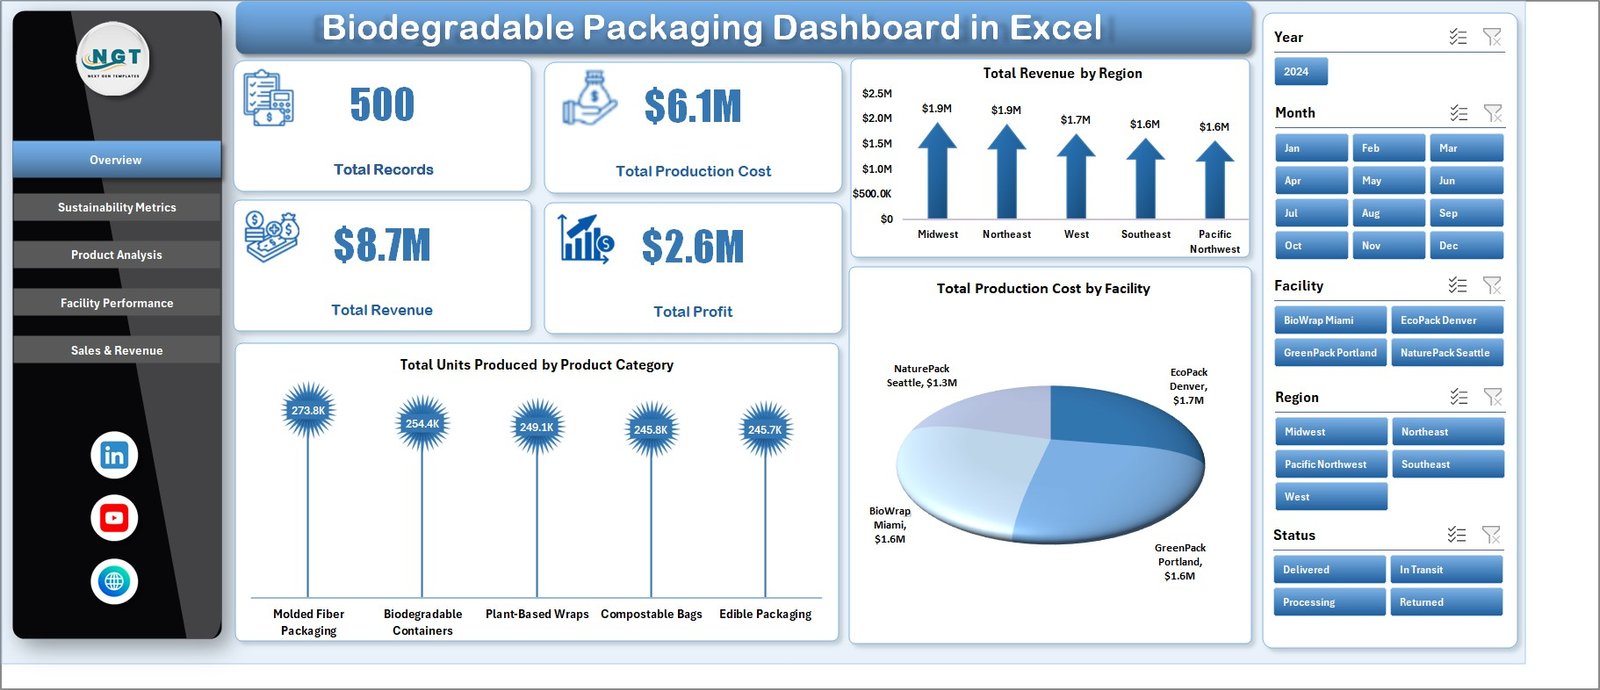
1 – Overview Page
This page offers a top-level summary with key metrics shown as cards including Total Records, Total Production Cost, Total Revenue, and Total Profit. Multiple charts visualize important trends:
- Total Revenue by Region: Displays revenue distribution across different geographical regions, helping identify strong markets.
- Total Production Cost by Facility: Highlights cost efficiency by production site to pinpoint cost-saving opportunities.
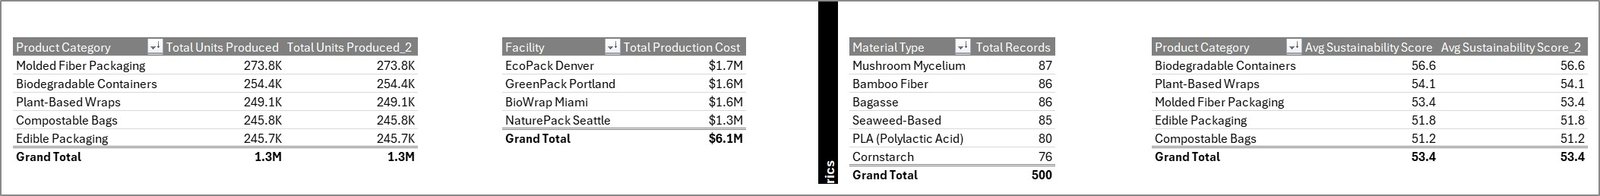
- Total Units Produced by Product Category: Shows production volume breakdown by product type to guide inventory and supply chain decisions.
Biodegradable Packaging Dashboard in Excel
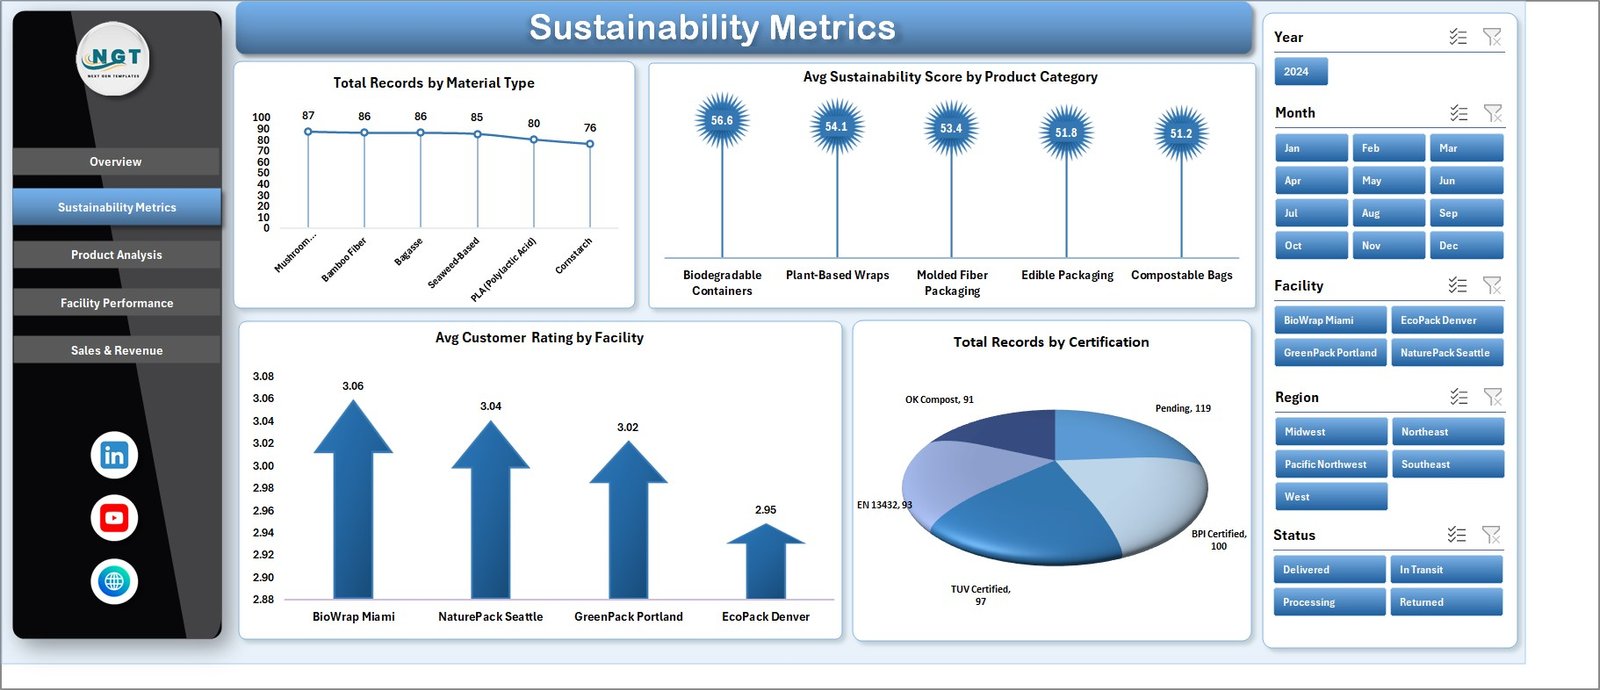
2 – Sustainability Metrics
This section focuses on eco-friendly and certification-related data to evaluate sustainability performance through the following analyses:
- Total Records by Material Type: Visualizes how different biodegradable materials contribute to overall records.
- Avg Sustainability Score by Product: Rates products based on eco-friendliness for better product development decisions.
- Avg Customer Rating by Facility: Measures customer satisfaction at facility levels, linking service to sustainability.
- Total Records by Certification: Counts certifications obtained to ensure compliance and boost brand trust.
Sustainability Metrics
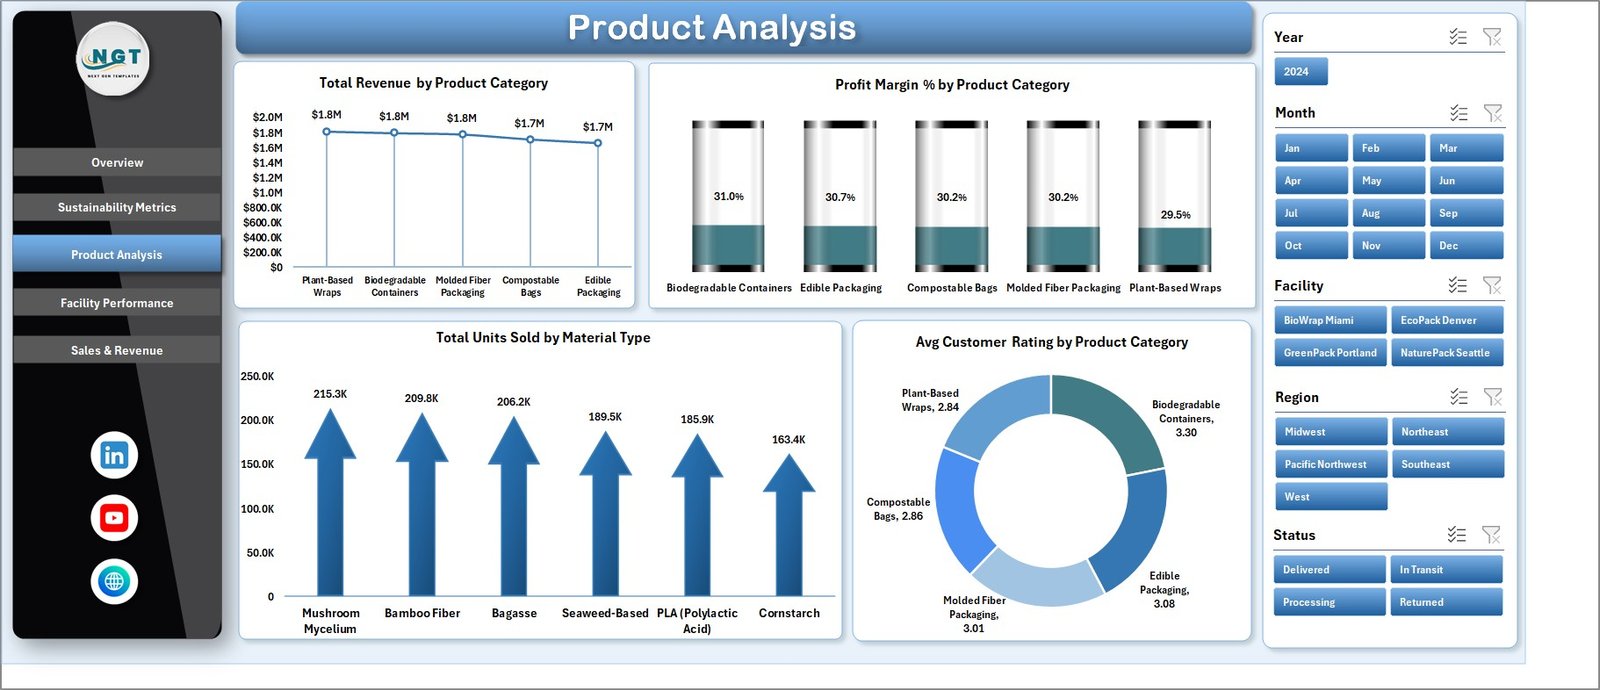
3 – Product Analysis
This page delves into product-level details, analyzing revenue, profitability, sales, and customer satisfaction:
- Total Revenue by Product Category: Highlights the contribution of different product groups to overall sales.
- Profit Margin % by Product Category: Reveals profitability trends across product lines for better pricing strategies.
- Total Units Sold by Material Type: Tracks sales volume by material, aligning production with demand.
- Avg Customer Rating by Product Category: Evaluates customer feedback and quality perception for each product class.
Product Analysis
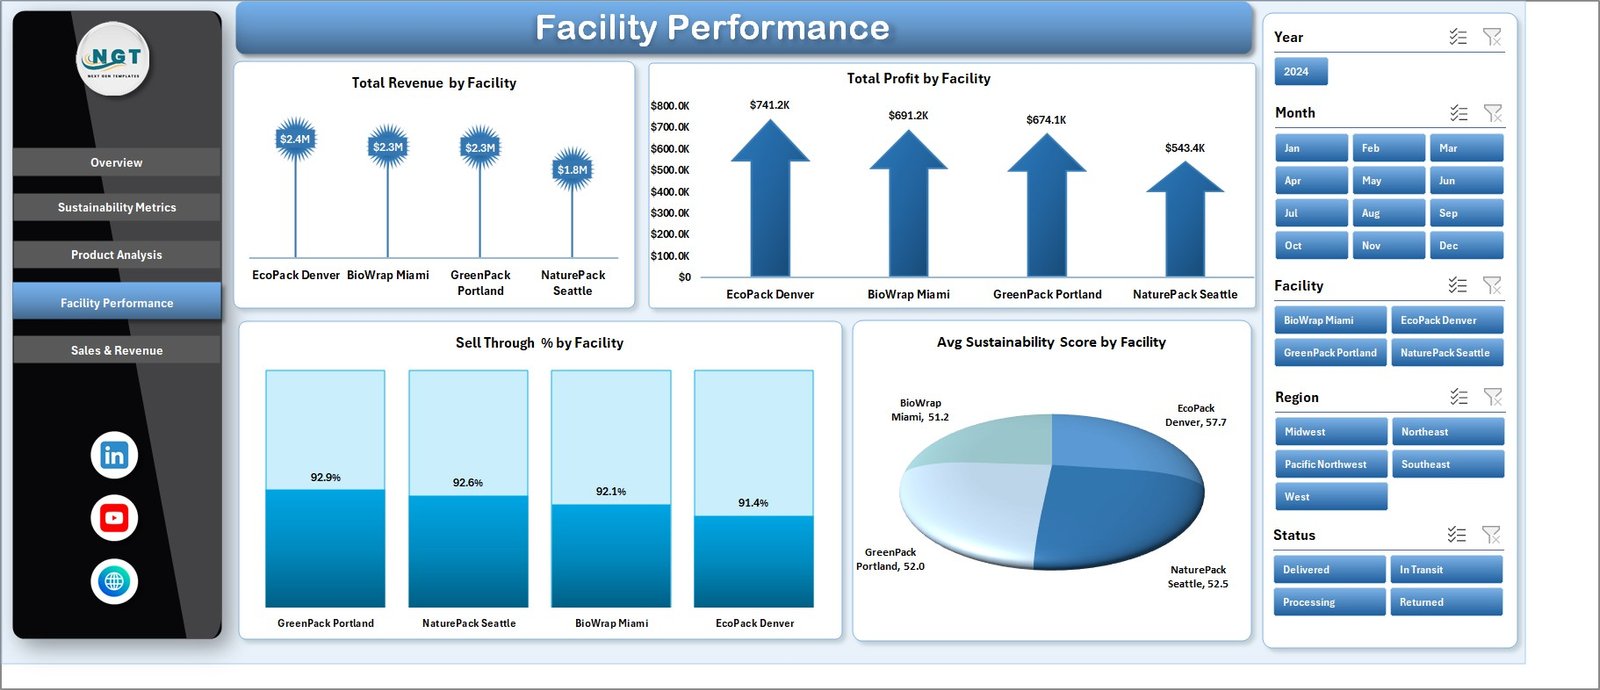
4 – Facility Performance
This tab offers insights into individual facility operations, helping identify strengths and weaknesses:
- Total Revenue by Facility: Measures revenue generation capacity per facility.
- Total Profit by Facility: Assesses profitability to optimize resources and processes.
- Sell Through % by Facility: Indicates inventory turnover and sales efficiency.
- Avg Sustainability Score by Facility: Tracks eco-friendly practices across production sites.
Facility Performance
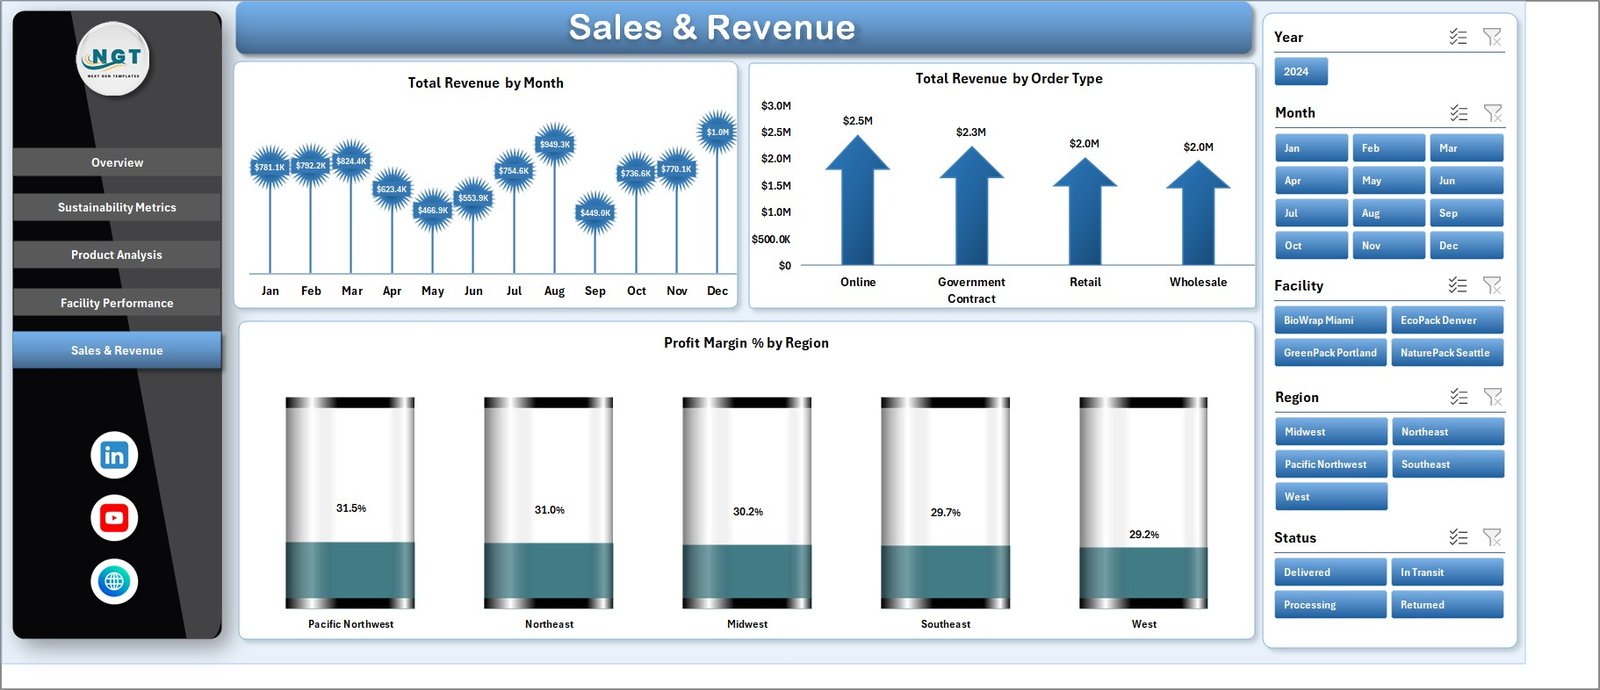
5 – Sales & Revenue
This section explores sales and profitability trends over time and by order types and regions:
- Total Revenue by Month: Tracks monthly revenue trends for seasonal and cyclic patterns.
- Total Revenue by Order Type: Compares revenues from different sales channels or order methods.
- Profit Margin % by Region: Analyzes regional profitability, guiding strategic market focus.
Sales & Revenue
6 – Data Sheet Tab
This is where you input and maintain your raw data in a structured format. Updating this sheet regularly is essential for accurate dashboard results.

Data Sheet tab
7 – Support Sheet
This hidden sheet contains pivot tables that dynamically generate the data behind all dashboard charts. After updating the Data Sheet, use ‘Refresh All’ in the Data tab on Excel Ribbon to update all visualizations at once.
Support sheet tab
Advantages of Biodegradable Packaging Dashboard in Excel
- User-friendly Interaction: Effortlessly filter and explore data with slicers and charts.
- Comprehensive Insights: Understand production, sustainability, facility, and sales metrics in one place.
- Dynamic and Updatable: Easy data refresh ensures fresh and accurate reports without rebuilding.
- Cost-effective: No need for complex software; Excel’s common interface reduces learning curve.
- Visual Appeal: Clean, attractive layout enhances communication of important KPIs.
Opportunities for Improvement
- Integrate automated data import from external ERP or CRM systems to minimize manual entry.
- Add advanced forecasting models to predict production and sales trends.
- Implement conditional formatting for instant anomaly detection.
- Enhance mobile compatibility or create Power BI versions for interactive cloud access.
Best Practices
- Maintain consistent data formats in the Data Sheet to avoid refresh errors.
- Regularly update data and refresh the dashboard to keep insights current.
- Use slicers logically to drill down without over-filtering key visuals.
- Keep the Support Sheet hidden to protect pivot table integrity.
- Document your data update process for team collaboration and continuity.
FAQs
How do I update the dashboard with new data?
Simply add your new data into the Data Sheet in the same format, then go to the Data tab in Excel Ribbon and click ‘Refresh All’ to update all charts and pivot tables automatically.
Can I customize the charts or add new ones?
Yes, since this dashboard is built in Excel, you can customize existing charts or create new ones in any sheet. Just ensure any pivot table sources are updated accordingly.
Click to Purchases Biodegradable Packaging Dashboard in Excel
Is it possible to share this dashboard with other team members?
Absolutely. Share the Excel file with others, and ensure they have compatible Excel versions to open and interact with the dashboard.
Conclusion
The Biodegradable Packaging Dashboard in Excel is a versatile and efficient tool designed to support businesses in tracking their production, sustainability, and sales performance related to biodegradable packaging. Its ready-to-use structure, enriched with visually engaging charts and interactive slicers, provides quick actionable insights while being simple to update. Whether you’re looking to drive sustainable practices or optimize your packaging operations, this dashboard is an invaluable asset.
Click to Purchases Biodegradable Packaging Dashboard in Excel
For more detailed tutorials and demonstrations, visit our YouTube channel to watch the demo.
For additional Excel expertise, refer to Microsoft Excel official support.