In today’s fast-evolving biotech and healthcare landscape, companies generate massive volumes of complex data every single day. However, many organizations still struggle to convert that data into meaningful insights. As a result, decision-making becomes slow, inefficient, and sometimes inaccurate.
So, how can bioinformatics companies track funding, valuation, revenue growth, and operational performance in one place?
The answer is simple: Bioinformatics Companies Dashboard in Power BI
This powerful and interactive dashboard helps you visualize, analyze, and monitor key business metrics with ease. Moreover, it transforms raw data into actionable insights that support strategic decisions.
In this detailed guide, you will learn everything about this dashboard, including its features, pages, benefits, best practices, and frequently asked questions.
Click to buy Bioinformatics Companies Dashboard in Power BI
What is a Bioinformatics Companies Dashboard in Power BI?
A Bioinformatics Companies Dashboard in Power BI is a dynamic data visualization tool designed to track and analyze key performance indicators (KPIs) of bioinformatics companies.
Instead of working with multiple spreadsheets and reports, you can use this dashboard to:
- Monitor financial performance
- Analyze company valuation
- Track funding stages
- Evaluate growth trends
- Understand regional and product-level insights
Therefore, it simplifies complex datasets and presents them in a clear, visual format.
Why Do Bioinformatics Companies Need a Dashboard?
Bioinformatics companies deal with research, genomics data, clinical trials, and financial metrics. Because of this complexity, managing data manually becomes extremely challenging.
However, with a Power BI dashboard, you can:
- Centralize all your data in one place
- Track KPIs in real time
- Identify trends quickly
- Improve decision-making
- Enhance operational efficiency
In addition, the dashboard allows stakeholders to access insights instantly, which improves collaboration across teams.
Key Features of Bioinformatics Companies Dashboard in Power BI
This dashboard comes with 5 powerful pages, each designed to provide specific insights. Let’s explore them one by one.
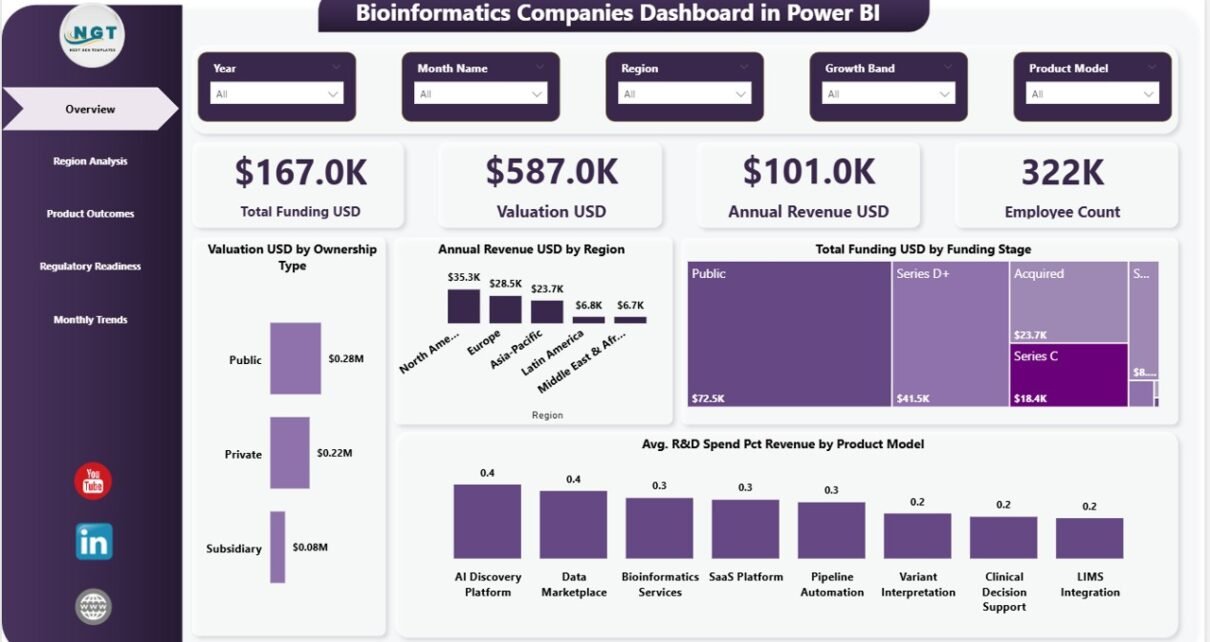
Overview Page – What Does It Show?
The Overview Page serves as the main dashboard where you get a high-level summary of business performance.
KPI Cards Included:
- Total Funding (USD)
- Valuation (USD)
- Annual Revenue (USD)
- Employee Count
These KPI cards provide a quick snapshot of the company’s financial and operational health.
Charts Available:
- Valuation (USD) by Headquarters City
- Annual Revenue (USD) by Region
- Total Funding (USD) by Funding Stage
- Avg. R&D Spend (% of Revenue) by Product Model
Because of these visuals, you can instantly understand where your company stands.
Additionally, slicers (filters) allow you to view data based on specific regions, product models, or time periods.

Click to buy Bioinformatics Companies Dashboard in Power BI
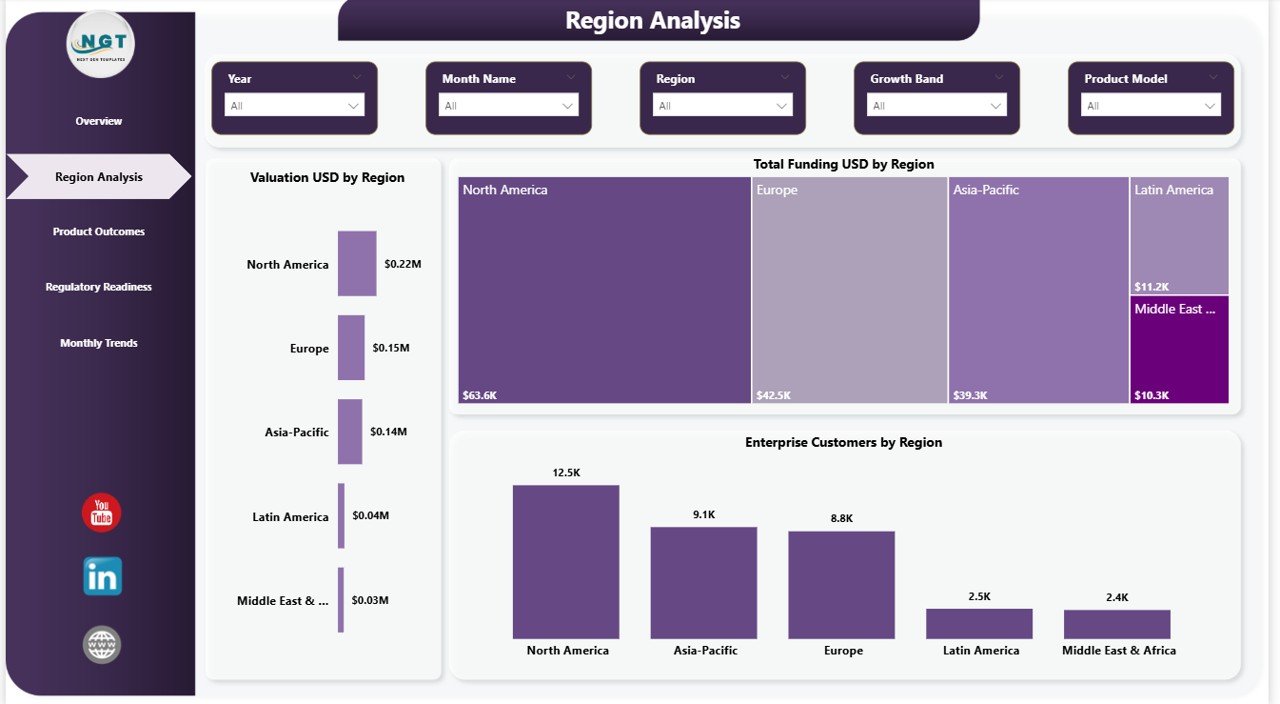
Region Analysis – How Does It Help?
The Region Analysis Page focuses on geographical performance. Therefore, it helps you identify which regions contribute the most to your growth.
Key Charts:
- Valuation (USD) by Region
- Total Funding (USD) by Region
- Enterprise Customers by Region
With these charts, you can:
- Compare regional performance
- Identify high-growth markets
- Allocate resources effectively
Moreover, this page helps you discover untapped opportunities in emerging markets.
Click to buy Bioinformatics Companies Dashboard in Power BI
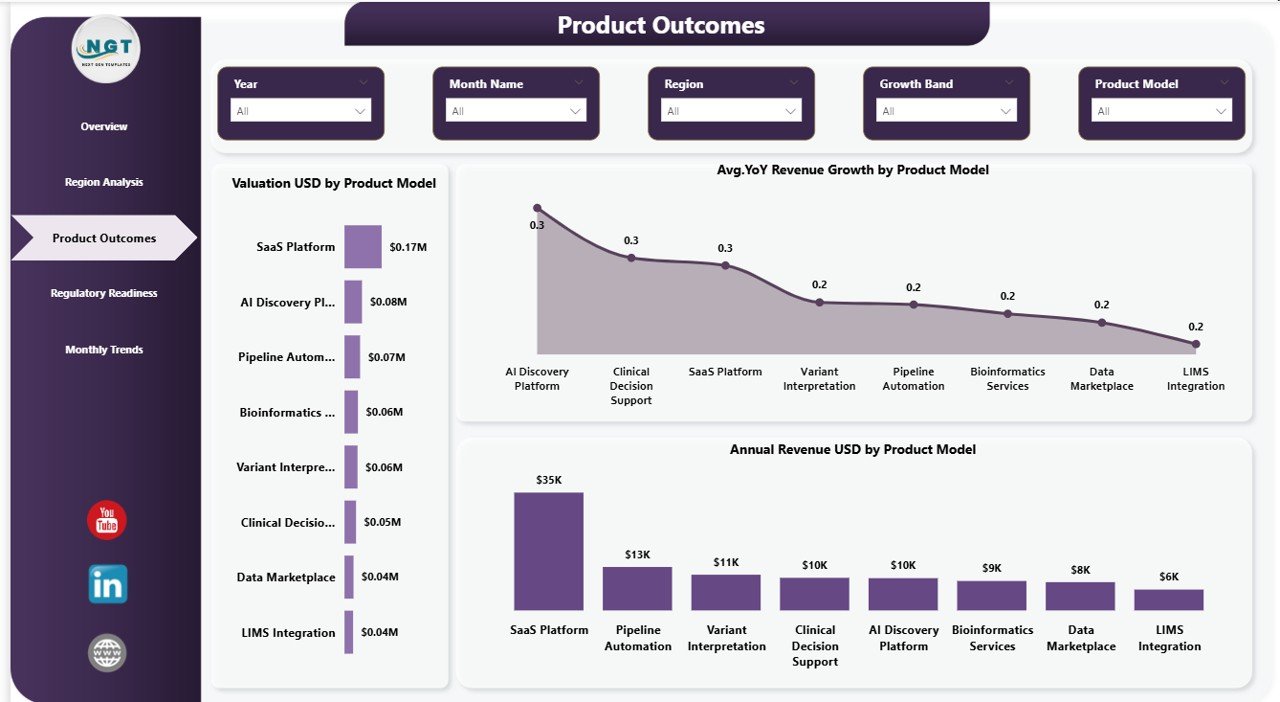
Product Model Analysis – Why Is It Important?
The Product Model Analysis Page provides insights into how different product models perform.
Charts Included:
- Valuation (USD) by Product Model
- Avg. YoY Revenue Growth (%) by Product Model
- Annual Revenue (USD) by Product Model
Because bioinformatics companies often offer multiple solutions, this analysis becomes critical.
As a result, you can:
- Identify top-performing product lines
- Optimize product strategy
- Improve profitability
Click to buy Bioinformatics Companies Dashboard in Power BI
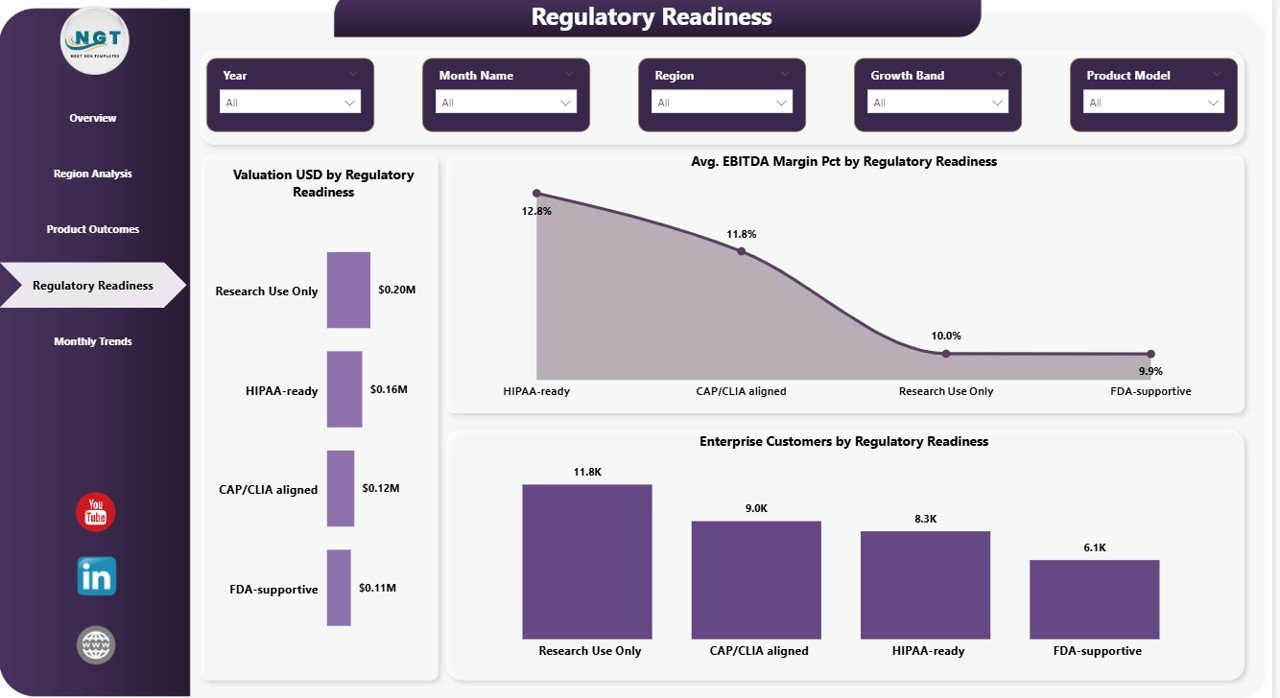
Regulatory Readiness – What Insights Can You Get?
Regulatory compliance plays a huge role in bioinformatics. Therefore, this page focuses on how companies perform based on regulatory readiness levels.
Key Charts:
- Valuation (USD) by Regulatory Readiness
- Avg. EBITDA Margin (%) by Regulatory Readiness
- Enterprise Customers by Regulatory Readiness
With this page, you can:
- Understand the impact of compliance on valuation
- Evaluate financial performance
- Identify areas for improvement
In addition, it helps organizations align their strategies with regulatory requirements.
Click to buy Bioinformatics Companies Dashboard in Power BI
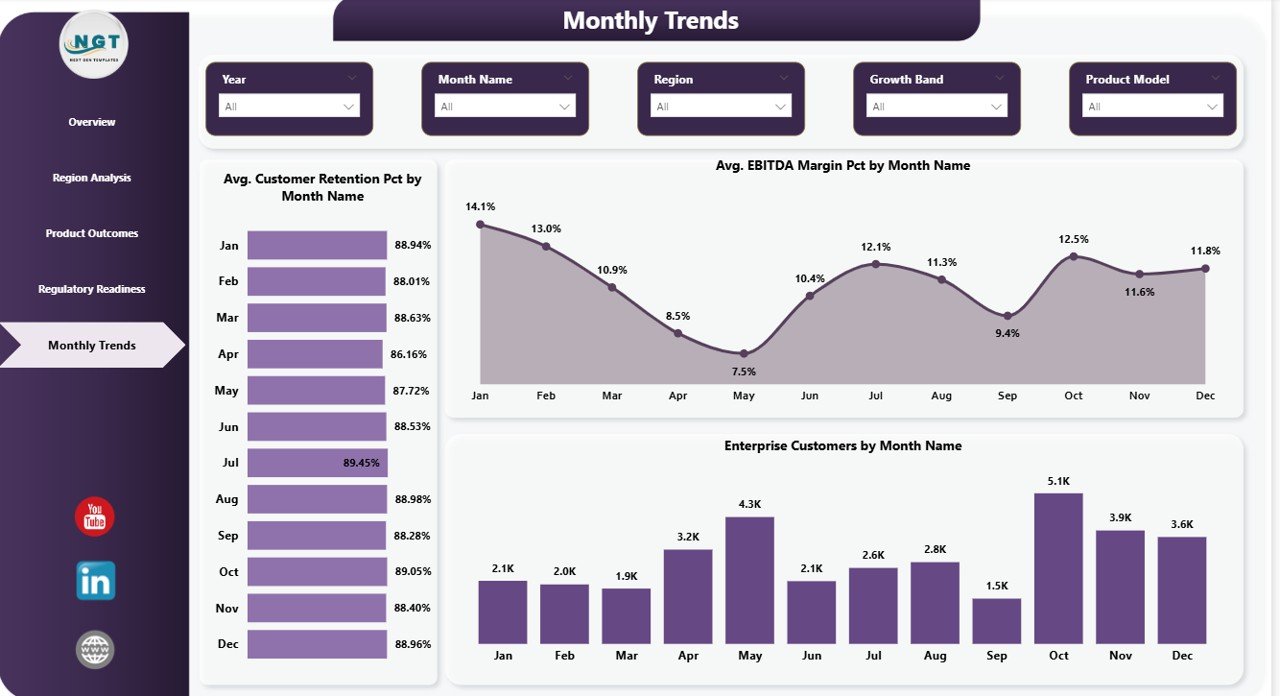
Monthly Trends – How Can You Track Growth Over Time?
The Monthly Trends Page provides time-based insights. Therefore, it helps you track performance trends month by month.
Charts Included:
- Avg. Customer Retention (%) by Month
- Avg. EBITDA Margin (%) by Month
- Enterprise Customers by Month
Because trends play a crucial role in decision-making, this page becomes highly valuable.
You can:
- Identify seasonal patterns
- Monitor growth trends
- Adjust strategies accordingly
Click to buy Bioinformatics Companies Dashboard in Power BI
What Makes Power BI the Best Tool for This Dashboard?
Power BI offers several advantages that make it ideal for bioinformatics dashboards.
- Interactive visuals
- Real-time data updates
- Easy integration with multiple data sources
- User-friendly interface
- Advanced analytics capabilities
Therefore, it becomes a perfect solution for data-driven organizations.
Advantages of Bioinformatics Companies Dashboard in Power BI
Using this dashboard offers multiple benefits. Let’s explore them in detail.
Improved Decision-Making
- You get real-time insights
- You can act quickly on trends
- You reduce guesswork
Better Data Visualization
- Complex data becomes easy to understand
- Visual charts improve clarity
- Insights become actionable
Time-Saving
- You avoid manual reporting
- You automate calculations
- You generate reports instantly
Enhanced Strategic Planning
- You identify growth opportunities
- You allocate resources efficiently
- You optimize business strategies
Increased Transparency
- All stakeholders see the same data
- You improve accountability
- You ensure data consistency
Best Practices for the Bioinformatics Companies Dashboard in Power BI
To get the most out of your dashboard, you should follow these best practices.
Keep Data Clean and Structured
- Use consistent formats
- Avoid duplicate records
- Validate your data regularly
use Meaningful KPIs
- Focus on business-critical metrics
- Avoid unnecessary data
- Keep dashboards simple
Optimize Visual Design
- Use clear labels
- Avoid clutter
- Maintain consistency
Leverage Slicers Effectively
- Add filters for better analysis
- Enable dynamic reporting
- Improve user experience
Update Data Regularly
- Ensure real-time accuracy
- Schedule automatic refresh
- Monitor data quality
Focus on User Experience
- Keep navigation simple
- Use intuitive layouts
- Provide clear insights
How Can This Dashboard Improve Business Performance?
This dashboard plays a key role in improving overall business performance.
Because it provides real-time insights, you can:
- Track financial growth
- Monitor operational efficiency
- Improve customer retention
- Optimize product performance
Moreover, it helps you identify gaps and take corrective actions quickly.
Who Can Benefit from This Dashboard?
This dashboard proves useful for multiple professionals:
- Bioinformatics Companies
- Healthcare Analysts
- Data Scientists
- Business Analysts
- Investors and Stakeholders
- Research Organizations
Therefore, anyone working with bioinformatics data can benefit from it.
How to Use the Bioinformatics Dashboard Effectively?
Follow these simple steps to use the dashboard:
- Load your dataset into Power BI
- Connect your data sources
- Apply necessary transformations
- Use slicers to filter data
- Analyze charts and KPIs
- Generate insights for decision-making
As you continue using it, you will gain deeper insights and improve your strategy.
Common Challenges and How to Overcome Them
Even though this dashboard is powerful, you may face some challenges.
Data Integration Issues
Solution: Use Power BI connectors effectively
Poor Data Quality
Solution: Clean and validate data regularly
Overloaded Dashboard
Solution: Focus on essential KPIs
Lack of Insights
Solution: Use advanced analytics features
Future Scope of Bioinformatics Dashboards
The future of bioinformatics dashboards looks promising.
Because of advancements in AI and machine learning:
- Predictive analytics will improve
- Real-time monitoring will become more advanced
- Data visualization will become smarter
Therefore, companies that adopt dashboards early will gain a competitive advantage.
Conclusion
The Bioinformatics Companies Dashboard in Power BI is a powerful tool that simplifies complex data and transforms it into actionable insights.
It not only improves decision-making but also enhances operational efficiency. Moreover, it allows companies to track performance across regions, products, and time.
If you want to stay ahead in the competitive bioinformatics industry, then investing in a well-designed dashboard becomes essential.
Frequently Asked Questions (FAQs)
- What is the main purpose of this dashboard?
The main purpose is to track and analyze key business metrics like funding, valuation, revenue, and customer growth.
- Can I customize this dashboard?
Yes, you can easily customize it based on your business requirements.
- Is Power BI suitable for bioinformatics data?
Yes, Power BI handles large datasets and complex analytics effectively.
- How often should I update the dashboard?
You should update it regularly or set automatic refresh for real-time insights.
- Do I need technical skills to use this dashboard?
Basic Power BI knowledge helps, but the dashboard remains user-friendly.
- Can this dashboard support decision-making?
Yes, it provides real-time insights that help in making informed decisions.
- What type of data can I use in this dashboard?
You can use financial, operational, customer, and research data.
Visit our YouTube channel to learn step-by-step video tutorials
Click to buy Bioinformatics Companies Dashboard in Power BI