The biotechnology industry is one of the most data-driven sectors in the world. From clinical trials and research development to regulatory filings and production costs, every decision depends on accurate and timely data. However, managing and interpreting this vast amount of information can be challenging without proper visualization tools.
That’s where the Biotechnology Dashboard in Power BI comes in.
This ready-to-use, interactive dashboard transforms complex datasets into meaningful visuals. It helps researchers, finance teams, and executives understand trends, monitor costs, and track project performance — all in one place.
In this article, we’ll explore everything about the Biotechnology Dashboard in Power BI, including its key features, detailed page analysis, advantages, best practices, and frequently asked questions.
Click to Purchases Biotechnology Dashboard in Power BI
What Is a Biotechnology Dashboard in Power BI?
A Biotechnology Dashboard in Power BI is a comprehensive visual analytics solution designed to monitor, analyze, and present biotechnology-related data. It connects data from Excel or other sources and provides real-time insights through dynamic visuals such as charts, cards, and slicers.
Using this dashboard, professionals can:
-
Track R&D costs, clinical trip expenses, and regulatory filing costs
-
Compare data across departments, regions, and project types
-
Monitor approval percentages and pending statuses
-
Identify performance trends over different months
It turns raw numbers into actionable intelligence that supports decision-making and improves overall efficiency.
Why Power BI Is Perfect for Biotechnology Data
Power BI by Microsoft is one of the most powerful business intelligence tools available. For biotechnology organizations, Power BI offers several benefits:
-
Integration with Excel and Databases: Seamlessly import data from multiple sources like research systems, accounting software, or lab management tools.
-
Real-time Updates: Refresh data automatically and make quick decisions.
-
Custom Visuals: Use bar charts, cards, and slicers for detailed and comparative views.
-
Collaboration: Share insights with team members, departments, and stakeholders.
-
Scalability: Handle small to enterprise-level datasets easily.
Structure of the Biotechnology Dashboard in Power BI
The Biotechnology Dashboard consists of five powerful pages, each designed to analyze different aspects of the business. Let’s explore them one by one.
Overview Page
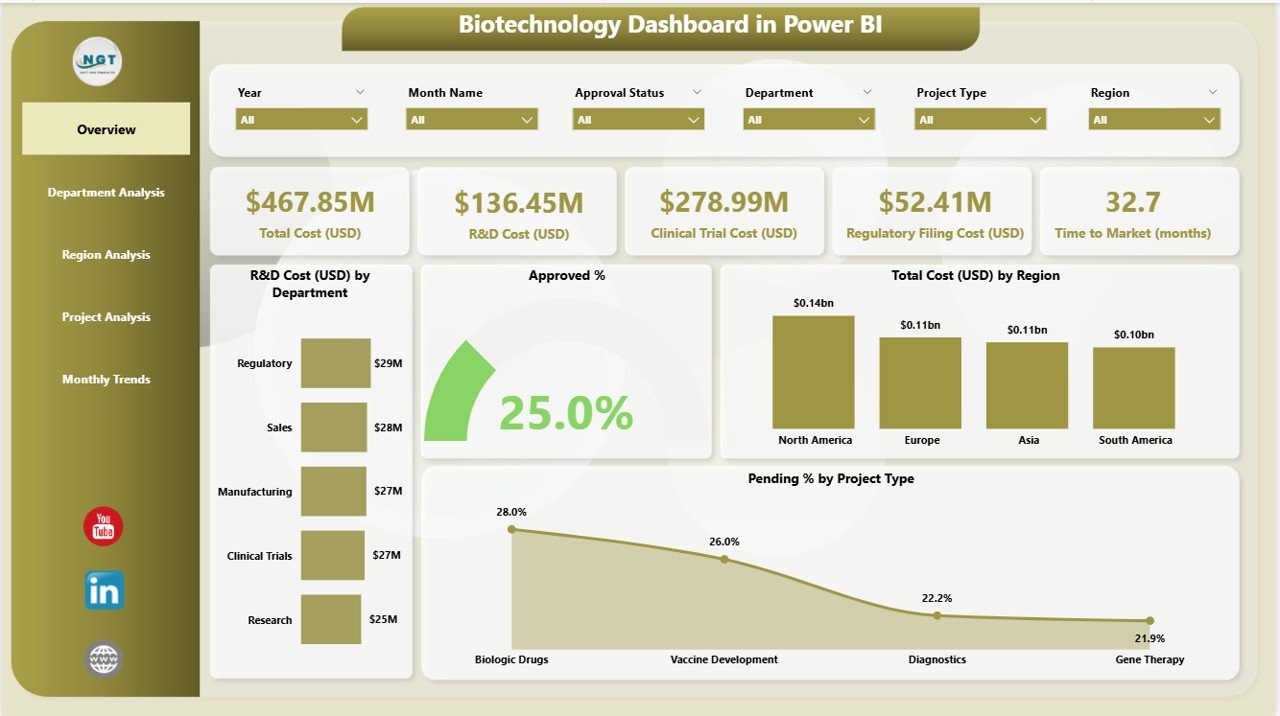
The Overview Page is the starting point of the dashboard. It gives a snapshot of the organization’s biotechnology operations.
Key Components:
Five Cards:
- Total R&D Cost (USD)
- Approved %
- Total Cost (USD) by Region
- Pending % by Project Type
- Overall Project Count
Four Charts:
- R&D Cost (USD) by Department
- Approved %
- Total Cost (USD) by Region
- Pending % by Project Type
This page helps management quickly identify where money is being spent and how efficiently projects are progressing. By using the slicers on the left panel, users can filter by year, department, or project type to customize the analysis.
Department Analysis Page
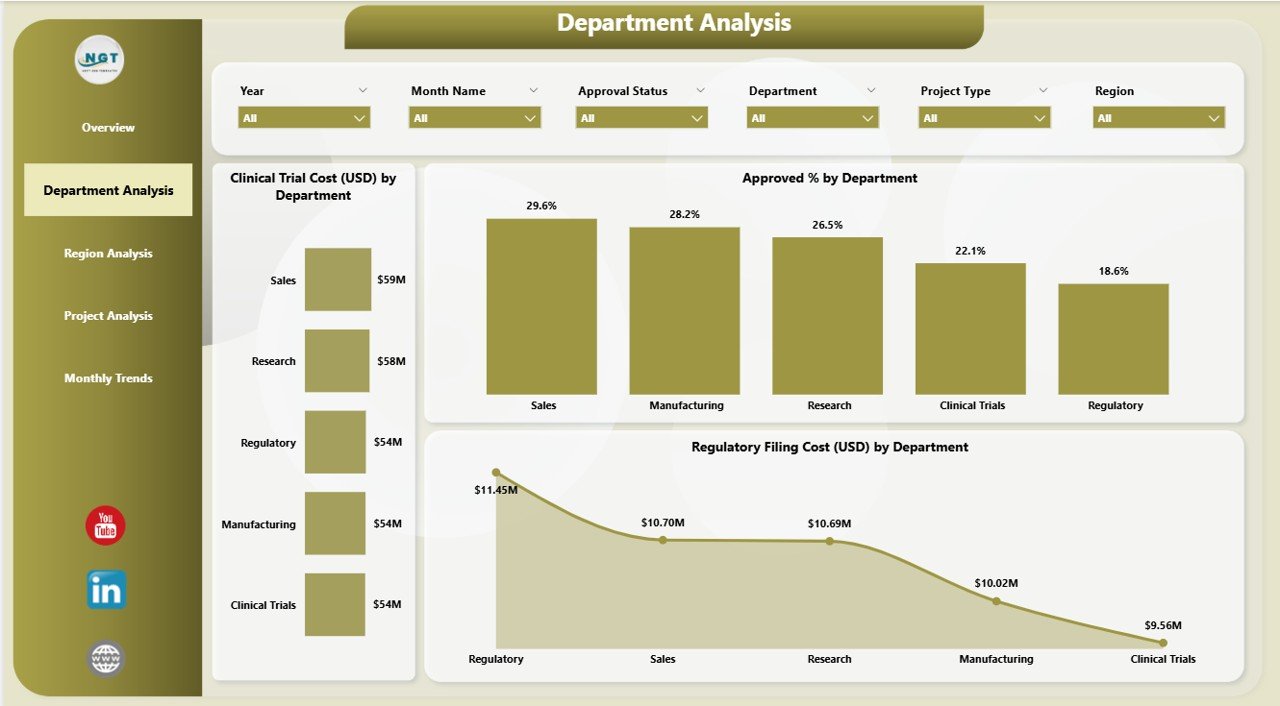
The Department Analysis Page dives deeper into department-level insights. It’s essential for understanding how different units contribute to research and operations.
Main Charts:
-
Clinical Trip Cost (USD) by Department
-
Approved % by Department
-
Regulatory Filing Cost (USD) by Department
These visuals help decision-makers assess performance and spending patterns within specific departments such as Research, Quality Control, Clinical Trials, and Manufacturing.
Use Case Example:
If the Research Department shows high filing costs but a low approval percentage, it might indicate a need for better process optimization or training programs.
Region Analysis Page
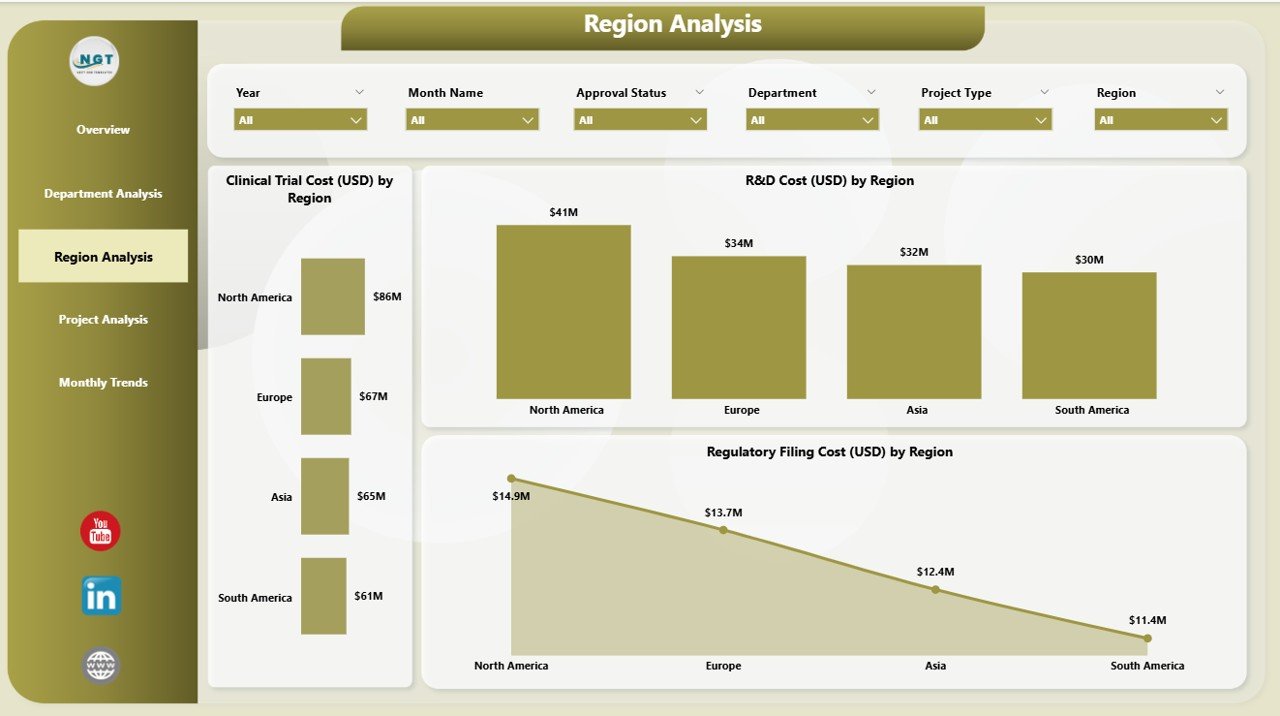
The Region Analysis Page focuses on geographical insights. Since biotechnology often operates globally, understanding regional performance is crucial.
Key Charts:
-
Clinical Trip Cost (USD) by Region
-
Filing Cost (USD) by Region
-
R&D Cost (USD) by Region
With these charts, management can identify which regions are performing efficiently and which need cost control measures.
For example, if Europe shows high clinical trip costs compared to Asia, deeper analysis can reveal if the difference is due to travel policies, research site costs, or resource allocation.
Click to Purchases Biotechnology Dashboard in Power BI
Project Analysis Page
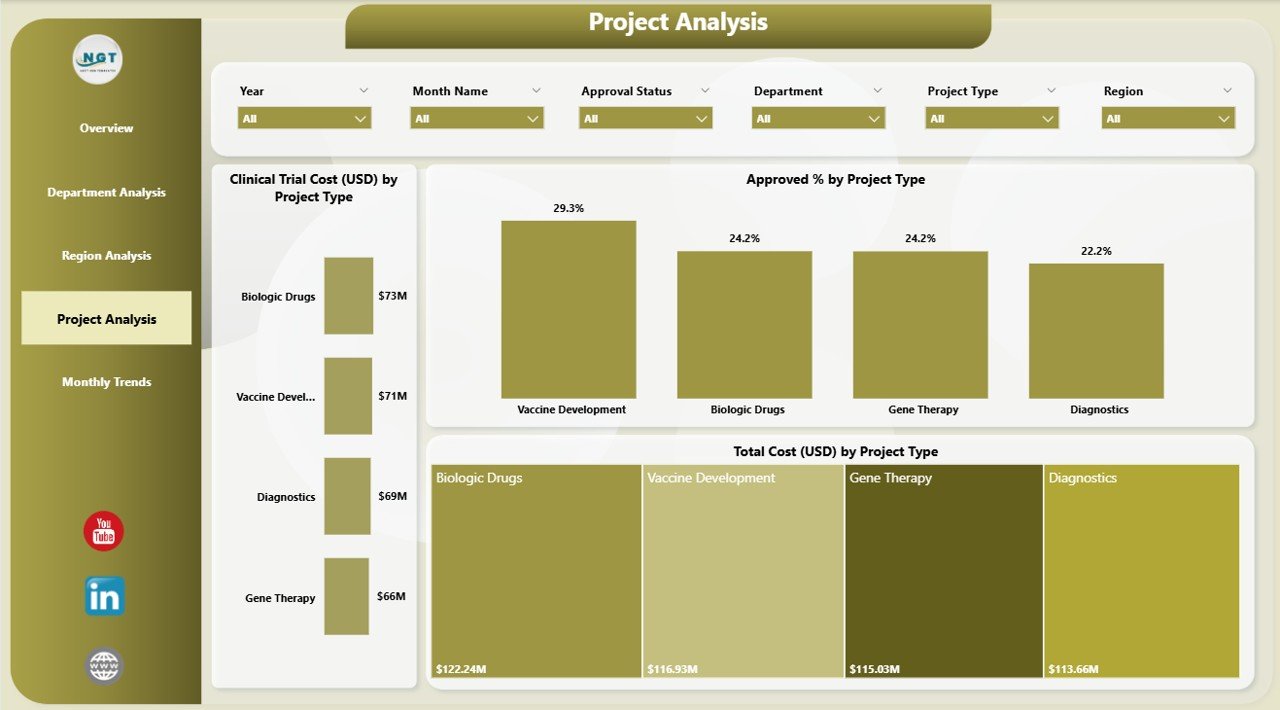
The Project Analysis Page provides a complete view of various biotechnology projects. It helps track approval rates, costs, and progress across multiple project types such as drug discovery, vaccine development, or diagnostics.
Charts Included:
-
Clinical Trip Cost (USD) by Project Type
-
Approved % by Project Type
-
Total Cost (USD) by Project Type
This page allows users to compare how different projects perform against budgets and expectations.
Leaders can filter the dashboard by project type to view specific details — enabling better planning and resource distribution.
Monthly Trends Page
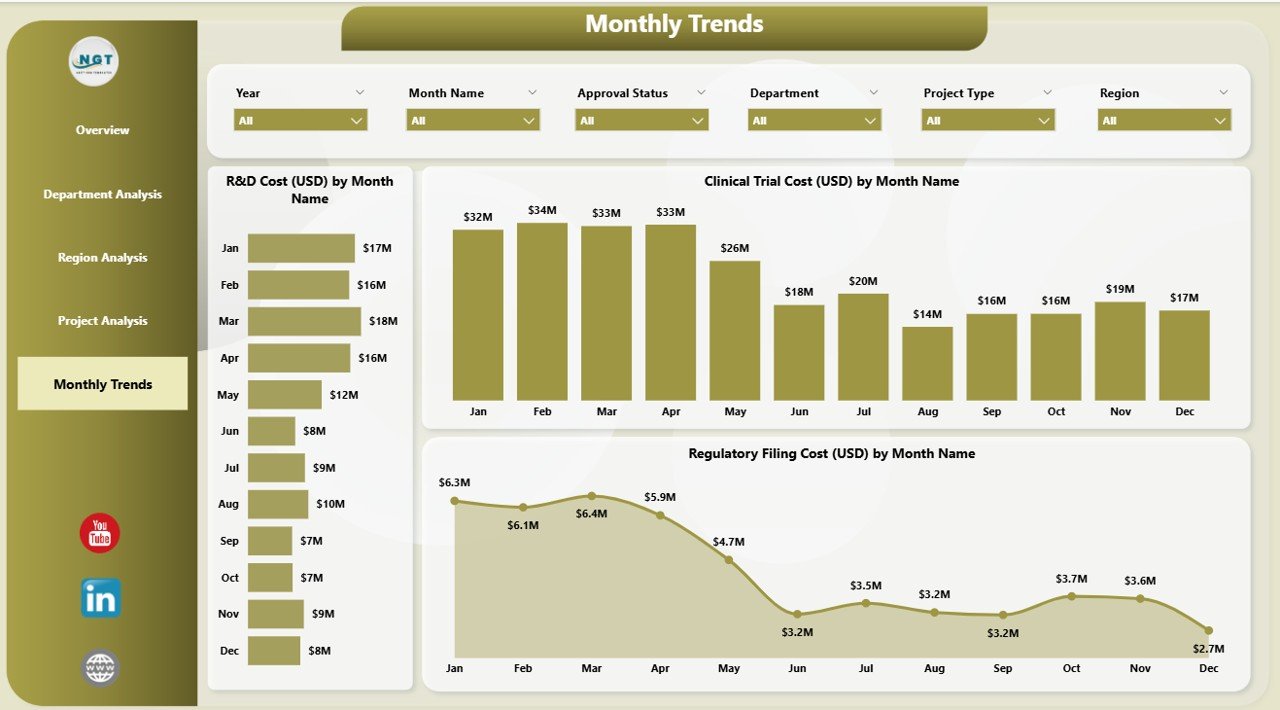
The Monthly Trends Page highlights cost and performance changes over time.
It helps managers and analysts track progress and seasonal patterns.
Charts Featured:
-
R&D Cost (USD) by Month
-
Clinical Trip Cost (USD) by Month
-
Regulatory Filing Cost (USD) by Month
By visualizing these trends, organizations can forecast future expenses, plan research cycles, and evaluate whether performance is improving month by month.
How the Biotechnology Dashboard Works
The dashboard connects to an Excel data source that stores detailed information about costs, approvals, projects, and regions. Once the connection is established, Power BI automatically updates all visuals when the Excel data changes.
Process Flow:
-
Data Input:
Collect cost and approval data from Excel or ERP systems. -
Data Cleaning:
Ensure consistency in department names, regions, and project types. -
Visualization:
Use Power BI visuals like cards, clustered bar charts, and line graphs. -
Analysis and Insights:
Apply filters, compare performance, and share findings with teams. -
Decision-Making:
Use insights to reduce costs, improve processes, and enhance research quality.
This process ensures accuracy, transparency, and continuous improvement across all biotechnology activities.
Advantages of Biotechnology Dashboard in Power BI
Implementing a Biotechnology Dashboard in Power BI brings numerous benefits to an organization. Let’s explore them in detail:
1. Real-Time Monitoring
Power BI allows instant visibility into current performance metrics. Managers can track R&D spending, project approvals, and filing progress without waiting for manual reports.
2. Cost Control
By comparing department or regional costs side by side, finance teams can identify overspending areas and take corrective action immediately.
3. Data-Driven Decisions
With accurate visuals and insights, leadership teams can make informed decisions rather than relying on assumptions.
4. Time Savings
Automated data refreshes and ready-to-use visuals reduce the time spent preparing reports manually.
5. Enhanced Collaboration
Teams across departments and regions can access the same data source, ensuring alignment and transparency.
6. Predictive Insights
Historical trend analysis enables organizations to forecast upcoming expenses and resource requirements effectively.
7. Easy Customization
The dashboard layout can be customized according to user needs — add more visuals, KPIs, or filters based on the project scope.
8. Improved Accountability
Tracking departmental and regional data ensures everyone is responsible for their performance and budget utilization.
Importance of Data Visualization in Biotechnology
Click to Purchases Biotechnology Dashboard in Power BI
In biotechnology, data is everywhere — clinical trials, R&D, finance, compliance, and production. Without effective visualization, understanding these large datasets becomes almost impossible.
Why Visualization Matters:
-
Converts raw data into actionable insights
-
Helps identify hidden trends and correlations
-
Simplifies complex relationships among metrics
-
Enhances communication across technical and non-technical teams
Power BI’s interactive dashboards ensure that even non-analysts can interpret and act on the data efficiently.
Best Practices for Using the Biotechnology Dashboard in Power BI
To get maximum benefit from your dashboard, follow these proven best practices:
✅ 1. Maintain Data Accuracy
Ensure that the source Excel files are always up-to-date and error-free. Accurate data equals reliable insights.
✅ 2. Use Consistent Naming Conventions
Keep uniform names for departments, regions, and projects to avoid confusion in filters and visuals.
✅ 3. Refresh Data Regularly
Schedule automatic data refreshes so that stakeholders always see the latest numbers.
✅ 4. Utilize Slicers Effectively
Slicers help users filter data dynamically. Use them to switch between months, departments, or project types quickly.
✅ 5. Add Conditional Formatting
Color-coded visuals highlight performance status — for example, green for approved, yellow for pending, and red for delayed.
✅ 6. Document KPI Definitions
Create a reference sheet or tooltip explaining each KPI (like R&D Cost, Approved %, etc.) so that everyone interprets data consistently.
✅ 7. Protect Sensitive Data
If the dashboard contains confidential information, apply Power BI’s role-level security to restrict access.
✅ 8. Encourage Regular Review Meetings
Use the dashboard during weekly or monthly performance meetings to drive discussions and decisions.
How to Customize the Biotechnology Dashboard for Your Organization
Although this dashboard is ready to use, customization enhances its value:
-
Add New KPIs: Include metrics like ROI on R&D, Average Approval Time, or Cost per Clinical Trip.
-
Integrate More Data Sources: Connect with ERP, CRM, or laboratory systems for broader insights.
-
Change Themes: Apply corporate branding colors and logos for a professional appearance.
-
Enable Drill-Through Reports: Let users click on visuals to open detailed project or department views.
-
Add Forecasting Lines: Use Power BI analytics tools to predict future performance trends.
These modifications help tailor the dashboard to fit unique business needs.
Real-World Applications of the Dashboard
The Biotechnology Dashboard in Power BI serves multiple stakeholders:
-
Researchers: Track funding, trial progress, and resource allocation.
-
Finance Teams: Analyze departmental spending and optimize budgets.
-
Project Managers: Monitor project approval and cost efficiency.
-
Executives: Gain a holistic view of company performance across regions.
-
Compliance Teams: Track regulatory filings and approval timelines.
In short, this dashboard empowers every level of the organization to make smarter, data-driven decisions.
Conclusion
The Biotechnology Dashboard in Power BI is a game-changer for organizations seeking to improve visibility, control costs, and accelerate decision-making in the biotech field.
It transforms raw data into compelling insights, making complex information accessible to everyone — from researchers to executives.
With its five analytical pages — Overview, Department, Region, Project, and Monthly Trends — it ensures 360-degree monitoring of performance and expenditure.
When used strategically, this dashboard not only enhances transparency but also drives innovation and operational excellence.
Frequently Asked Questions (FAQs)
1. What is the main purpose of the Biotechnology Dashboard in Power BI?
The dashboard helps organizations visualize R&D, clinical, and regulatory data efficiently. It converts raw Excel data into easy-to-understand visuals for faster and better decision-making.
2. Who can use this dashboard?
Researchers, finance managers, project coordinators, and executives in biotechnology companies can use this dashboard to track performance and monitor costs.
3. Can I modify the visuals or add new KPIs?
Yes. Power BI allows full customization. You can edit visuals, change colors, and add or remove KPIs according to your business requirements.
4. How often should I update the data?
You should refresh the data regularly — daily or weekly — depending on how frequently your source data changes. Automated refresh schedules ensure accuracy.
5. What skills do I need to use this dashboard?
You don’t need advanced technical skills. Basic knowledge of Excel and Power BI navigation is enough to use and interpret the visuals effectively.
6. Can this dashboard handle large datasets?
Yes. Power BI can easily process thousands or even millions of data rows without performance issues, making it suitable for large biotech organizations.
7. Is Power BI better than Excel for visualization?
Yes. While Excel is excellent for data entry and basic analysis, Power BI provides interactive visuals, automated refresh, and real-time collaboration — features that Excel alone cannot match.
8. How can this dashboard improve research efficiency?
By tracking key cost areas and approval percentages, the dashboard helps identify bottlenecks and inefficiencies, allowing teams to optimize operations.
9. Can I share the dashboard with others?
Yes. Power BI supports secure sharing within your organization or externally through Power BI Service. You can also embed dashboards in reports or websites.
10. Where can I get a ready-to-use Biotechnology Dashboard in Power BI?
You can download a pre-built, fully functional Biotechnology Dashboard in Power BI from trusted sources like NextGenTemplates.com, where it’s designed to work right out of the box.
Visit our YouTube channel to learn step-by-step video tutorials
Click to Purchases Biotechnology Dashboard in Power BI
Watch the step-by-step video tutorial: