In the modern biotechnology landscape, data is the foundation of every breakthrough. From laboratory research and production efficiency to compliance and clinical outcomes, every process generates valuable insights. Yet, managing this data effectively can be overwhelming without a proper system in place.
That’s where the Biotechnology KPI Scorecard in Excel comes into play. This ready-to-use template provides a structured, visual, and interactive way to measure and analyze your key performance indicators (KPIs). It transforms raw numbers into actionable insights — enabling biotech professionals to monitor performance, identify trends, and make informed decisions faster.
What Is a Biotechnology KPI Scorecard in Excel?
A Biotechnology KPI Scorecard is an Excel-based performance tracking tool designed to evaluate critical aspects of biotech operations. It helps research labs, manufacturing units, and biotech firms assess how effectively they meet scientific, operational, and business goals.
Using Excel as the foundation provides a simple, cost-effective, and customizable way to manage KPIs. With formulas, charts, and automation features, users can track monthly and yearly trends without investing in complex software.
This scorecard allows teams to monitor performance in real time, analyze deviations from targets, and ensure that critical metrics — such as productivity, quality, and compliance — stay on track.
Click to Purchases Biotechnology KPI Scorecard in Excel
Why Biotechnology Companies Need a KPI Scorecard
In biotechnology, every percentage point matters. A single deviation can affect research timelines, production quality, or regulatory compliance. Having a KPI scorecard ensures visibility across every function. It enables leaders to:
-
Measure performance against set benchmarks.
-
Identify inefficiencies or bottlenecks.
-
Compare current performance with historical data.
-
Align strategic goals with operational activities.
-
Drive data-driven decision-making across the organization.
When data is visualized clearly, it becomes easier to spot trends, detect problems early, and implement corrective actions promptly.
Key Features of the Biotechnology KPI Scorecard in Excel
This professionally designed Excel template includes four powerful worksheet tabs — each serving a specific purpose to make performance tracking seamless and accurate.
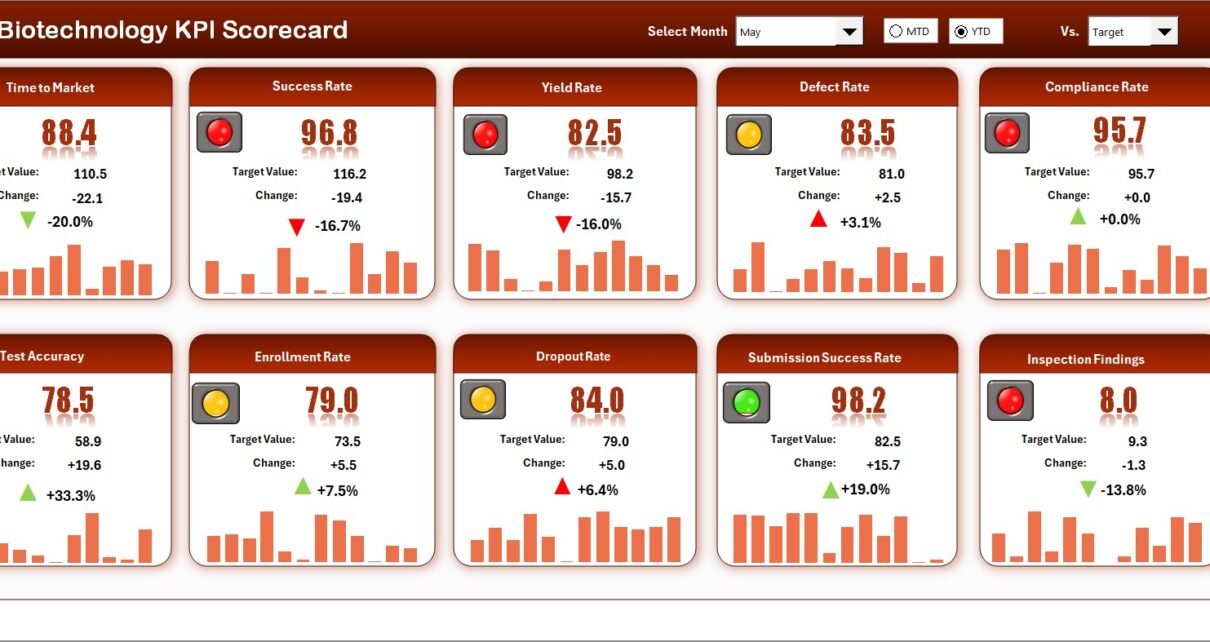
1. Scorecard Sheet
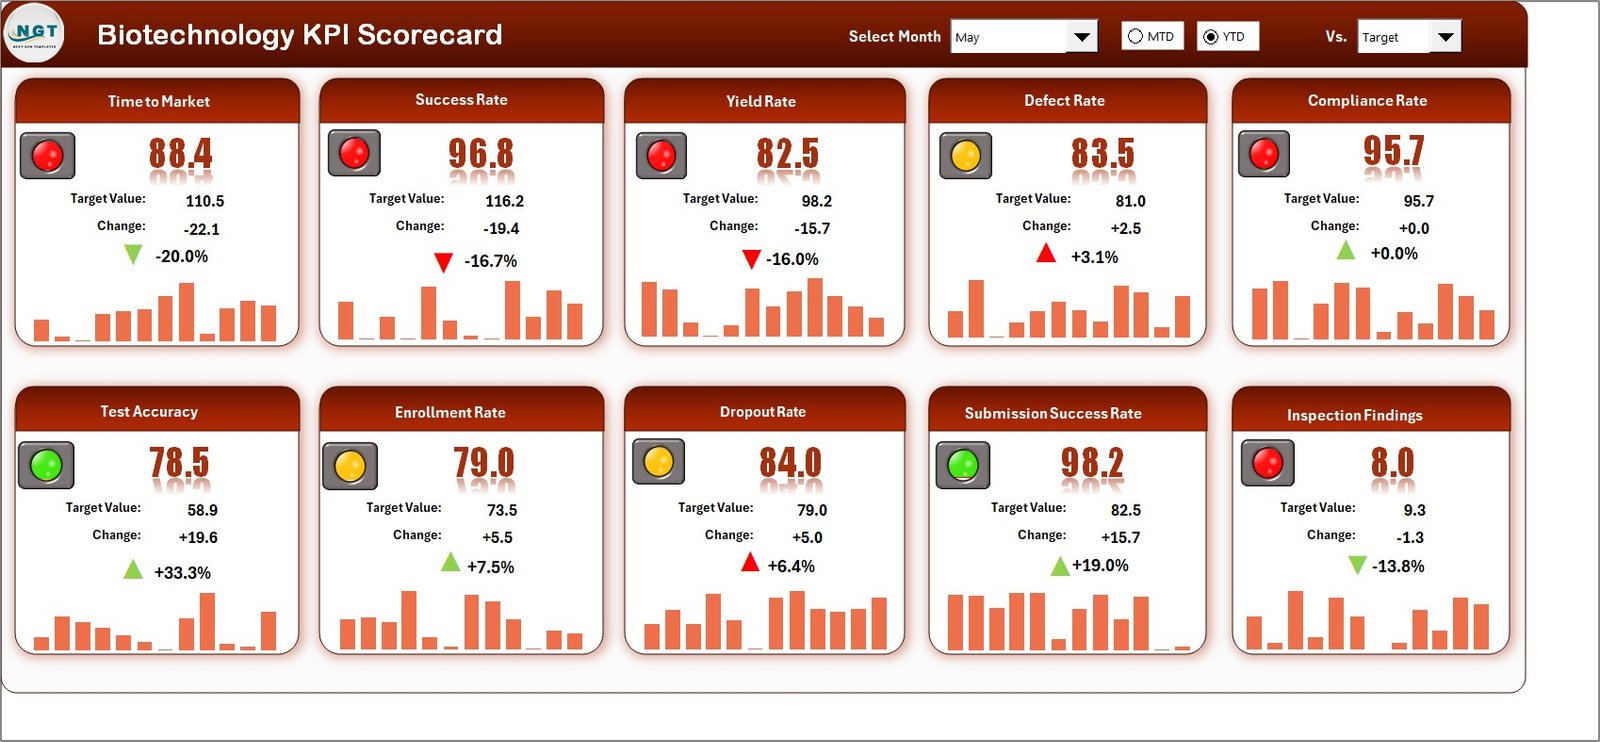
The Scorecard sheet acts as the main control panel for your entire KPI management system. It provides an instant overview of the most important metrics in an organized and visually appealing format.
Key features include:
-
Dropdown Menus: Select the month or choose between MTD (Month-to-Date) and YTD (Year-to-Date) views for in-depth analysis.
-
Actual vs Target Comparison: Instantly compare actual values with targets to evaluate performance for each KPI.
-
Color-Coded Visual Indicators: Conditional formatting helps identify whether performance is on track (green), needs attention (yellow), or requires immediate action (red).
-
Comprehensive KPI Overview: Display MTD and YTD data for all KPIs at once, making trend analysis effortless.
This sheet provides a quick snapshot for management meetings or performance reviews, saving hours of manual analysis.
2. KPI Trend Sheet
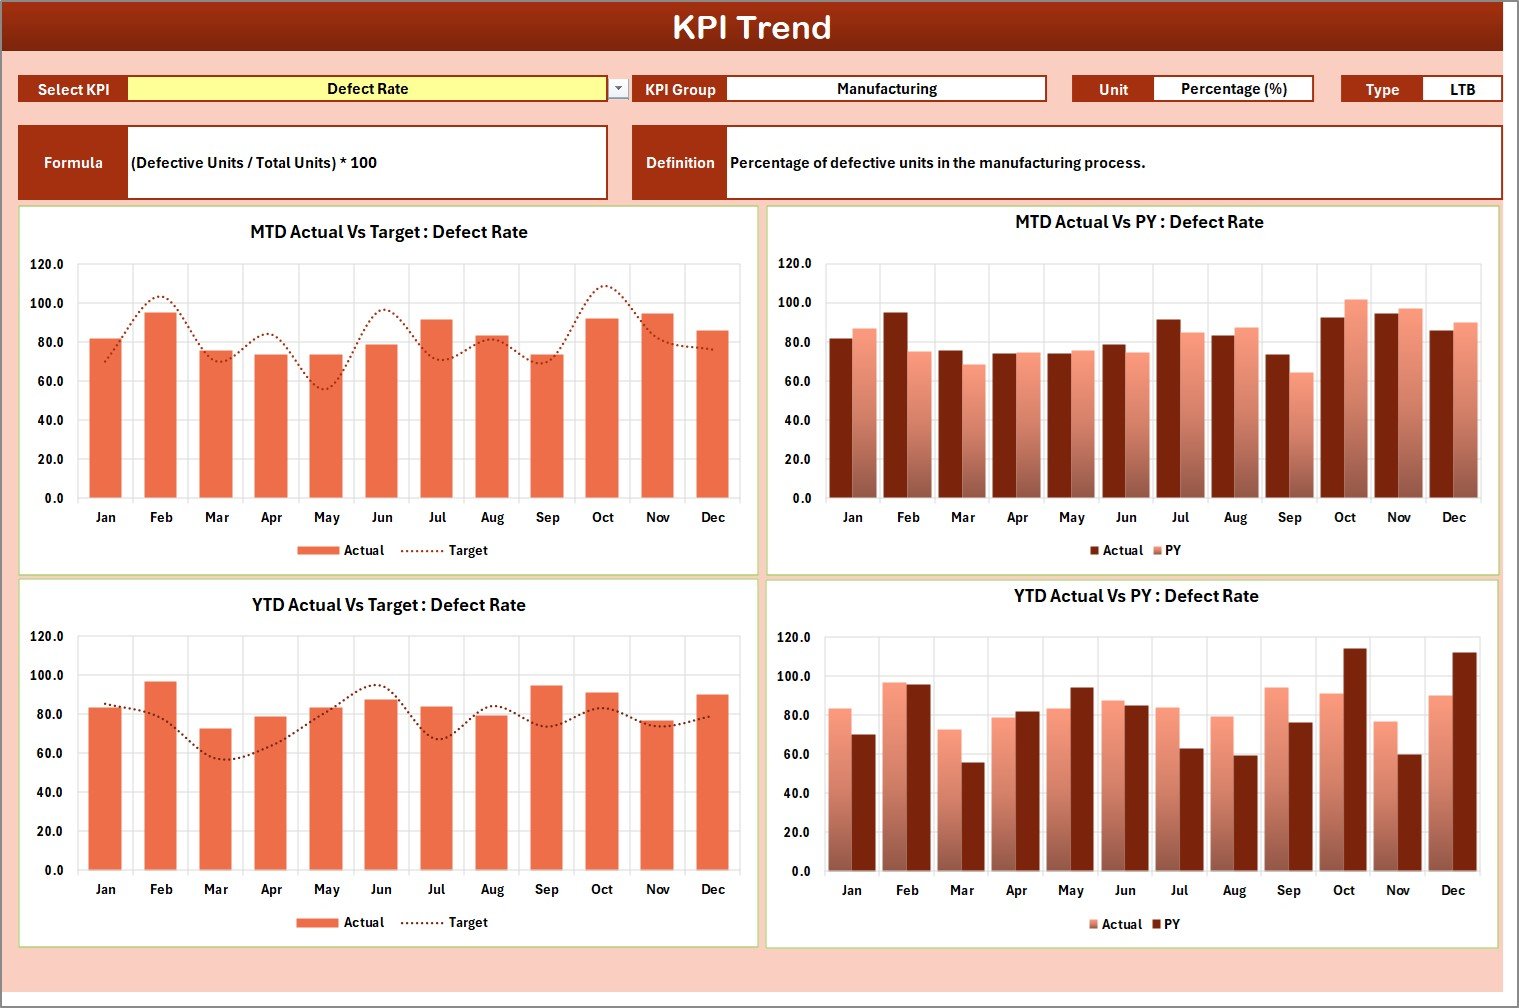
The KPI Trend sheet helps users dive deeper into performance analytics for individual KPIs. It’s an interactive area where users can select a KPI name from a drop-down menu (cell C3) to visualize its monthly performance trends.
Features of the KPI Trend Sheet:
-
KPI Details Display: Automatically shows KPI Group, Unit, Formula, Type (LTB – Lower the Better / UTB – Upper the Better), and Definition.
-
Dynamic Charts: Line and bar charts track MTD and YTD trends for Actual, Target, and Previous Year data.
-
Data-Driven Insights: Identify seasonal patterns, detect deviations early, and adjust targets based on evidence.
This sheet acts as your “microscope” for analyzing how each KPI behaves over time, offering clarity on both short-term and long-term performance.
3. Input Data Sheet
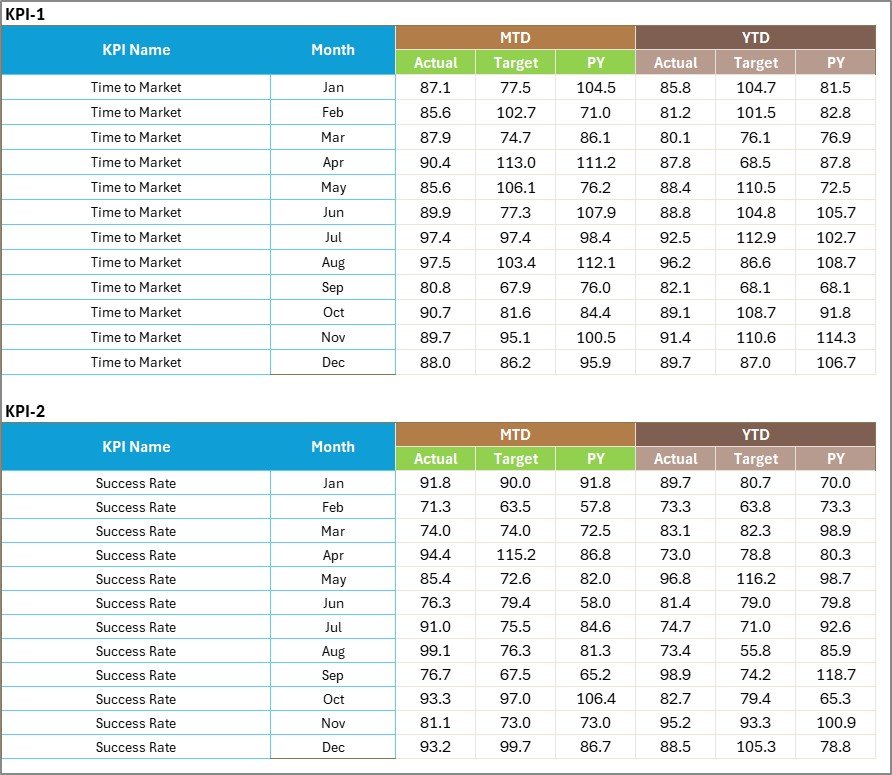
The Input Data sheet is the data engine of your scorecard. It is where all KPI data is recorded, managed, and updated.
Key capabilities:
-
Data Entry Columns: Record Actual, Target, and Previous Year values for every KPI.
-
Flexibility: Update the sheet anytime new data becomes available — Excel automatically refreshes dashboards and charts.
-
Accuracy: Avoid data redundancy or manual calculation errors by maintaining all metrics in one central location.
This sheet keeps your entire reporting system reliable and up to date. It’s ideal for monthly reviews, audits, or continuous improvement programs.
4. KPI Definition Sheet
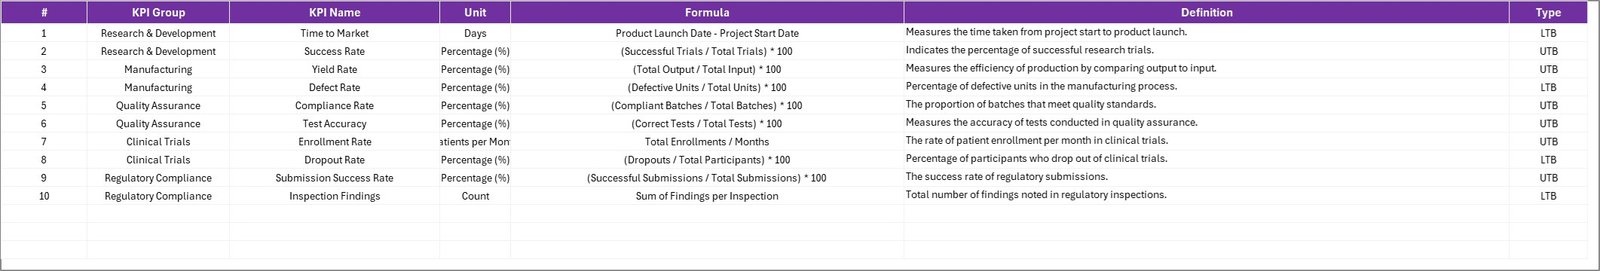
This sheet ensures consistency in how each KPI is understood and measured across the organization.
Key details included:
-
KPI Name and Group: Classify each KPI into logical groups (e.g., Research, Production, Quality, Compliance, or Finance).
-
Unit and Formula: Define the measurement unit (e.g., %, Hours, Units) and the exact formula used for calculation.
-
KPI Definition: Provide a brief explanation so that every stakeholder interprets it correctly.
Maintaining a KPI Definition sheet helps standardize metrics across departments, ensuring transparency and reliability in performance tracking.
Click to Purchases Biotechnology KPI Scorecard in Excel
Example KPIs Used in Biotechnology
A biotechnology company can track several KPIs across departments using this Excel scorecard. Below are some examples:
Research & Development (R&D)
-
Experiment Success Rate (%)
-
New Molecules Developed
-
Average Testing Time (Days)
-
R&D Cost per Project
Production
-
Batch Yield (%)
-
Downtime Hours
-
Equipment Utilization Rate
-
On-Time Batch Completion (%)
Quality Control
-
Compliance Error Rate
-
Defect Rate per Batch
-
Lab Test Accuracy (%)
-
Quality Audit Score
Supply Chain
-
Supplier On-Time Delivery (%)
-
Inventory Turnover Ratio
-
Material Availability Rate
Corporate & Financial
-
Revenue Growth (%)
-
R&D Expenditure as % of Revenue
-
Profit Margin (%)
Tracking these KPIs together offers a holistic view of operational performance — from lab experiments to market delivery.
How to Use the Biotechnology KPI Scorecard Effectively
Follow these steps to make the most of your Excel scorecard:
-
Set Clear KPI Targets: Define measurable and achievable monthly or yearly targets for each KPI.
-
Enter Data Regularly: Update the Input Data sheet consistently to maintain accuracy.
-
Review Trends Monthly: Use the KPI Trend sheet to analyze deviations and progress.
-
Take Corrective Actions: Adjust strategies where performance falls below target.
-
Communicate Insights: Share the Scorecard sheet with team members and decision-makers for transparency.
By following this routine, your biotech organization can shift from reactive to proactive performance management.
Advantages of Using a Biotechnology KPI Scorecard in Excel
The benefits of adopting this scorecard go far beyond data visualization. It becomes a powerful management tool that improves decision-making, collaboration, and accountability.
1. Simplifies Complex Data
Excel’s structure turns thousands of raw data points into clear, meaningful visuals. Anyone can interpret the information, even without technical expertise.
2. Promotes Data-Driven Culture
By displaying performance transparently, teams start basing decisions on numbers rather than assumptions.
3. Enhances Operational Efficiency
Quick comparisons between actual and target values help identify weak spots and streamline improvement efforts.
4. Ensures Regulatory Readiness
Biotechnology firms must follow strict compliance standards. The KPI scorecard helps track quality, safety, and audit readiness metrics easily.
5. Enables Continuous Improvement
When KPIs are measured and reviewed regularly, organizations can continuously refine their processes and reach higher performance standards.
Best Practices for the Biotechnology KPI Scorecard
To maximize the impact of your KPI scorecard, follow these best practices:
✅ Align KPIs with Strategic Goals: Ensure every KPI supports your organization’s scientific, operational, or business objectives.
✅ Keep KPIs Specific and Measurable: Avoid vague indicators — define precise formulas and units.
✅ Use Consistent Data Sources: Rely on standardized data inputs to maintain integrity across all sheets.
✅ Automate Calculations: Utilize Excel formulas and conditional formatting to reduce manual errors.
✅ Review Regularly: Conduct monthly or quarterly performance reviews to assess trends.
✅ Involve Stakeholders: Encourage participation from all departments to ensure ownership of KPIs.
✅ Visualize Clearly: Use charts, color coding, and slicers for a visually appealing presentation.
Following these practices ensures that your Biotechnology KPI Scorecard becomes a living management tool — not just a static report.
How Excel Enhances Biotech KPI Management
Excel remains one of the most flexible tools for KPI management. Here’s why biotech professionals continue to rely on it:
-
User-Friendly Interface: Easy to set up and customize for any biotech function.
-
Cost-Effective: No expensive software licenses or installations needed.
-
Data Control: Full control over formulas, calculations, and chart designs.
-
Compatibility: Integrates seamlessly with other tools and databases.
-
Security Options: Protect sensitive data with passwords and restricted access.
Excel provides the perfect balance of simplicity and power for organizations looking to manage KPIs effectively.
Common Mistakes to Avoid
Even the best templates fail if used incorrectly. Here are common pitfalls to avoid:
❌ Using too many KPIs without clear priorities.
❌ Ignoring data updates or missing months.
❌ Setting unrealistic targets.
❌ Not linking KPIs to overall strategy.
❌ Overcomplicating formulas and visuals.
Avoiding these mistakes ensures your scorecard delivers accurate and actionable insights.
Click to Purchases Biotechnology KPI Scorecard in Excel
Conclusion
The Biotechnology KPI Scorecard in Excel is a powerful, practical solution for biotech organizations seeking to enhance data visibility, efficiency, and accountability.
By combining well-structured data input sheets, trend analysis charts, and standardized KPI definitions, this scorecard provides everything you need to manage performance across R&D, production, and compliance departments.
It bridges the gap between data and decision-making, helping biotech leaders focus on what truly matters — achieving consistent innovation, operational excellence, and sustainable growth.
Frequently Asked Questions (FAQs)
1. What are KPIs in biotechnology?
KPIs (Key Performance Indicators) are measurable metrics used to track the performance of biotech processes, such as research efficiency, production yield, compliance accuracy, and financial outcomes.
2. Why should I use Excel for a Biotechnology KPI Scorecard?
Excel is affordable, widely accessible, and offers powerful analytical tools like charts, pivot tables, and conditional formatting, making it ideal for KPI tracking.
3. Can I customize this KPI Scorecard?
Yes. You can add or remove KPIs, modify formulas, or adjust visuals to align with your organization’s unique goals.
4. How often should I update KPI data?
It’s recommended to update KPI data monthly for MTD analysis and quarterly or yearly for YTD comparisons.
5. What is the difference between MTD and YTD in KPI tracking?
MTD (Month-to-Date) tracks performance for the current month, while YTD (Year-to-Date) shows cumulative performance from the start of the year.
6. How does this scorecard help with compliance?
By regularly tracking KPIs like audit scores and error rates, the scorecard ensures compliance with quality and regulatory standards.
7. Can multiple users access the Excel scorecard?
Yes, you can share the file using cloud platforms like OneDrive or Google Drive, enabling real-time collaboration.
Click to Purchases Biotechnology KPI Scorecard in Excel
Visit our YouTube channel to learn step-by-step video tutorials