In today’s fast-moving media and entertainment industry, broadcasting decisions depend heavily on data. Channels manage hundreds of programs, multiple languages, advertisers, regions, and time slots every single month. However, when this data stays scattered across spreadsheets and manual reports, visibility drops quickly. As a result, teams struggle to understand performance, revenue trends, and audience behavior.
That is exactly why a Broadcasting Dashboard in Excel becomes an essential business tool.
In this detailed article, you will learn what a Broadcasting Dashboard in Excel is, how it works, why broadcasters need it, its dashboard pages, key features, advantages, best practices, and frequently asked questions. By the end, you will clearly understand how this ready-to-use Excel dashboard helps broadcasters move from reactive reporting to proactive decision-making.
Click to Purchases Broadcasting Dashboard in Excel
What Is a Broadcasting Dashboard in Excel?
A Broadcasting Dashboard in Excel is a structured and interactive reporting solution designed to track, analyze, and visualize broadcasting performance in one centralized place.
Instead of reviewing multiple static reports, broadcasters use one Excel dashboard to monitor:
-
TRP ratings
-
Advertisement revenue
-
Total broadcasts
-
Aired and postponed broadcasts
-
Performance by channel, program type, advertiser category, region, and month
Because Excel supports formulas, slicers, pivot tables, and charts, this dashboard delivers real-time insights without complex tools. Moreover, it works perfectly for teams that already rely on Excel for daily operations.
Why Do Broadcasters Need a Broadcasting Dashboard in Excel?
Broadcasting operations generate large volumes of data every day. However, data alone does not create value. Instead, clear insights drive smarter decisions.
Here is why broadcasters need a Broadcasting Dashboard in Excel:
-
First, it provides a single source of truth for all broadcasting KPIs
-
Second, it reduces dependency on manual reporting
-
Third, it highlights revenue and TRP trends instantly
-
Fourth, it supports faster decisions for programming and advertising
-
Finally, it improves coordination between programming, sales, and management teams
Because of these benefits, broadcasters gain control, clarity, and confidence in their performance reviews.
Overview of the Broadcasting Dashboard in Excel
The Broadcasting Dashboard in Excel is a ready-to-use Metro-style dashboard built for Excel desktop users. It comes with a clean layout, interactive slicers, and multiple analytical pages.
Key Highlights of the Dashboard
-
Ready-to-use Excel file
-
Clean and professional Metro design
-
Interactive slicers for filtering data
-
Multiple analytical pages
-
No advanced Excel skills required
Most importantly, the dashboard focuses on actionable insights, not just numbers.
Page Navigator: Easy and Fast Navigation
One of the most useful features of this dashboard is the Page Navigator.
What Does the Page Navigator Do?
-
It sits on the left side of the dashboard
-
It allows one-click navigation across all analytical pages
-
It improves user experience significantly
Because of the Page Navigator, users move between pages smoothly without scrolling or searching. As a result, analysis becomes faster and more intuitive.
Dashboard Structure: 5 Powerful Analytical Pages
The Broadcasting Dashboard in Excel contains 5 well-designed pages, each focused on a specific analysis area. Let’s explore each page in detail.
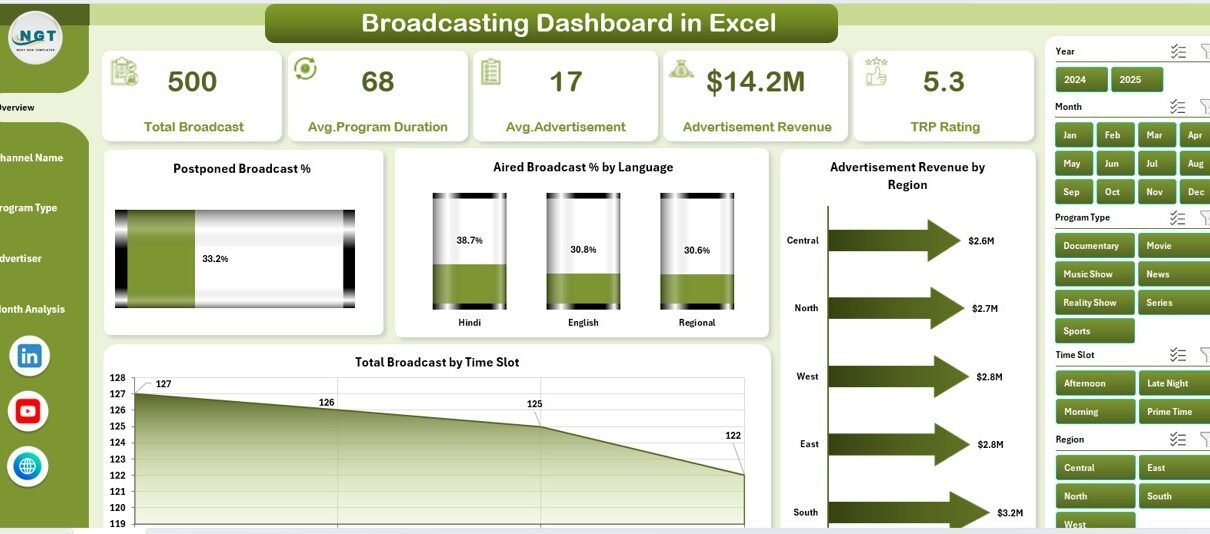
1. Overview Page: High-Level Broadcasting Performance
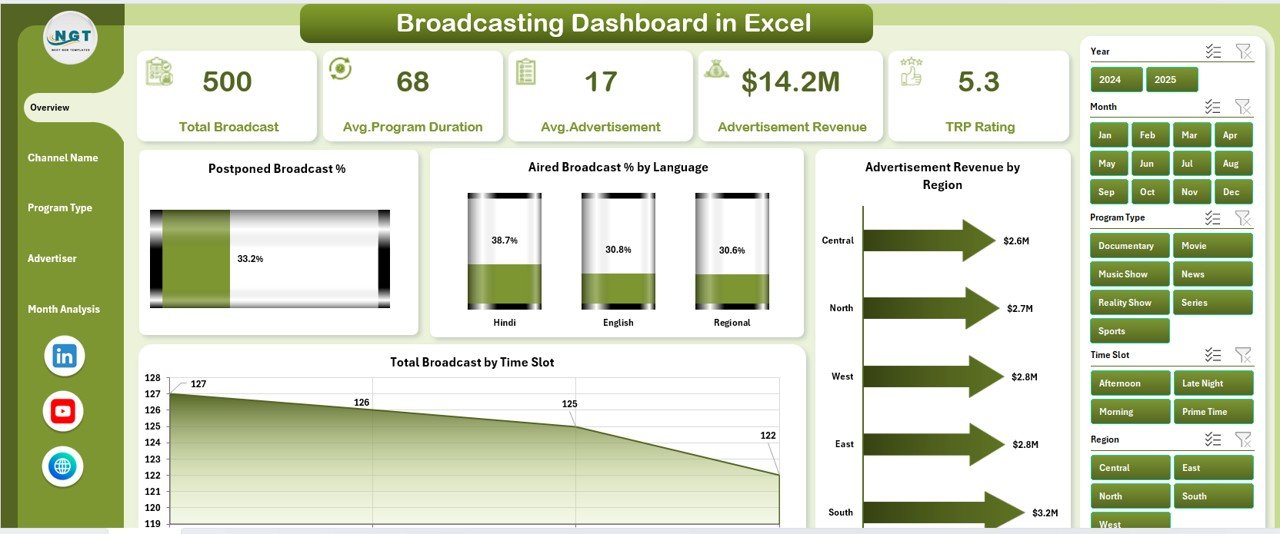
The Overview Page serves as the main landing page of the dashboard. It provides a quick snapshot of overall broadcasting performance.
Key Elements of the Overview Page
-
Right-side slicer for filtering data
-
4 KPI cards for instant insights
-
4 high-impact charts
KPI Cards on the Overview Page
The KPI cards highlight critical performance metrics at a glance, helping decision-makers focus on what matters most.
Charts Available on the Overview Page
-
Postponed Broadcast %
This chart shows the percentage of postponed broadcasts. It helps identify scheduling inefficiencies. -
Aired Broadcast % by Language
This chart highlights how broadcasts perform across different languages. -
Advertisement Revenue by Region
This chart reveals which regions generate the highest advertising revenue. -
Total Broadcast by Time Slot
This chart displays broadcast distribution across time slots, helping optimize prime-time scheduling.
Because the Overview Page summarizes everything, executives can quickly assess performance without diving into details.
Click to Purchases Broadcasting Dashboard in Excel
2. Channel Name Analysis: Channel-Wise Performance Insights
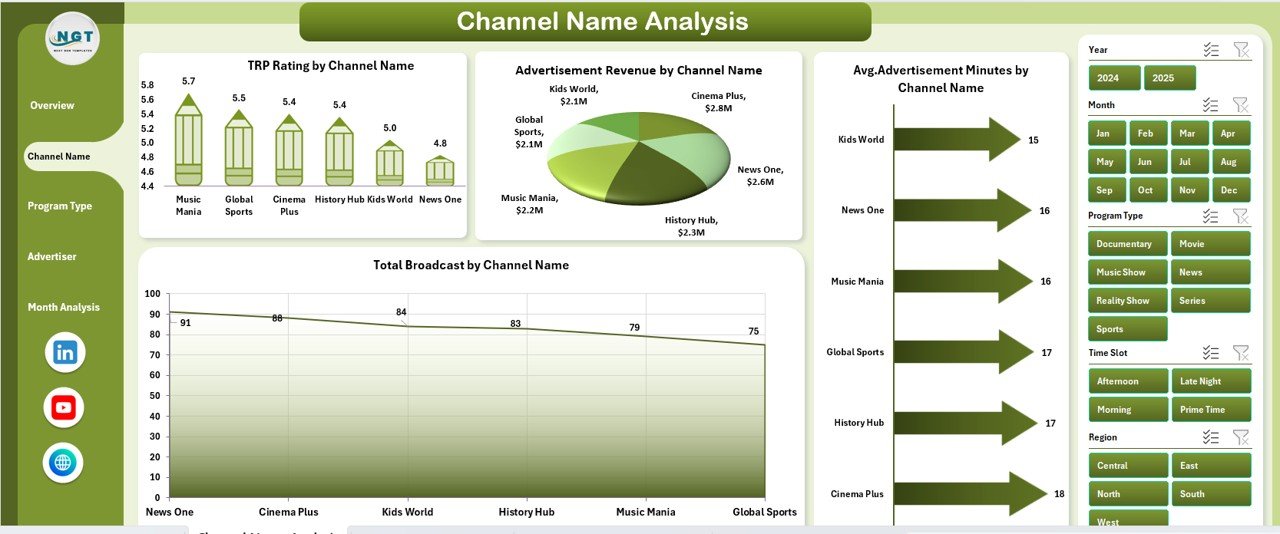
The Channel Name Analysis page focuses on performance at the individual channel level.
Why Is Channel Analysis Important?
Different channels cater to different audiences. Therefore, analyzing channel-wise performance helps broadcasters allocate resources effectively.
Features of the Channel Name Analysis Page
-
Right-side slicer for channel filtering
-
4 focused analytical charts
Charts on the Channel Name Analysis Page
-
TRP Rating by Channel Name
This chart shows how each channel performs in terms of viewership. -
Advertisement Revenue by Channel Name
This chart highlights revenue contribution from each channel. -
Average Advertisement Minutes by Channel Name
This chart reveals ad load patterns across channels. -
Total Broadcast by Channel Name
This chart displays the number of broadcasts per channel.
With this analysis, broadcasters identify top-performing channels and underperformers quickly.
3. Program Type Analysis: Content-Driven Performance
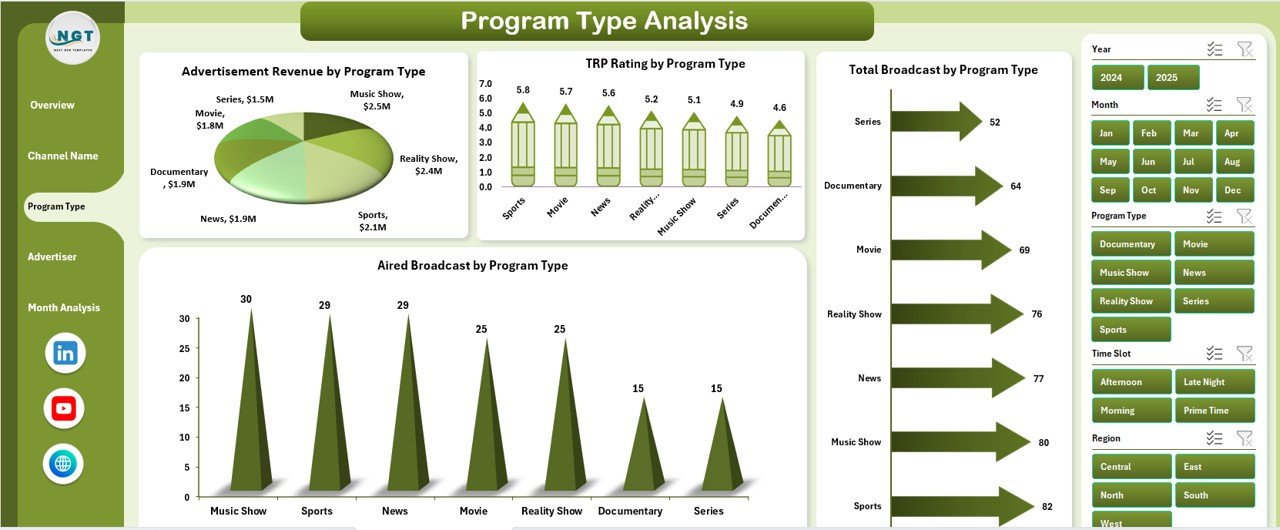
The Program Type Analysis page focuses on how different types of programs perform.
Why Program Type Analysis Matters?
Different program types attract different audiences and advertisers. Therefore, understanding this performance supports better content planning.
Features of the Program Type Analysis Page
-
Right-side slicer for program type filtering
-
4 meaningful performance charts
Charts on the Program Type Analysis Page
-
TRP Rating by Program Type
This chart compares viewership across program types. -
Advertisement Revenue by Program Type
This chart shows which content categories generate more revenue. -
Total Broadcast by Program Type
This chart displays broadcast volume for each program type. -
Aired Broadcast by Program Type
This chart highlights aired content distribution.
Using this page, content teams make informed decisions about what to produce, promote, or discontinue.
4. Advertiser Category Analysis: Revenue Optimization Insights
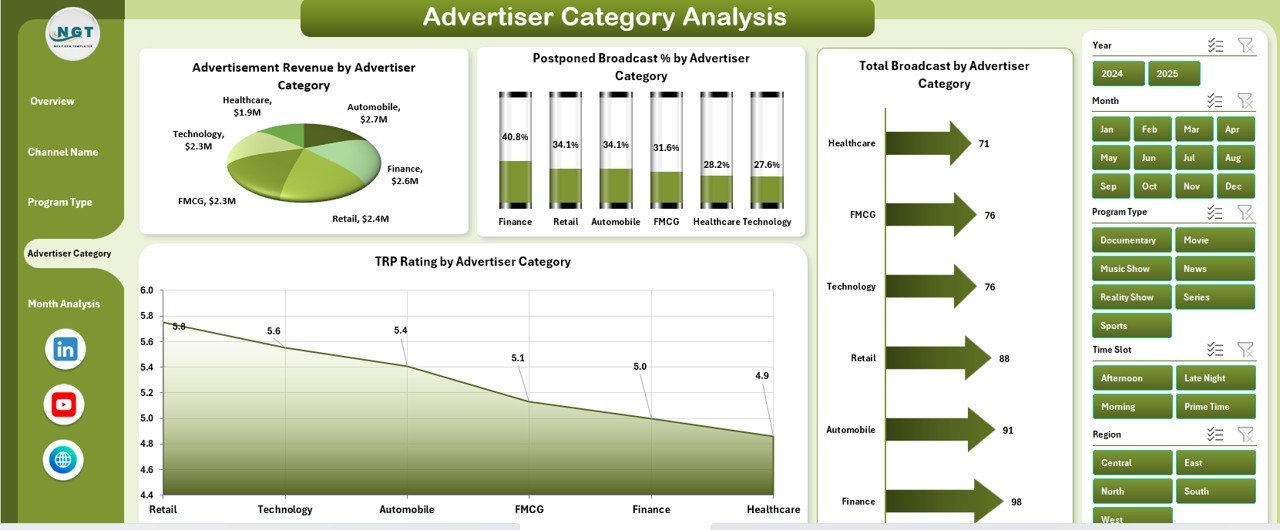
The Advertiser Category Analysis page focuses on advertiser-driven performance.
Why Advertiser Category Analysis Is Critical?
Advertisers belong to different industries, and each category behaves differently. Therefore, this analysis supports smarter sales strategies.
Features of the Advertiser Category Analysis Page
-
Right-side slicer for advertiser category filtering
-
4 focused revenue and performance charts
Charts on the Advertiser Category Analysis Page
-
TRP Rating by Advertiser Category
This chart links advertiser categories with audience reach. -
Advertisement Revenue by Advertiser Category
This chart shows which advertiser categories generate maximum revenue. -
Total Broadcast by Advertiser Category
This chart displays broadcast volume linked to advertiser categories. -
Aired Broadcast by Advertiser Category
This chart highlights how much content aired for each advertiser group.
With this analysis, sales teams identify high-value advertiser categories and growth opportunities.
Click to Purchases Broadcasting Dashboard in Excel
5. Month Analysis: Trend and Seasonal Insights
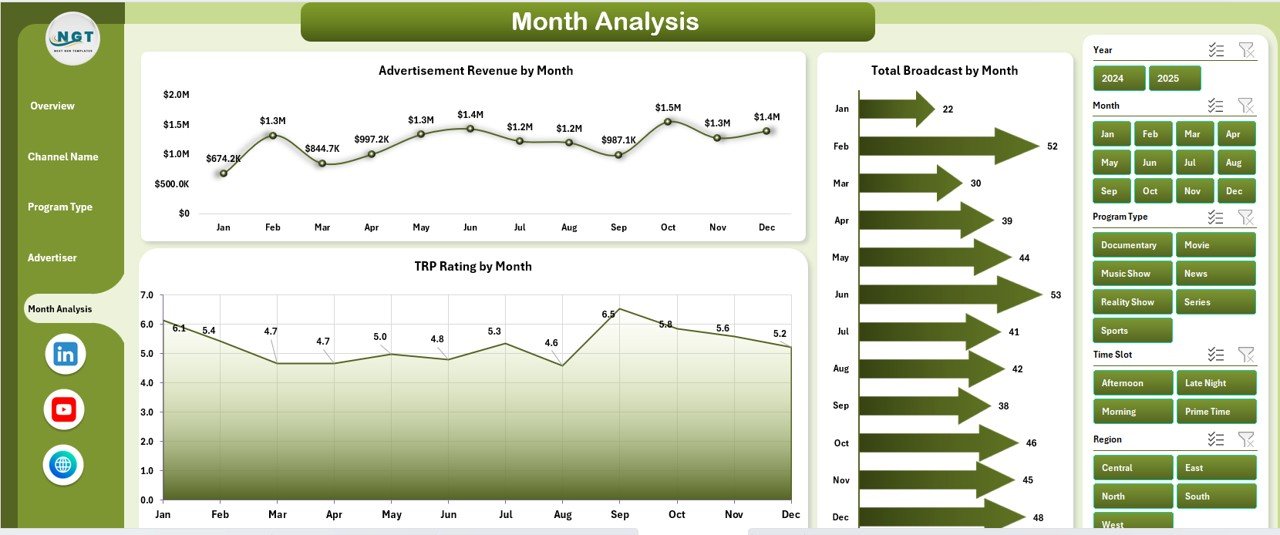
The Month Analysis page focuses on time-based performance trends.
Why Monthly Analysis Is Important?
Broadcasting performance changes throughout the year due to seasons, festivals, and market conditions. Therefore, monthly analysis helps spot patterns early.
Features of the Month Analysis Page
-
Right-side slicer for month selection
-
Clear trend-based charts
Charts on the Month Analysis Page
-
TRP Rating by Month
This chart shows how audience engagement changes over time. -
Advertisement Revenue by Month
This chart highlights seasonal revenue trends. -
Total Broadcast by Month
This chart displays broadcast volume month by month.
Using this page, broadcasters plan future schedules and sales campaigns more effectively.
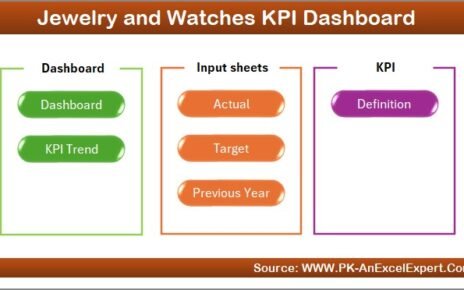
Data Sheet and Support Sheet: The Backbone of the Dashboard
Behind every strong dashboard lies a well-structured data foundation.
Data Sheet
-
Stores all raw broadcasting data
-
Feeds all pivot tables and charts
-
Allows easy data updates
Support Sheet
-
Contains lookup tables and helper calculations
-
Improves dashboard performance and accuracy
Because of this structure, users update data easily without breaking the dashboard.
Advantages of Broadcasting Dashboard in Excel
The Broadcasting Dashboard in Excel offers multiple business advantages.
Key Advantages
-
Centralized performance tracking
-
Faster decision-making
-
Improved visibility across channels and programs
-
Better revenue analysis
-
Reduced manual reporting effort
-
Easy customization
-
No additional software cost
Because Excel is widely used, teams adopt this dashboard quickly without training barriers.
Who Should Use a Broadcasting Dashboard in Excel?
This dashboard suits a wide range of professionals.
Ideal Users
-
TV broadcasters
-
Radio stations
-
Media networks
-
Advertising sales teams
-
Programming managers
-
Media analysts
-
Business leaders
Anyone who needs clear broadcasting insights will benefit from this dashboard.
Best Practices for the Broadcasting Dashboard in Excel
Click to Purchases Broadcasting Dashboard in Excel
To get maximum value, users should follow best practices.
Recommended Best Practices
-
Keep the data sheet clean and updated
-
Use consistent naming for channels and programs
-
Refresh pivot tables regularly
-
Review trends monthly, not yearly
-
Focus on insights, not just numbers
-
Customize KPIs based on business goals
By following these practices, broadcasters maintain accuracy and relevance.
How Does This Dashboard Improve Decision-Making?
The Broadcasting Dashboard in Excel improves decisions in multiple ways.
-
It highlights performance gaps quickly
-
It connects TRP with revenue
-
It supports data-driven programming decisions
-
It improves advertiser negotiations
-
It strengthens strategic planning
Because insights appear visually, teams act faster and smarter.
Conclusion
The Broadcasting Dashboard in Excel is a powerful, ready-to-use solution for modern broadcasters. It transforms raw broadcasting data into meaningful insights across channels, programs, advertisers, regions, and months.
With its structured design, interactive slicers, and focused analytical pages, this dashboard helps broadcasters monitor performance, optimize revenue, and improve audience engagement. Instead of spending hours on manual reports, teams focus on strategic decisions that drive growth.
Frequently Asked Questions (FAQs)
What is a Broadcasting Dashboard in Excel used for?
A Broadcasting Dashboard in Excel tracks broadcasting performance, TRP ratings, advertisement revenue, and broadcast volume in one centralized view.
Can beginners use a Broadcasting Dashboard in Excel?
Yes, beginners can use it easily because it relies on simple Excel features like pivot tables, slicers, and charts.
How often should data be updated in the dashboard?
You should update data regularly, ideally monthly or weekly, to maintain accurate insights.
Can this dashboard handle large datasets?
Yes, Excel can handle large datasets efficiently when data stays well structured.
Can the dashboard be customized?
Yes, users can add KPIs, charts, or pages based on business needs.
Does this dashboard require Excel macros or VBA?
No, this dashboard works without macros or VBA, making it safe and easy to use.
Visit our YouTube channel to learn step-by-step video tutorials