Business Angel Networks play a critical role in supporting early-stage startups. They connect entrepreneurs with investors who provide capital, mentorship, and strategic guidance. However, managing investment activity, tracking startup performance, and monitoring investor engagement can become complex when organizations rely on scattered spreadsheets and manual reports.
Therefore, many angel networks look for structured tools that allow them to track performance metrics clearly and consistently. A Business Angel Networks KPI Dashboard in Excel helps organizations monitor key indicators, evaluate investment success, and make informed decisions.
In this article, we will explore what a Business Angel Networks KPI Dashboard in Excel is, why organizations need it, how it works, and how businesses can implement it effectively.
Click to buy Business Angel Networks KPI Dashboard in Excel
What is a Business Angel Networks KPI Dashboard in Excel?
A Business Angel Networks KPI Dashboard in Excel is a structured analytics tool designed to track and monitor the performance of angel investment networks. It collects key performance indicators (KPIs) related to investments, startup growth, deal flow, investor participation, and funding activities.
Instead of managing multiple reports manually, organizations can use this dashboard to visualize data through charts, metrics, and trend analysis.
Moreover, Excel dashboards provide a flexible environment where users can easily update data, refresh calculations, and analyze performance instantly.
Because angel networks constantly evaluate investment opportunities and portfolio performance, this dashboard allows teams to measure progress and identify trends quickly.
Why Do Business Angel Networks Need KPI Tracking?
Angel investment networks manage several complex activities simultaneously. They evaluate startups, facilitate investor meetings, analyze funding rounds, and track portfolio performance.
However, when organizations lack structured reporting systems, they often face challenges such as:
- Difficulty measuring investment success
- Limited visibility into startup growth
- Poor tracking of investor engagement
- Delayed decision-making
Therefore, KPI dashboards solve these challenges by organizing all important metrics in one place.
Furthermore, real-time insights allow angel networks to respond quickly to new opportunities and risks.
What Are the Key Benefits of Using an Excel KPI Dashboard?
Excel remains one of the most powerful tools for business analytics. It offers flexibility, automation, and visual reporting capabilities.
When organizations use an Excel KPI dashboard, they gain several benefits:
Easy Data Management
Excel allows users to store, update, and analyze data easily. Because all metrics exist in one file, teams can quickly access important information.
Interactive Performance Monitoring
Users can apply filters, drop-down selections, and slicers to analyze different performance metrics.
Visual Data Representation
Charts and graphs help users understand trends quickly.
Automated Calculations
Excel formulas and pivot tables automatically update calculations when users refresh the data.
Cost-Effective Solution
Unlike many expensive BI tools, Excel provides powerful analytics capabilities at a lower cost.
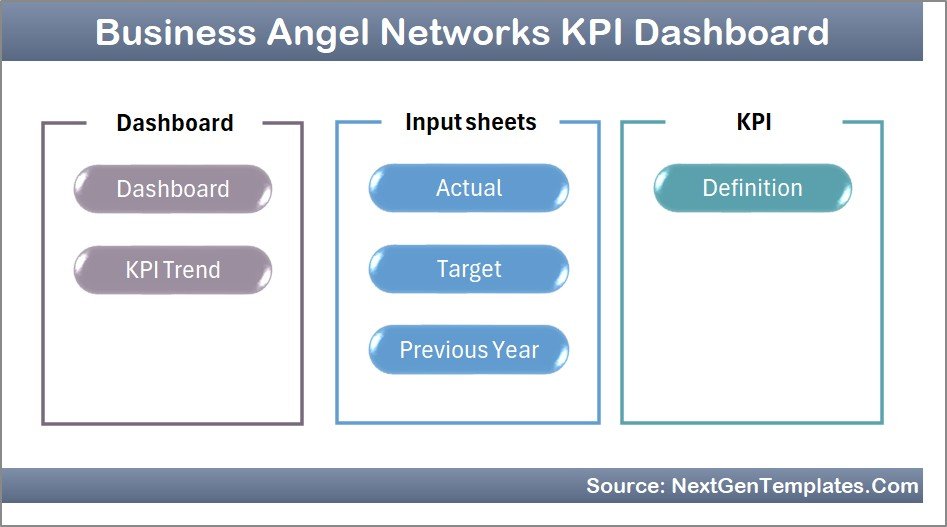
What Are the Key Features of the Business Angel Networks KPI Dashboard in Excel?
This dashboard contains seven worksheets, each designed to serve a specific purpose in the analysis process.
Let us explore each worksheet in detail.
Summary Page
The Summary Page works as the main index sheet of the dashboard.
This sheet contains six navigation buttons that allow users to quickly move to different sections of the dashboard.
Because dashboards often contain multiple worksheets, this summary page improves usability and navigation.
Users can access all important dashboard sections directly from this page.
Click to buy Business Angel Networks KPI Dashboard in Excel
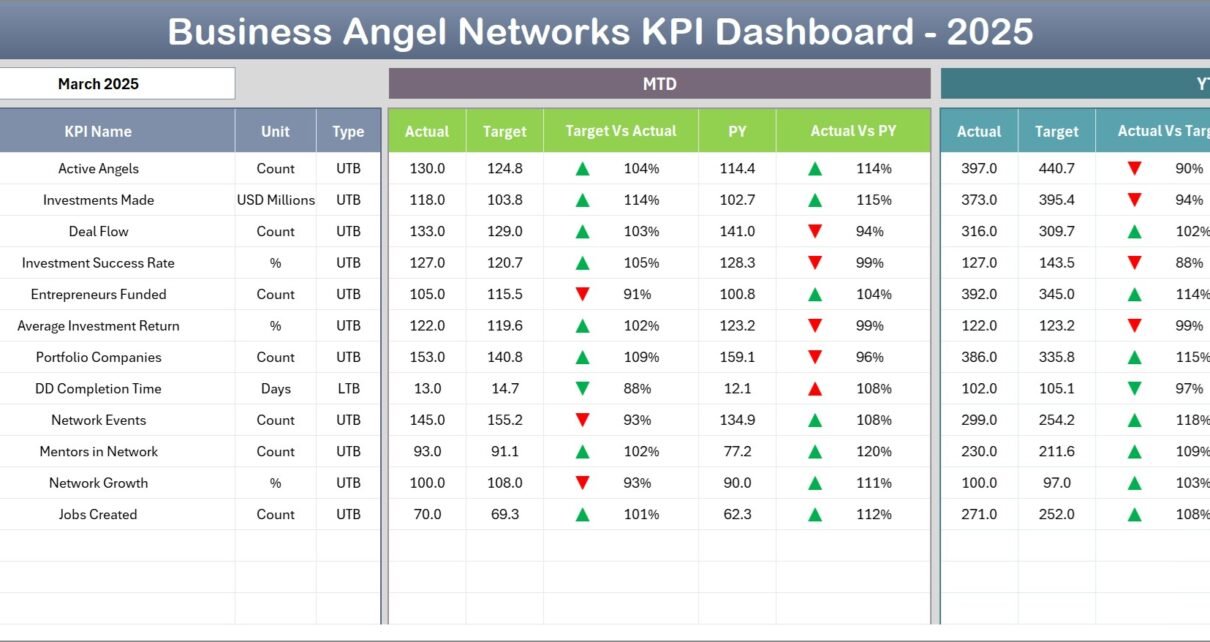
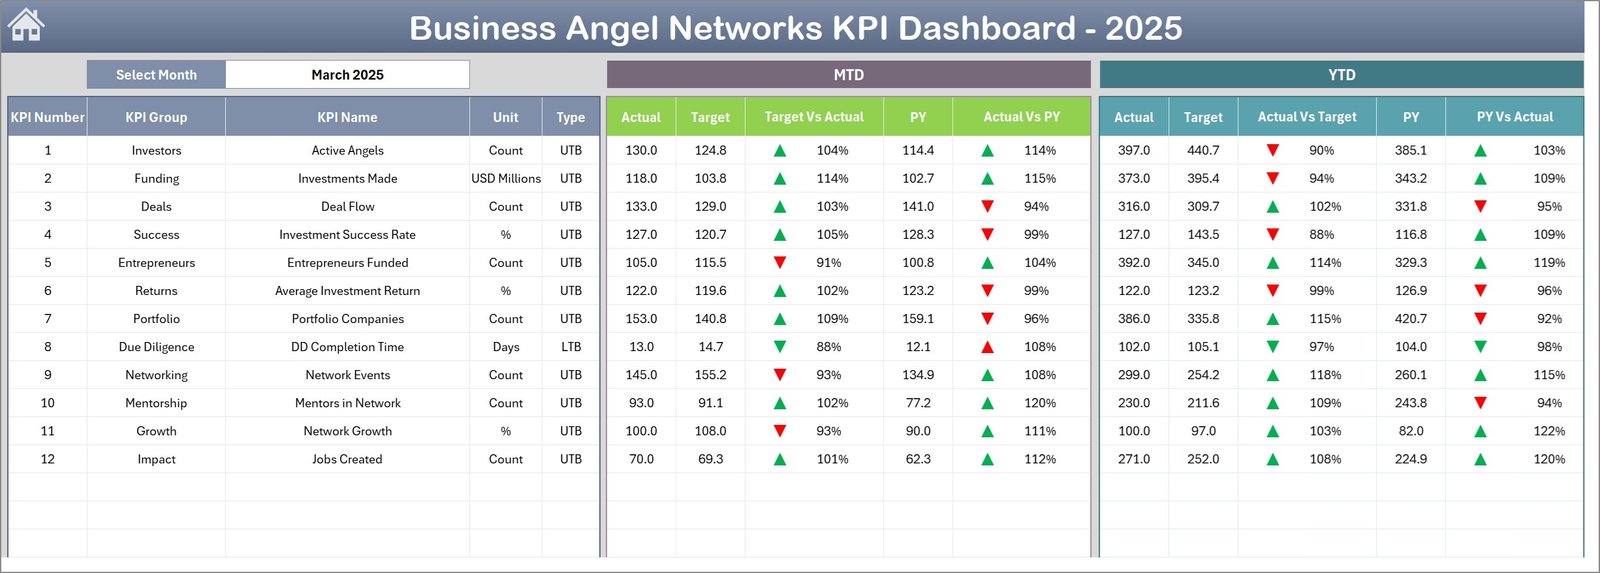
Dashboard Sheet Tab
The Dashboard Sheet acts as the central analysis page of the entire system.
Here, users can view the overall performance of all KPIs in a structured format.
Month Selection Feature
Users can select the month using the drop-down menu in cell D3. Once users select a month, the entire dashboard automatically updates all KPI values.
This functionality allows users to quickly compare performance across different months.
Performance Metrics Displayed
The dashboard displays several important KPI metrics including:
- MTD Actual Values
- Target Values
- Previous Year Data
- Target vs Actual Comparison
- Previous Year vs Actual Comparison
Additionally, the dashboard uses conditional formatting arrows to indicate whether performance improved or declined.
Year-To-Date Metrics
In addition to monthly metrics, the dashboard also displays Year-To-Date (YTD) performance indicators.
These metrics include:
- YTD Actual
- YTD Target
- YTD Previous Year
- Target vs Actual comparison
- Previous Year vs Actual comparison
Therefore, decision-makers can quickly evaluate both short-term and long-term performance trends.
Click to buy Business Angel Networks KPI Dashboard in Excel
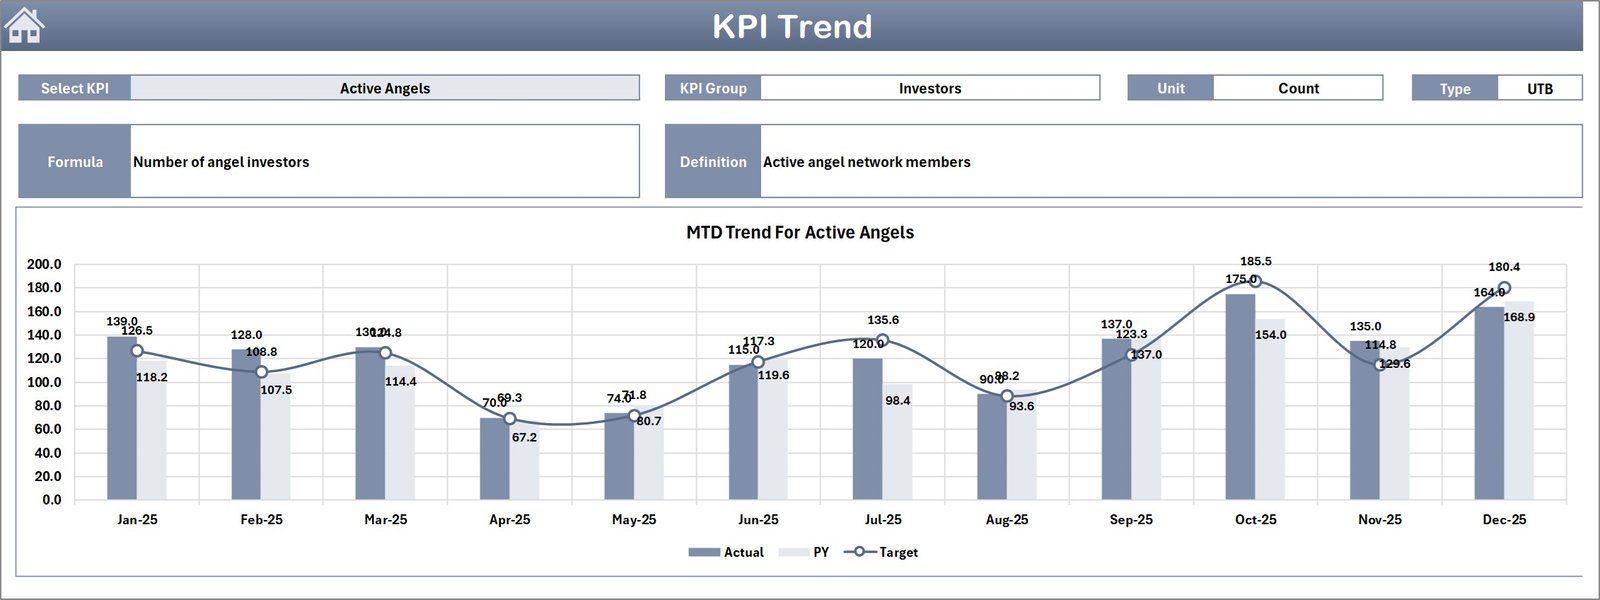
Trend Sheet Tab
The Trend Sheet focuses on KPI performance trends.
Users can select a specific KPI using the drop-down menu in cell C3.
Once users choose a KPI, the dashboard displays several important details including:
- KPI Group
- Unit of Measurement
- KPI Type (Lower the Better or Upper the Better)
- KPI Formula
- KPI Definition
In addition, this sheet displays MTD and YTD trend charts.
These charts compare:
- Actual performance
- Target performance
- Previous year performance
Because of these visual comparisons, users can easily identify whether a KPI improves or declines over time.
Click to buy Business Angel Networks KPI Dashboard in Excel
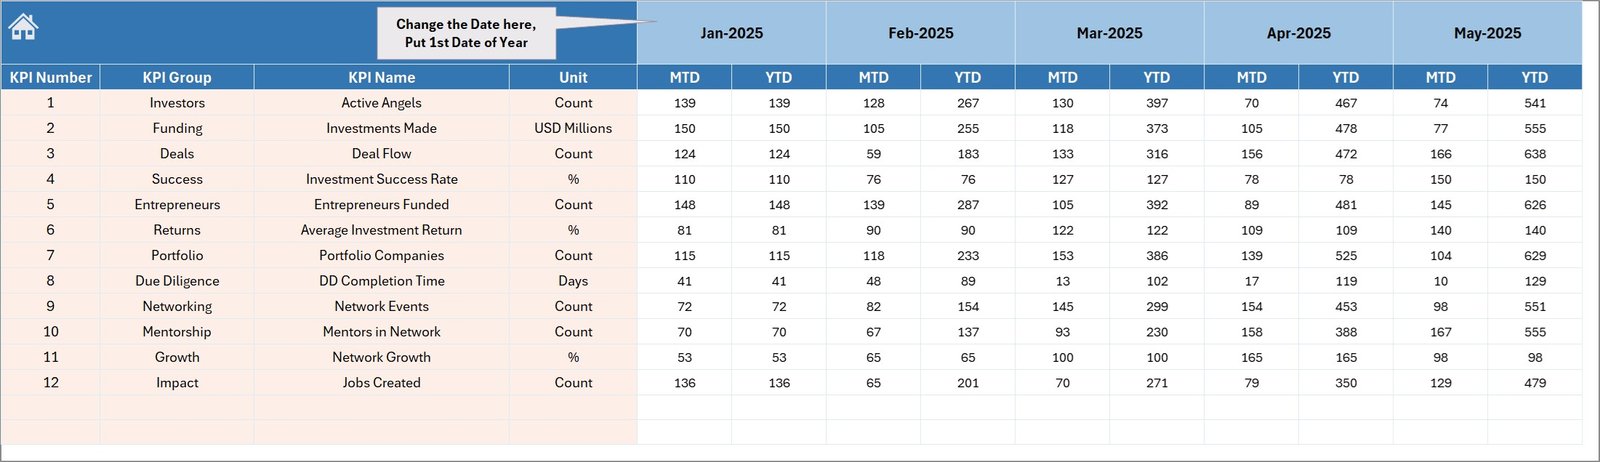
Actual Numbers Input Sheet
The Actual Numbers Input Sheet allows users to enter the real performance data.
Users must input the Monthly-To-Date (MTD) and Year-To-Date (YTD) values for each KPI.
Additionally, the month selection control exists in cell E1.
Users simply enter the first month of the year in this cell. Then the dashboard automatically adjusts the remaining months accordingly.
This sheet acts as the main data input area for current-year performance values.
Click to buy Business Angel Networks KPI Dashboard in Excel
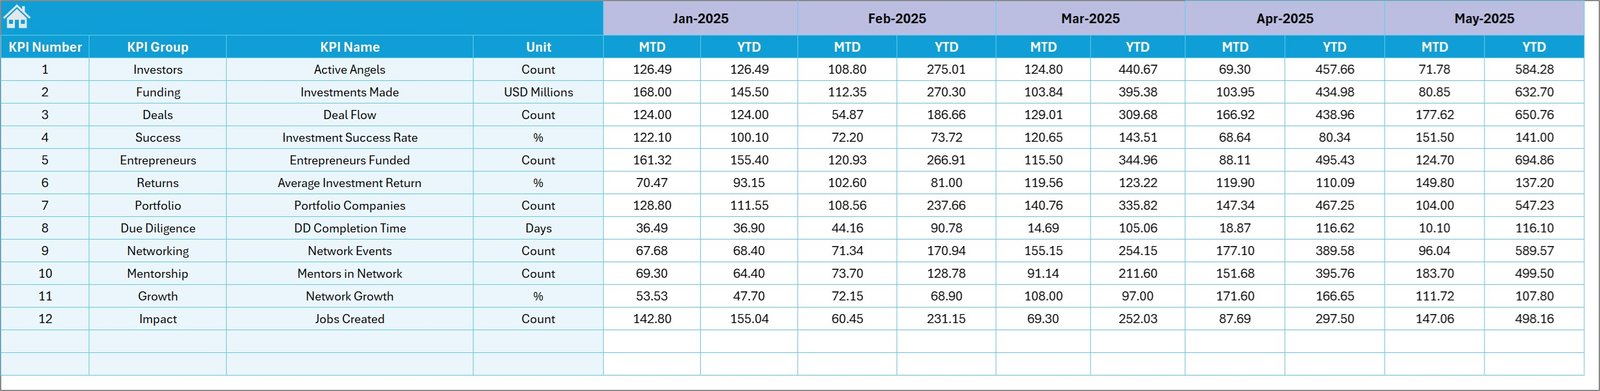
Target Sheet Tab
The Target Sheet allows organizations to define their KPI goals.
Users enter the target values for each KPI for every month.
This sheet contains both:
- Monthly targets (MTD)
- Year-to-date targets (YTD)
Because organizations often set specific performance goals, this sheet ensures that the dashboard can compare actual results against targets.
Click to buy Business Angel Networks KPI Dashboard in Excel
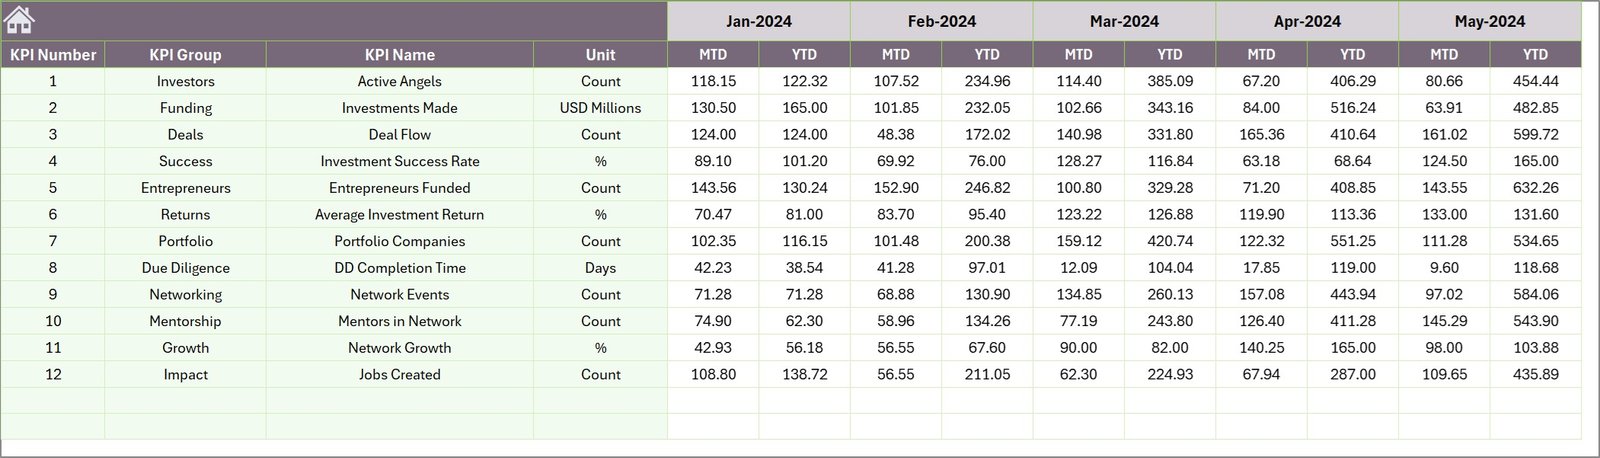
Previous Year Numbers Sheet
Historical data provides important context when evaluating performance.
Therefore, the Previous Year Numbers Sheet stores performance metrics from the previous year.
Users enter data in the same structure used in the current year.
Because the dashboard compares current performance with historical results, decision-makers can easily measure improvement or decline.
Click to buy Business Angel Networks KPI Dashboard in Excel
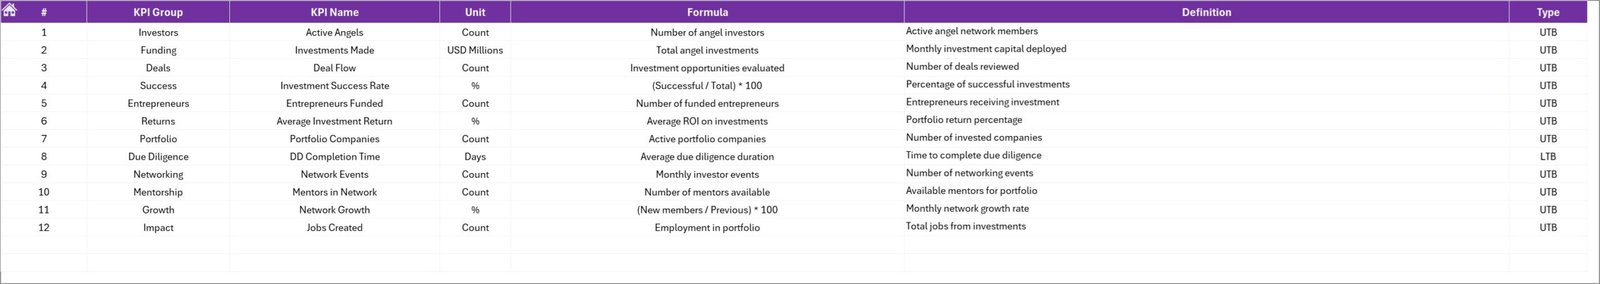
KPI Definition Sheet
The KPI Definition Sheet acts as the central KPI reference table.
Users enter the following information here:
- KPI Name
- KPI Group
- Unit of Measurement
- KPI Formula
- KPI Definition
Because this information supports the Trend Sheet and Dashboard calculations, maintaining accurate KPI definitions ensures that the dashboard remains reliable.
Click to buy Business Angel Networks KPI Dashboard in Excel
Which KPIs Can Business Angel Networks Track?
Angel investment networks can track many performance indicators through this dashboard.
Some common KPIs include:
Investment Activity KPIs
- Total Investment Deals
- Number of Startups Funded
- Average Investment Size
- Funding Round Participation Rate
Startup Performance KPIs
- Startup Revenue Growth
- Startup Valuation Growth
- Exit Success Rate
- Startup Survival Rate
Investor Engagement KPIs
- Active Investors
- Investor Participation Rate
- Average Investor Contribution
Network Growth KPIs
- New Startups Added
- New Investors Joined
- Total Portfolio Companies
These KPIs help angel networks evaluate both financial performance and ecosystem growth.
Advantages of Business Angel Networks KPI Dashboard in Excel
Organizations gain many advantages when they implement a KPI dashboard.
- Improved Decision-Making
Decision-makers can analyze investment performance quickly.
- Better Investment Monitoring
Angel networks can monitor portfolio companies and funding performance more effectively.
- Centralized Data Management
All KPI metrics exist in one organized Excel file.
- Clear Performance Visibility
Charts and visual indicators allow users to understand trends easily.
- Faster Reporting
Teams can generate reports quickly without manual calculations.
- Enhanced Investor Transparency
Angel networks can share structured performance reports with investors.
How Does This Dashboard Improve Investment Analysis?
Investment decisions require data-driven insights.
However, when teams rely on manual analysis, they often overlook trends and patterns.
The Business Angel Networks KPI Dashboard improves investment analysis by:
- Tracking investment performance trends
- Monitoring portfolio company growth
- Comparing actual results with targets
- Identifying underperforming investments
- Evaluating investor engagement
As a result, organizations can make smarter investment decisions.
Best Practices for the Business Angel Networks KPI Dashboard in Excel
Organizations must follow best practices to get the most value from their dashboards.
Maintain Accurate Data
Always enter correct and updated performance numbers.
Update Data Regularly
Monthly updates ensure that the dashboard remains relevant.
Use Clear KPI Definitions
Clear KPI definitions prevent confusion among team members.
Track Both MTD and YTD Metrics
Monitoring both short-term and long-term performance helps decision-making.
Monitor Historical Data
Historical comparisons provide valuable context for performance evaluation.
Review Dashboard Trends Frequently
Regular analysis allows teams to identify problems early.
How Can Organizations Customize This Dashboard?
Every angel network operates differently.
Therefore, organizations can customize the dashboard according to their needs.
Possible customizations include:
- Adding new KPIs
- Creating additional analysis charts
- Integrating investor-specific metrics
- Expanding trend analysis pages
- Adding automated reports
Because Excel supports flexible data structures, users can modify the dashboard easily.
Conclusion
Business Angel Networks play an essential role in supporting startup ecosystems. However, managing investment activities and monitoring startup performance requires structured analytics tools.
The Business Angel Networks KPI Dashboard in Excel provides a powerful solution for tracking investment metrics, evaluating performance, and supporting strategic decision-making.
Because this dashboard organizes KPI data into clear charts, comparisons, and trend analyses, organizations can monitor their investments effectively.
Moreover, Excel’s flexibility allows angel networks to customize the dashboard according to their specific reporting requirements.
As a result, organizations gain better insights, stronger investor confidence, and improved investment performance.
Frequently Asked Questions (FAQs)
What is a Business Angel Networks KPI Dashboard?
A Business Angel Networks KPI Dashboard is a reporting tool that tracks investment performance, startup growth, and investor participation metrics.
Why should angel networks use KPI dashboards?
KPI dashboards help angel networks monitor investment activity, analyze portfolio performance, and make better strategic decisions.
Can Excel handle investment performance dashboards?
Yes. Excel provides powerful data analysis tools such as charts, pivot tables, formulas, and conditional formatting that support advanced dashboard reporting.
What data is required for this dashboard?
Organizations need data such as:
- Investment deal information
- Startup performance metrics
- Investor participation data
- Target performance values
- Previous year historical data
Can organizations customize the KPI dashboard?
Yes. Organizations can add new KPIs, modify charts, expand data sources, and adjust calculations based on their reporting needs.
Watch the step-by-step video tutorial:
Visit our YouTube channel to learn step-by-step video tutorials
Click to buy Business Angel Networks KPI Dashboard in Excel