Business transformation has become a necessity rather than a choice. Organizations must continuously improve processes, technology, people, and performance to stay competitive. However, transformation initiatives often fail when teams cannot track progress clearly. That is exactly where a Business Transformation KPI Dashboard in Excel becomes a powerful and practical solution.
This article explains what a Business Transformation KPI Dashboard in Excel is, why it matters, how it works, and how each worksheet supports transformation tracking. Moreover, you will learn about its advantages, best practices, and frequently asked questions. By the end, you will clearly understand how this ready-to-use Excel dashboard helps organizations move from assumptions to data-driven transformation decisions.
Click to buy Business Transformation KPI Dashboard in Excel
What Is a Business Transformation KPI Dashboard in Excel?
A Business Transformation KPI Dashboard in Excel is a structured, interactive reporting tool that tracks key performance indicators related to transformation initiatives. These initiatives may include digital transformation, process optimization, cost reduction, customer experience improvement, or organizational change.
Instead of managing scattered spreadsheets and static reports, this dashboard centralizes all transformation KPIs into one Excel-based system. As a result, leaders, transformation managers, and analysts gain a clear, consistent, and real-time view of progress.
Because Excel is widely used, this dashboard works without complex tools or expensive software. Moreover, teams can update data easily and view results instantly.
Why Do Organizations Need a Business Transformation KPI Dashboard?
Business transformation involves multiple departments, timelines, and objectives. Without a proper tracking system, teams lose visibility and alignment. Therefore, organizations need a dashboard that brings clarity and accountability.
A Business Transformation KPI Dashboard in Excel helps organizations:
- Track transformation progress month by month
- Compare actual performance against targets
- Measure improvements against the previous year
- Identify underperforming areas early
- Support leadership with data-driven insights
As transformation efforts grow, manual tracking becomes risky. However, this dashboard eliminates guesswork and enables structured monitoring.
How Does a Business Transformation KPI Dashboard in Excel Work?
This dashboard works by linking actual data, target values, previous year numbers, and KPI definitions into a single reporting framework. When users select a month, the entire dashboard updates automatically.
Because of built-in formulas, conditional formatting, and charts, users can instantly see:
- Month-to-Date (MTD) performance
- Year-to-Date (YTD) performance
- Target vs Actual variance
- Previous Year vs Actual comparison
- Positive or negative trends
As a result, decision-makers can act faster and more confidently.
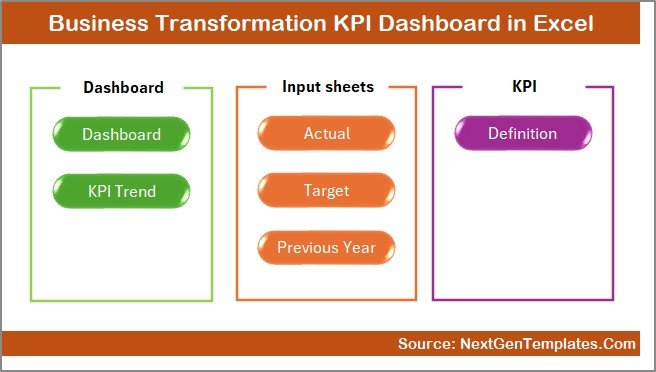
What Are the Key Worksheets in the Business Transformation KPI Dashboard in Excel?
This Business Transformation KPI Dashboard in Excel includes seven structured worksheets, each designed for a specific purpose. Together, they create a complete transformation tracking system.
Summary Page
The Summary Page acts as the index and navigation hub of the dashboard.
Key Purpose of the Summary Page
This sheet allows users to move quickly between dashboard sections. Instead of scrolling or searching, users simply click buttons.
Key Features of the Summary Page
- Clean and professional layout
- Six navigation buttons for quick access
- User-friendly design for executives and managers
- Central starting point for the dashboard
Because of this page, users save time and avoid confusion. Moreover, navigation becomes intuitive even for first-time users.
Click to buy Business Transformation KPI Dashboard in Excel
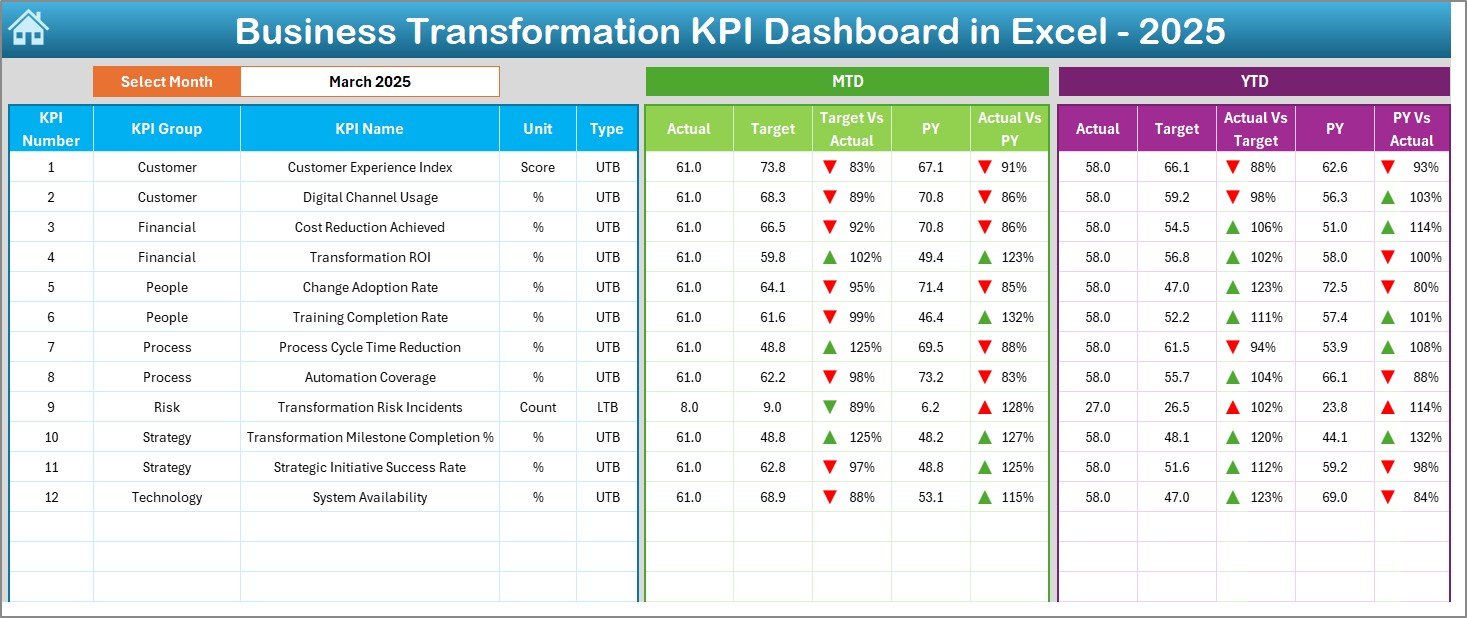
Dashboard Sheet
The Dashboard Sheet Tab is the core reporting page of the Business Transformation KPI Dashboard in Excel.
Monthly Selection Feature
On cell D3, users select the required month from a drop-down list. Once selected, the entire dashboard updates instantly.
KPI Performance Metrics Displayed
This sheet displays both MTD and YTD metrics for each KPI:
MTD Metrics
- MTD Actual
- MTD Target
- MTD Previous Year
- Target vs Actual variance
- Previous Year vs Actual variance
YTD Metrics
- YTD Actual
- YTD Target
- YTD Previous Year
- Target vs Actual variance
- Previous Year vs Actual variance
Visual Indicators for Quick Analysis
- Up and down arrows show performance direction
- Conditional formatting highlights positive and negative variance
- Clear comparison helps identify risks and opportunities
As a result, leaders can instantly see where transformation efforts succeed and where corrective action is required.
Click to buy Business Transformation KPI Dashboard in Excel
Trend Sheet
The Trend Sheet Tab focuses on KPI-level analysis over time.
KPI Selection Feature
Users select a KPI from the drop-down list in cell C3. Based on this selection, the sheet updates dynamically.
KPI Details Displayed
- KPI Group
- Unit of Measure
- KPI Type (Lower the Better or Upper the Better)
- KPI Formula
- KPI Definition
Trend Visualization
This sheet displays MTD and YTD trend charts for:
- Actual values
- Target values
- Previous year values
Because of these charts, users can identify patterns, seasonality, and long-term improvement or decline.

Click to buy Business Transformation KPI Dashboard in Excel
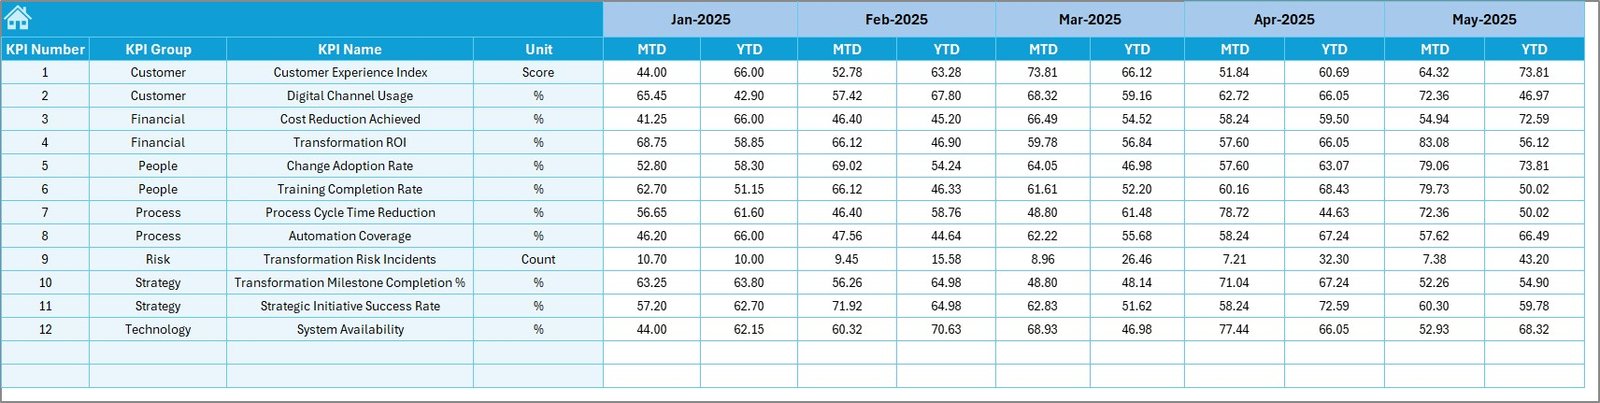
Actual Numbers Input Sheet
The Actual Numbers Input Sheet is where users enter real performance data.
Key Input Features
- Enter MTD and YTD actual numbers
- Select the starting month of the year in cell E1
- Monthly structure ensures accurate calculations
Why This Sheet Matters
This sheet ensures data accuracy. Since all dashboard calculations depend on this input, clean and consistent data entry becomes essential.
Moreover, separating input from reporting reduces errors and protects dashboard formulas.
Click to buy Business Transformation KPI Dashboard in Excel
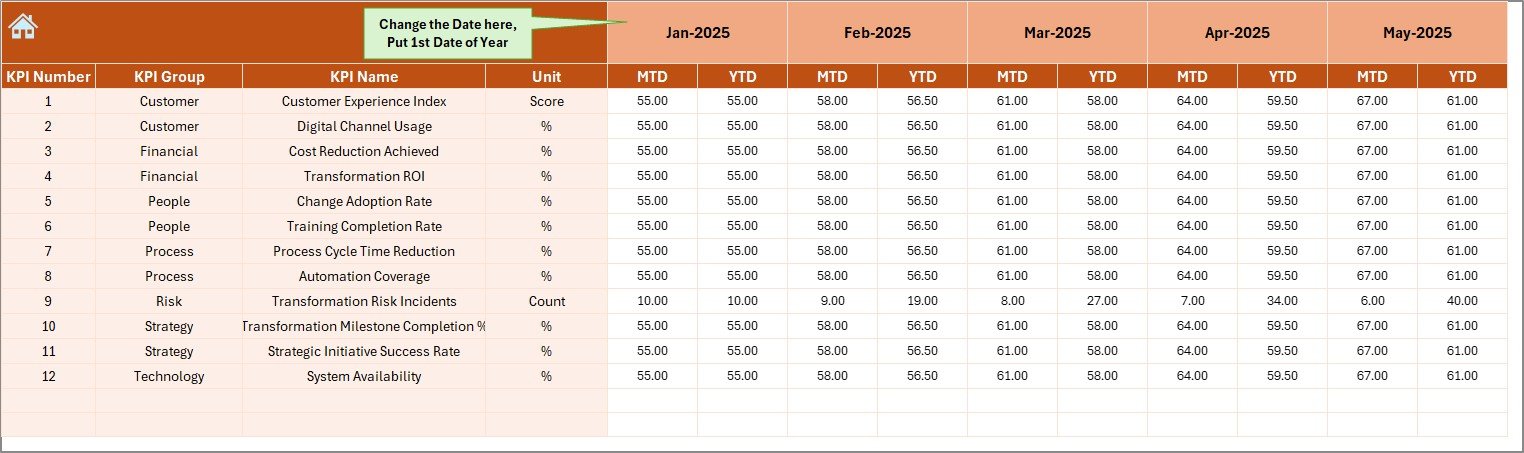
Target Sheet
The Target Sheet Tab stores the planned or expected performance values for each KPI.
What Users Enter in This Sheet
- Monthly MTD targets
- Monthly YTD targets
- KPI-wise target values
Why Target Tracking Is Important
Targets define success. Therefore, this sheet enables meaningful comparison between actual performance and expectations.
Without targets, transformation measurement becomes incomplete.
Click to buy Business Transformation KPI Dashboard in Excel
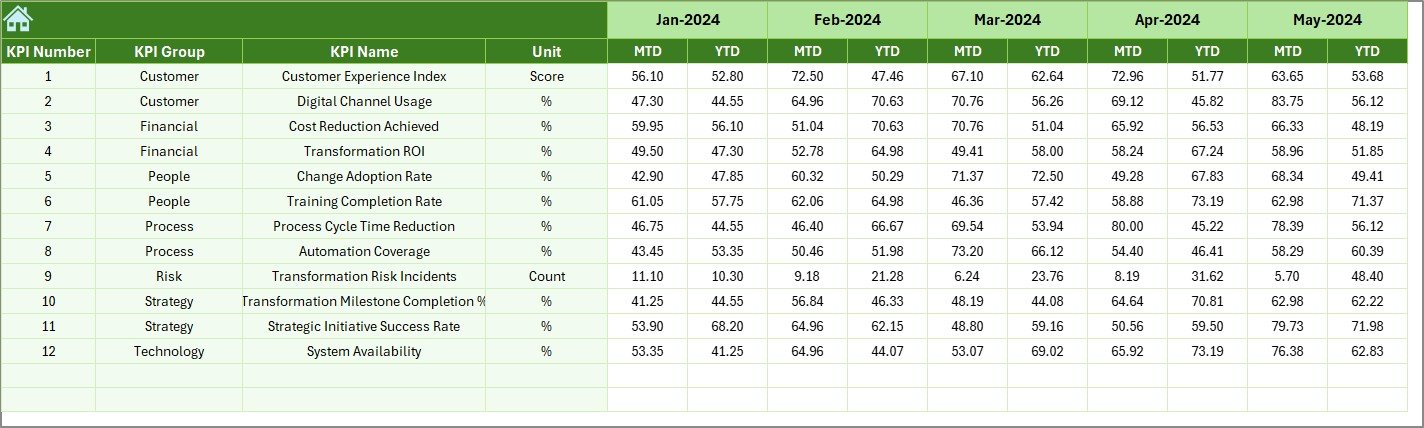
Previous Year
The Previous Year Number Sheet Tab captures historical performance data.
Key Purpose of This Sheet
- Enter last year’s MTD and YTD numbers
- Enable year-over-year comparison
- Measure real improvement over time
Because transformation aims to improve results, comparing current performance with the previous year becomes critical.
Click to buy Business Transformation KPI Dashboard in Excel
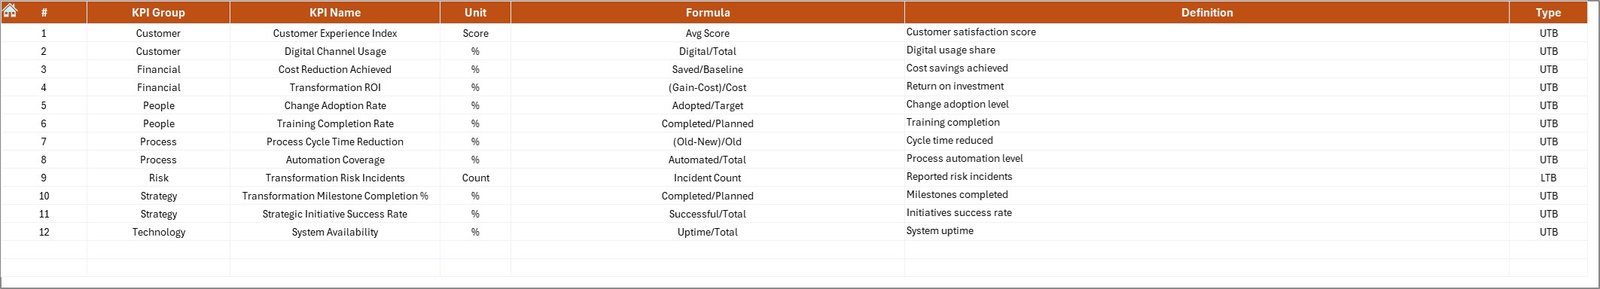
KPI Definition Sheet Tab
The KPI Definition Sheet Tab provides clarity and governance.
Information Stored in This Sheet
- KPI Name
- KPI Group
- Unit of Measurement
- KPI Formula
- KPI Definition
Why KPI Definitions Matter
Clear definitions prevent confusion and misinterpretation. Moreover, this sheet ensures that everyone measures KPIs consistently across teams.
Click to buy Business Transformation KPI Dashboard in Excel
What Types of KPIs Can You Track in a Business Transformation Dashboard?
A Business Transformation KPI Dashboard in Excel can track multiple transformation dimensions, such as:
- Operational efficiency KPIs
- Cost reduction KPIs
- Digital adoption KPIs
- Customer experience KPIs
- Employee productivity KPIs
- Process improvement KPIs
- Innovation and agility KPIs
Because Excel is flexible, organizations can customize KPIs based on their transformation goals.
Advantages of Business Transformation KPI Dashboard in Excel
Using a Business Transformation KPI Dashboard in Excel offers several practical advantages.
Centralized Performance Tracking
- All transformation KPIs in one place
- No scattered spreadsheets
- Clear and structured reporting
Real-Time Insights
- Instant updates with month selection
- Automatic calculations and comparisons
- Faster decision-making
Cost-Effective Solution
- No expensive BI tools required
- Uses familiar Excel environment
- Easy to deploy and maintain
User-Friendly Design
- Simple navigation
- Clean layout for executives
- Minimal training required
Better Accountability
- Clear targets and ownership
- Transparent performance tracking
- Strong governance support
How Does This Dashboard Support Business Leaders and Managers?
This dashboard supports leaders by turning data into insights.
- Executives gain high-level visibility
- Managers track department-level performance
- Analysts perform deep KPI analysis
- Transformation teams monitor progress
As a result, leadership alignment improves and transformation initiatives stay on track.
Best Practices for the Business Transformation KPI Dashboard in Excel
Following best practices ensures maximum value from the dashboard.
Define KPIs Clearly Before Implementation
- Align KPIs with transformation objectives
- Avoid too many KPIs
- Focus on measurable outcomes
Maintain Data Accuracy
- Update actual numbers regularly
- Validate inputs before reporting
- Use standardized units
Review Performance Monthly
- Conduct monthly dashboard reviews
- Discuss variances and trends
- Take corrective actions quickly
Use Trends, Not Just Numbers
- Analyze patterns over time
- Focus on long-term improvement
- Avoid short-term reactions
Keep the Dashboard Simple
- Avoid cluttered visuals
- Highlight what matters most
- Design for decision-making
How Can Organizations Customize This Dashboard?
Organizations can easily customize this dashboard by:
- Adding or removing KPIs
- Modifying KPI groups
- Adjusting targets
- Changing chart styles
- Expanding to department-level dashboards
Because Excel offers flexibility, customization remains simple and scalable.
Who Should Use a Business Transformation KPI Dashboard in Excel?
This dashboard works well for:
- Business leaders
- Transformation managers
- Strategy teams
- Operations managers
- Performance analysts
- Consultants and advisors
Any organization undergoing change can benefit from structured KPI tracking.
Conclusion: Why a Business Transformation KPI Dashboard in Excel Is Essential
Business transformation requires visibility, discipline, and accountability. Without structured KPI tracking, transformation efforts often lose direction.
A Business Transformation KPI Dashboard in Excel provides a simple yet powerful solution. It centralizes data, highlights performance gaps, and supports better decisions. Moreover, it empowers organizations to measure progress objectively and continuously improve.
By using this dashboard, organizations move from reactive reporting to proactive transformation management.
Frequently Asked Questions About Business Transformation KPI Dashboard in Excel
What is the main purpose of a Business Transformation KPI Dashboard in Excel?
The main purpose is to track, analyze, and monitor transformation KPIs in a structured and interactive way.
Can this dashboard be used by non-technical users?
Yes, the dashboard uses Excel features that most users already understand, making it easy to use without technical expertise.
How often should data be updated in the dashboard?
Organizations should update data monthly to ensure accurate MTD and YTD reporting.
Can organizations add more KPIs to the dashboard?
Yes, users can add or remove KPIs easily by updating the KPI Definition and input sheets.
Is this dashboard suitable for small and large organizations?
Yes, the dashboard works well for both small teams and large enterprises because of its flexibility.
Does this dashboard support year-over-year analysis?
Yes, the Previous Year Number sheet enables accurate year-over-year comparison.
Why should organizations use Excel instead of BI tools?
Excel offers flexibility, lower cost, and faster implementation, especially for teams that already use Excel daily.
Visit our YouTube channel to learn step-by-step video tutorials
Watch the step-by-step video tutorial: