Running a call center is never simple. Teams handle thousands of calls, manage customer expectations, resolve issues, and drive sales every day. Managers must make quick decisions, ensure service quality, and keep agents productive. However, traditional spreadsheets and manual tracking often slow things down. Data gets scattered, and leaders struggle to monitor KPIs, identify problems, or plan improvements.
A Call Center Operations KPI Dashboard in Excel solves these problems. It brings all call center metrics into one automated, interactive, and easy-to-read dashboard. When you use this dashboard, you understand performance at a glance and take smarter actions without wasting time.
This article explains everything about the Call Center Operations KPI Dashboard in Excel—what it is, how it works, why call centers need it, and how each sheet of this dashboard adds value. You will also learn the advantages, best practices, and frequently asked questions at the end.
Click to buy Call Center Operations KPI Dashboard in Excel
What Is a Call Center Operations KPI Dashboard in Excel?
A Call Center Operations KPI Dashboard in Excel is a ready-to-use performance-tracking tool created for call center managers, team leads, and customer service leaders. It organizes all important KPIs—including call volume, service level, resolution time, agent performance, customer satisfaction scores, and operational efficiency—into a visually rich dashboard.
With this dashboard:
- You track daily, weekly, monthly, and yearly performance
- You compare target vs. actual data
- You understand agent productivity
- You measure customer experience
- You identify gaps and areas that need improvement
- You make decisions faster and more confidently
Since everything runs in Excel, you do not need any special software or coding knowledge. You only update simple input sheets, and the dashboard adjusts automatically.
Why Do Call Centers Need a KPI Dashboard?
A call center generates huge amounts of data every minute. When managers track all metrics manually, they waste time and struggle to connect insights. A KPI Dashboard in Excel helps because it:
- Brings all KPIs together
- Replaces multiple reports
- Reduces errors
- Highlights trends
- Shows real-time performance
- Improves visibility for leadership
This dashboard keeps call center teams aligned and accountable throughout the year.
Key Features of the Call Center Operations KPI Dashboard in Excel
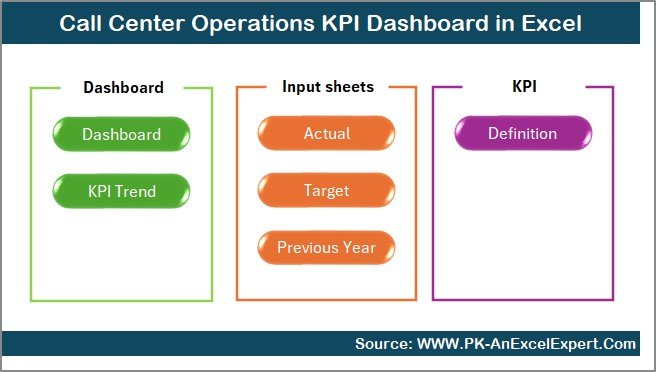
This dashboard includes 7 powerful worksheets, each designed to simplify performance tracking and improve decision-making. Below is a detailed explanation of each sheet with expanded insights.
Summary Page – Central Navigation Hub
The Summary Page works as an index. It contains six smart navigation buttons that allow you to jump to different sheets instantly.
Instead of scrolling through tabs manually, managers use this page to:
- Move quickly between dashboards
- Access key reports
- Avoid mistakes while navigating large Excel files
This saves time and makes the dashboard user-friendly for all team members.
Click to buy Call Center Operations KPI Dashboard in Excel
Dashboard Sheet – Complete KPI Overview
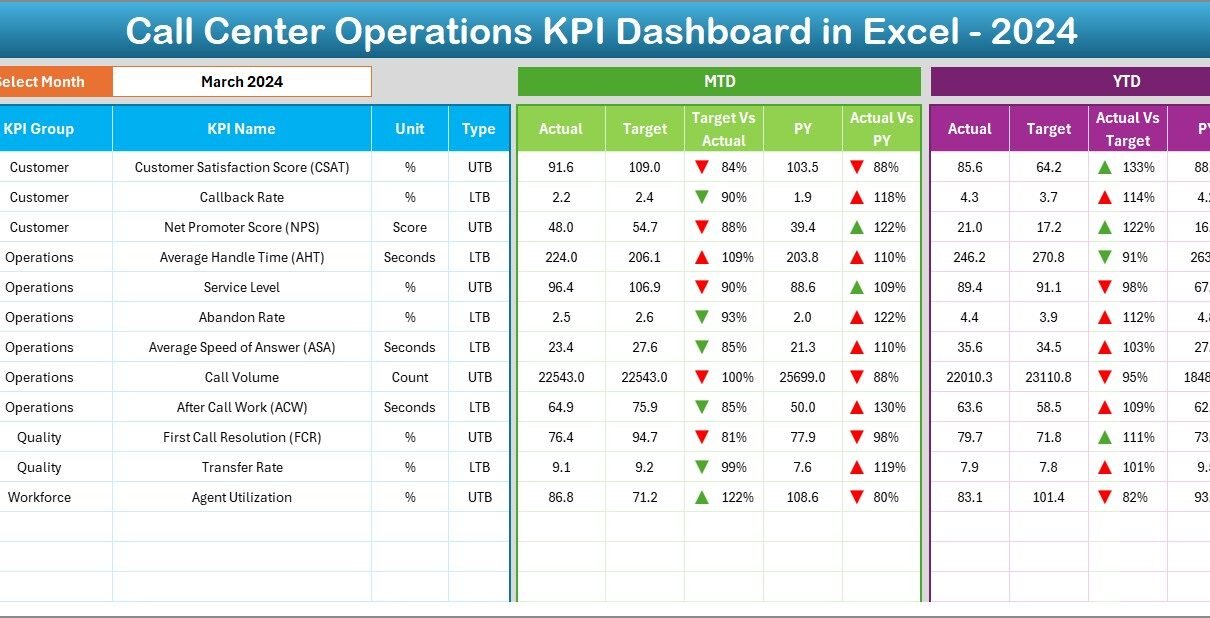
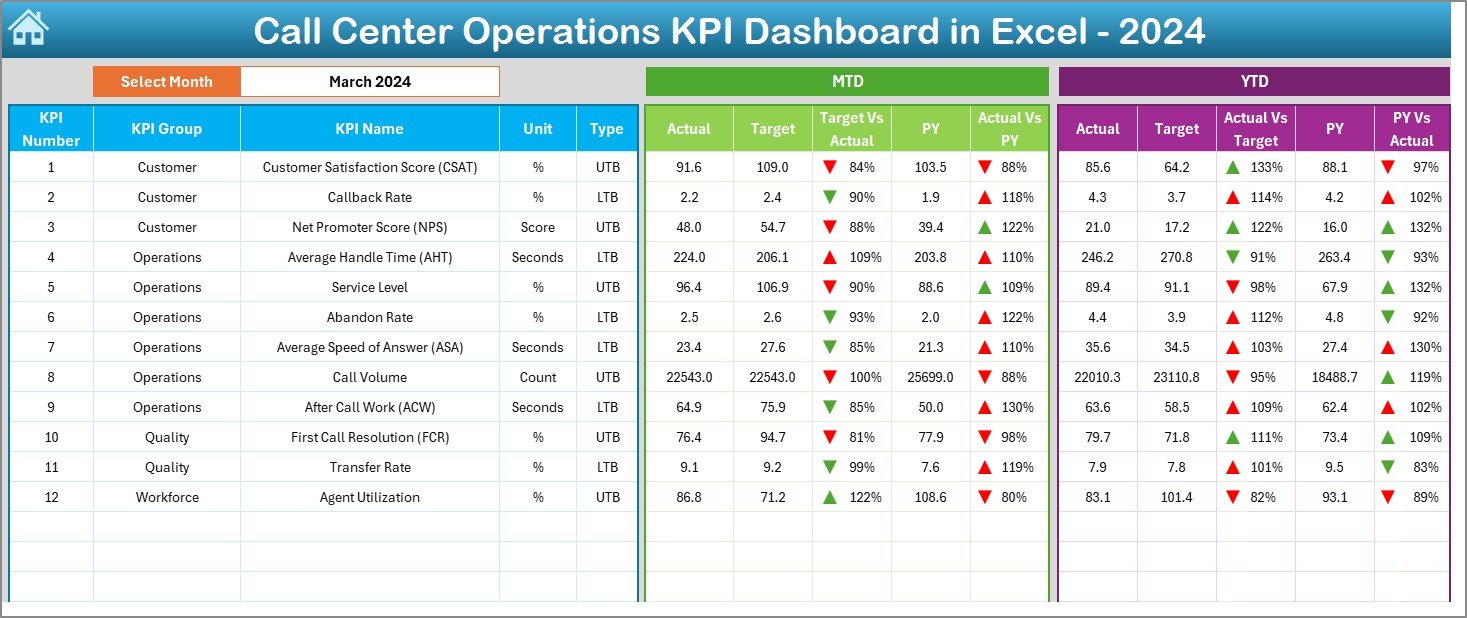
The Dashboard sheet is the heart of the report. It displays all major call center KPIs in one place so managers get a complete picture within seconds.
Dynamic Month Selection
- Select the month from the drop-down list in cell D3
- The entire dashboard updates automatically
- KPIs refresh instantly for accurate MTD and YTD reporting
Displayed KPI Metrics
The dashboard shows:
- MTD Actual
- MTD Target
- MTD Previous Year (PY)
- Target vs Actual comparison
- PY vs Actual comparison
- YTD Actual
- YTD Target
- YTD Previous Year
- Conditional formatting arrows
- Up arrow when performance improves
- Down arrow when performance drops
This helps managers understand performance trends within seconds and take action.
Why This Matters
Call center leaders monitor many KPIs, such as:
- Average Handle Time (AHT)
- First Call Resolution (FCR)
- Service Level (SL %)
- Abandon Rate
- Agent Occupancy
- Customer Satisfaction (CSAT)
- Call Volume
By combining all these metrics on one dashboard, decision-making becomes easier, faster, and more accurate.
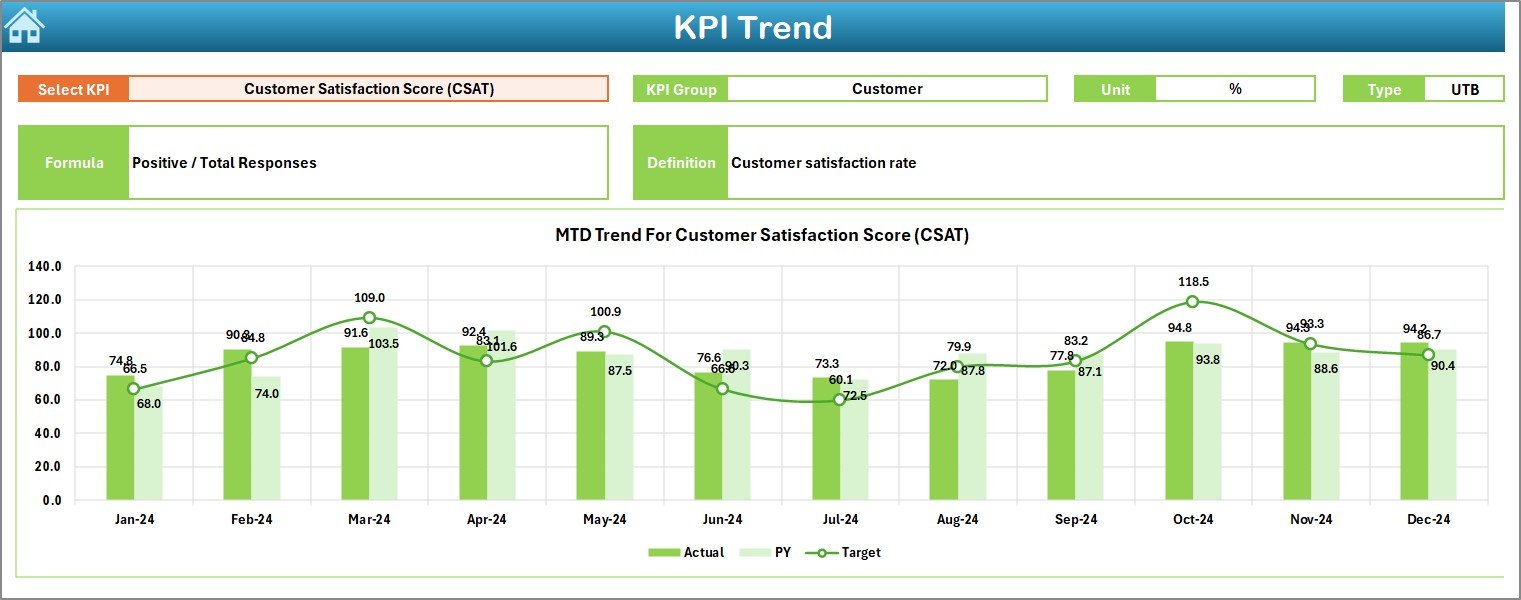
Trend Sheet – Deep KPI Analysis
The Trend Sheet allows users to explore the performance of a specific KPI over time. You choose the KPI name using the drop-down in C3.
Displayed Information
Once selected, the sheet shows:
- KPI Group
- KPI Unit
- KPI Type (Lower the Better or Upper the Better)
- Formula used for the KPI
- KPI Definition
These details help team members understand how each KPI works and why it matters.
MTD and YTD Trend Charts
The chart displays:
- MTD Actual vs Target vs Previous Year
- YTD Actual vs Target vs Previous Year
This visual trend analysis helps managers:
- Identify performance patterns
- Predict issues early
- Compare progress across months
- Check whether yearly goals stay on track
Click to buy Call Center Operations KPI Dashboard in Excel
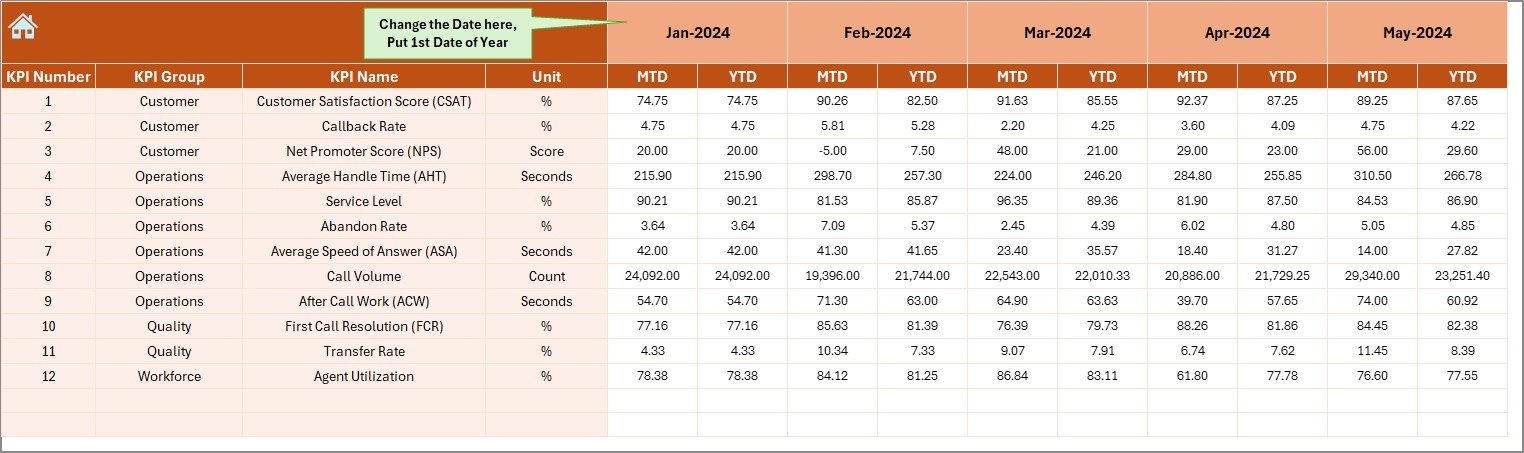
Actual Numbers Input Sheet – MTD and YTD Data Entry
This sheet is where users enter actual performance numbers for:
- Month-to-Date (MTD)
- Year-to-Date (YTD)
Managers update the first month of the year in cell E1. After that, all other month columns adjust automatically.
Benefits
- No manual formula work
- Clean, structured layout
- Easy monthly updates
- Prevents calculation mistakes
This sheet ensures all dashboard visuals remain accurate and timely.
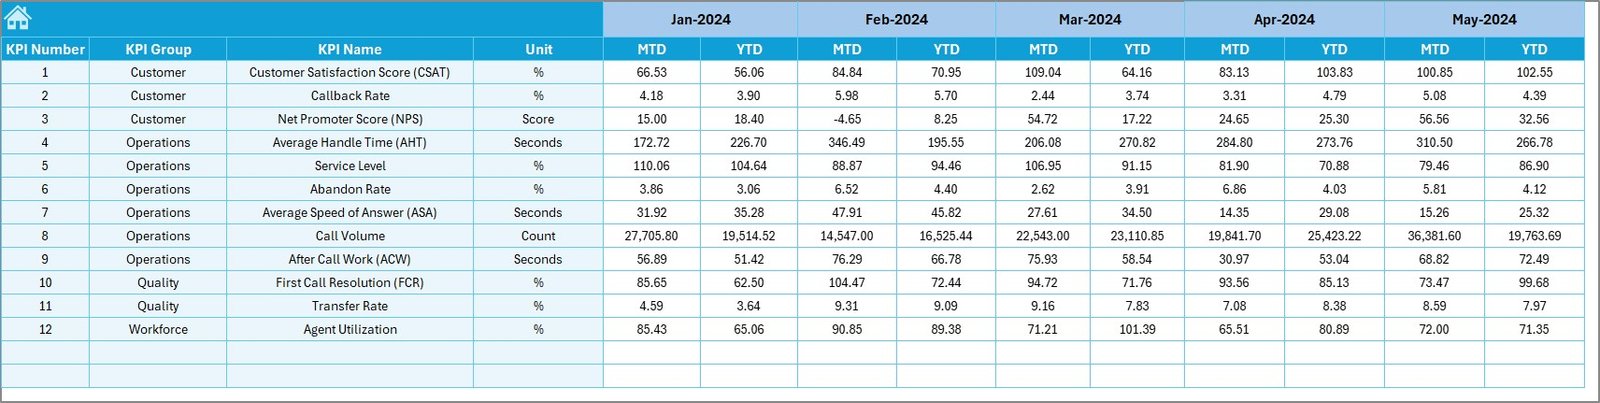
Target Sheet – Monthly KPI Targets
The Target Sheet allows users to enter monthly targets for each KPI. You input:
- MTD Targets
- YTD Targets
Setting clear targets helps call centers:
- Measure performance correctly
- Maintain accountability
- Drive continuous improvement
- Keep agents aligned with company goals
When targets change, the dashboard reflects the change immediately.
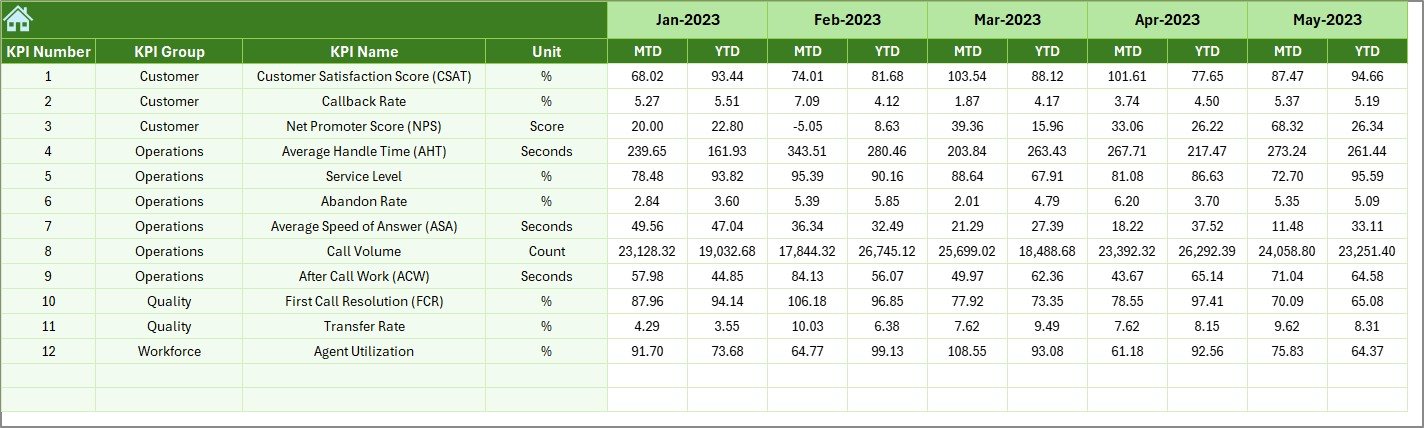
Previous Year Numbers Sheet – PY Benchmarking
This sheet contains the previous year’s performance data for all KPIs. It helps managers compare historical performance with the current year.
Why PY Data Is Important
- Shows long-term trends
- Highlights improvement areas
- Supports leadership reporting
- Helps plan future targets
When you enter data in this sheet, all comparisons in the Dashboard and Trend sheets update automatically.
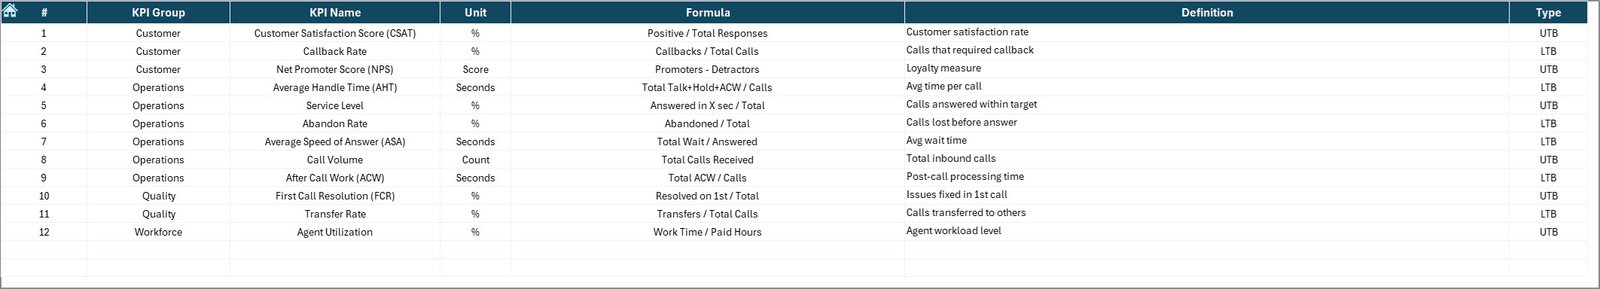
KPI Definition Sheet – Complete KPI Dictionary
This sheet serves as a reference guide for all KPIs. You can enter:
- KPI Name
- KPI Group
- KPI Unit
- Formula
- KPI Definition
This keeps all team members aligned and reduces confusion. New employees understand KPIs faster, managers explain performance easily, and reporting stays consistent.
What KPIs Should Call Centers Track?
Below are some commonly tracked KPIs included in call center dashboards:
- Average Handle Time (AHT)
- Customer Satisfaction Score (CSAT)
- First Call Resolution (FCR)
- Call Abandonment Rate
- Service Level (%)
- Average Speed of Answer (ASA)
- Agent Utilization Rate
- Repeat Call Rate
- Net Promoter Score (NPS)
- Call Volume (Inbound and Outbound)
- Escalation Rate
Tracking these KPIs helps you build a high-performance call center.
How Does This Dashboard Help Call Centers Improve Performance?
This dashboard supports decision-making in many ways:
Faster decision-making
Managers view all KPIs in one place.
More accurate reporting
Automatic formulas reduce errors.
Better agent management
You monitor agent productivity and highlight training needs.
Improved customer experience
You track customer satisfaction and issue resolution trends.
Stronger operational control
You understand call traffic patterns and resource needs.
Easy comparison
You compare MTD, YTD, and PY numbers instantly.
Advantages of the Call Center Operations KPI Dashboard in Excel
This dashboard provides many advantages that enhance call center performance.
- Simple and User-Friendly
You track complex KPIs through an easy Excel layout.
- Fully Dynamic
You change months, update numbers, and view trends instantly.
- Faster Problem Identification
Conditional formatting alerts you when performance drops.
- Cost Effective
You do not need any expensive BI tools or advanced software.
- Easy to Customize
You can add new KPIs, modify formulas, or update layouts anytime.
- Better Monitoring of Monthly and Yearly Performance
MTD and YTD comparison makes planning easier.
- Supports Data-Driven Culture
Managers rely on facts instead of guesswork.
- Saves Time
Automated formulas reduce manual reporting work.
Best Practices for Using a Call Center KPI Dashboard
To get maximum value from this dashboard, follow these best practices.
- Update Data Regularly
Enter actual numbers every month without delay.
- Set Clear and Realistic Targets
Targets must support company goals and motivate agents.
- Train Your Team
Explain dashboard usage so that everyone reads KPIs correctly.
- Review Trends Weekly
Weekly monitoring helps you solve issues before they grow.
- Use KPI Definitions
Ensure all team members understand how each KPI works.
- Compare with Previous Year
Identify long-term improvements or performance drops.
- Keep Layout Clean
Avoid clutter and maintain a user-friendly dashboard.
- Communicate Insights Clearly
Share dashboard findings with management and frontline teams.
Conclusion
A Call Center Operations KPI Dashboard in Excel is a powerful and easy-to-use tool for enhancing customer service performance. It brings all KPIs together, improves visibility, ensures better decision-making, and helps leaders respond quickly to operational challenges. With its structured sheets, trend analysis, dynamic month selection, and clear visuals, this dashboard becomes an essential asset for every call center.
When teams use this dashboard consistently, they improve service quality, increase customer satisfaction, and achieve better operational results throughout the year.
Frequently Asked Questions (FAQs)
- What is a Call Center KPI Dashboard?
- A Call Center KPI Dashboard is a performance-tracking tool that displays important call center metrics such as AHT, FCR, and CSAT in a visual format.
- Why should call centers use Excel dashboards?
- Excel dashboards are cost-effective, easy to update, and do not require any technical skills or software installations.
- Can I customize the KPIs in this dashboard?
- Yes, you can add, remove, or modify KPIs based on your call center requirements.
- How often should I update the actual numbers?
- You should update MTD and YTD numbers monthly to maintain accurate performance tracking.
- Does this dashboard support trend analysis?
Yes, the Trend sheet shows MTD and YTD performance for Actual, Target, and Previous Year.
- Is previous year data required?
Yes, PY data helps in comparison and long-term performance evaluation.
- Who can use this dashboard?
Call center managers, team leaders, operations heads, and quality analysts can use this dashboard.
- Do I need Excel skills to use the dashboard?
Basic Excel knowledge is enough. The dashboard works through drop-downs, formulas, and automatic charts.
Visit our YouTube channel to learn step-by-step video tutorials
Watch the step-by-step video tutorial:
Click to buy Call Center Operations KPI Dashboard in Excel