Welcome to our detailed guide on the Camping Resorts Dashboard in Power BI. This ready-to-use Power BI dashboard is designed specifically for camping resort managers and analysts to track performance, revenue, guest satisfaction, and more in real time. Simply update your data file, connect it to the Power BI file, and hit the Refresh button to get an updated and actionable view of your business metrics.
High-level summary cards for quick information at a glance
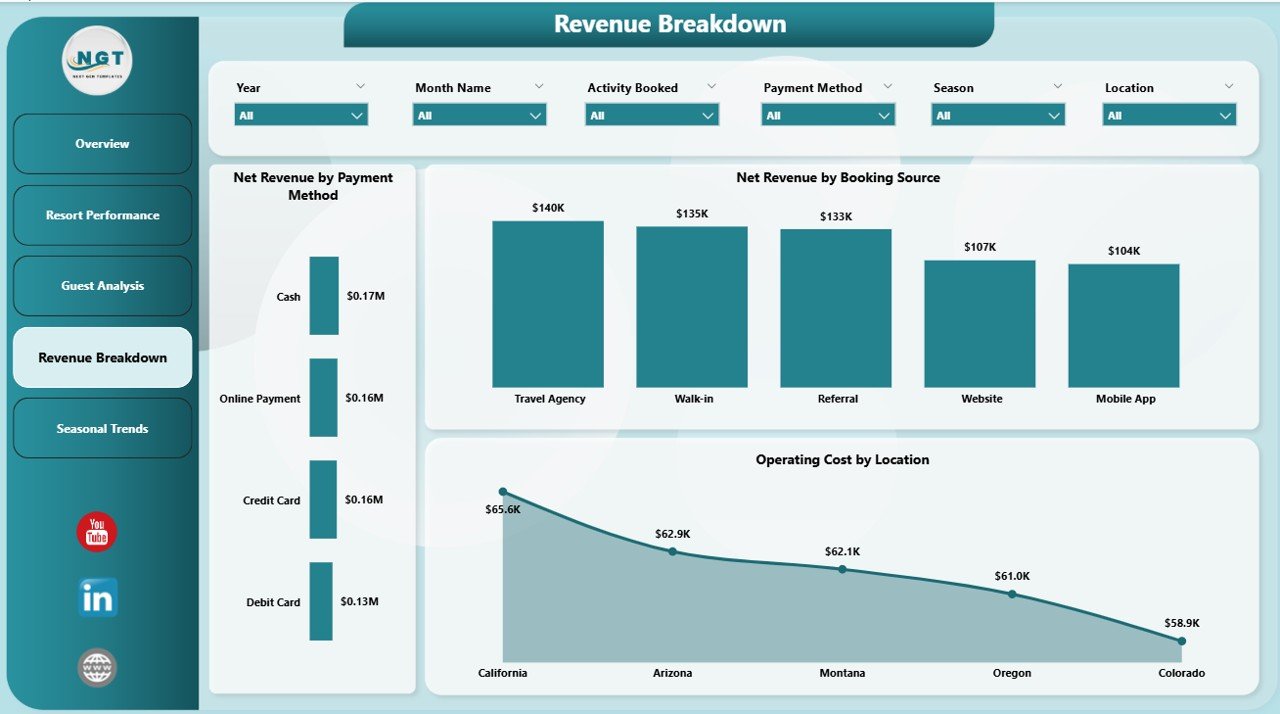
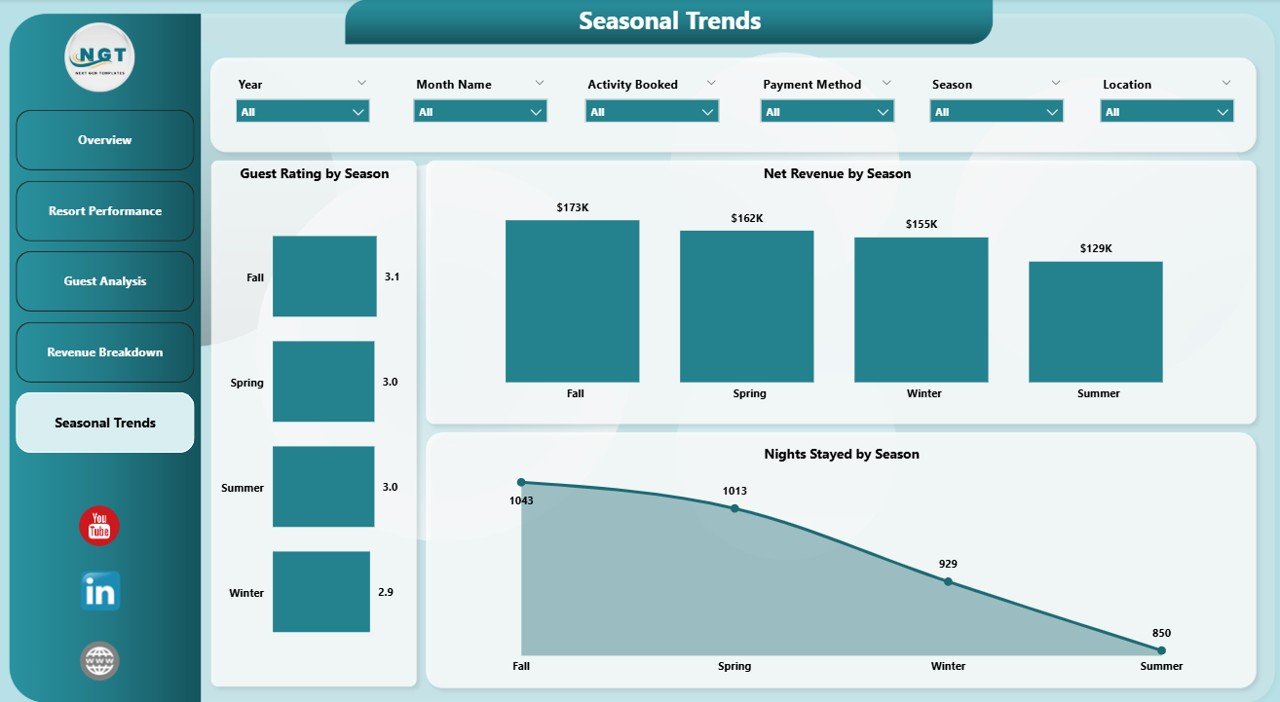
Rich visualizations including bar charts, pie charts, and trend analyses
Multiple slicers for dynamic filtering and quick data segmentation
Easy connectivity and refresh functionality ensuring up-to-date data
Dashboard Pages Explanation
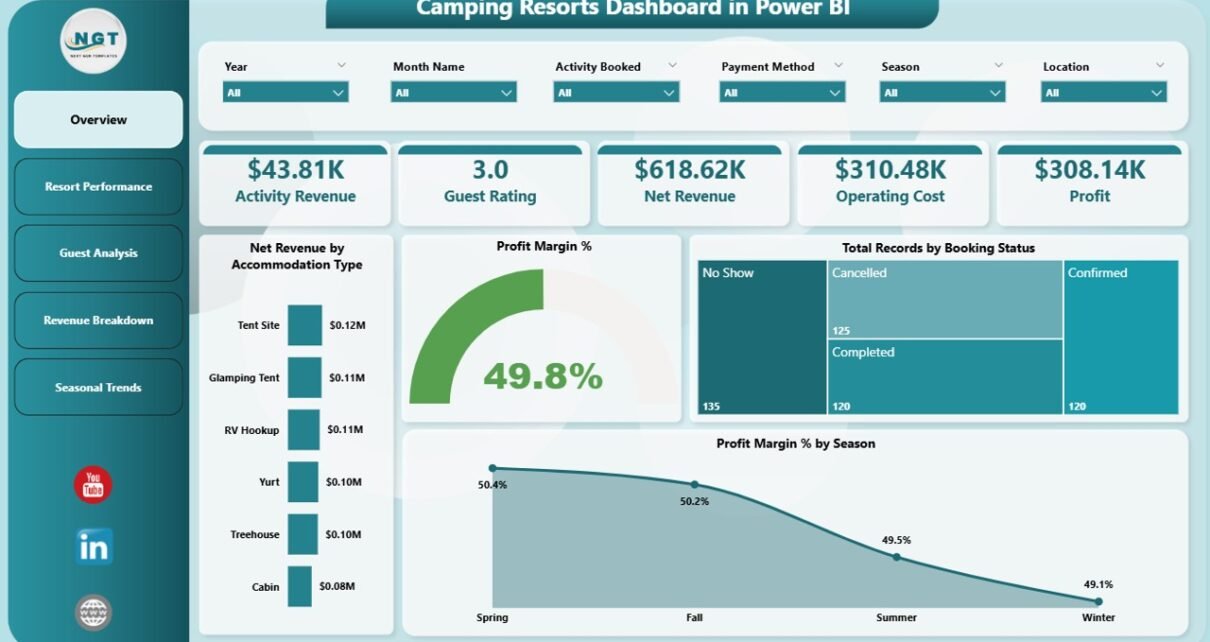
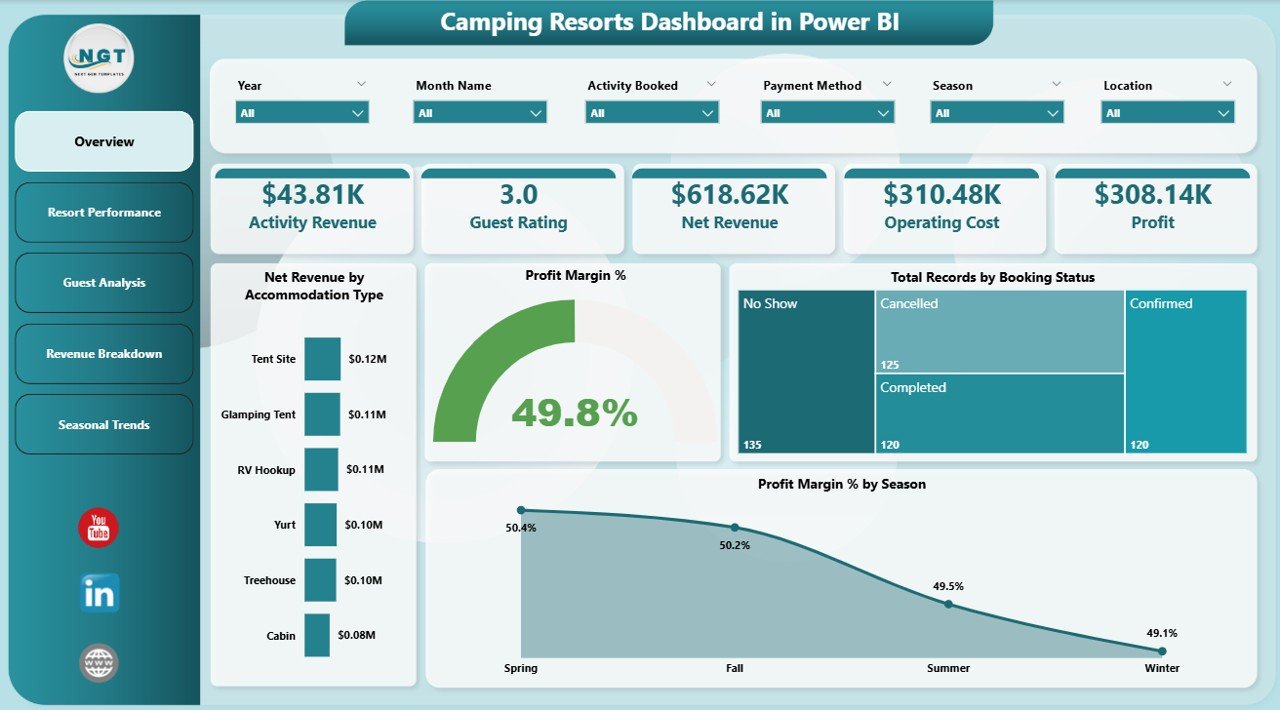
1 – Overview Page
This page offers a strategic snapshot of your camping resort’s key metrics. At the top, there are several cards highlighting important KPIs:
Activity: Displays the total number of activities booked.
Revenue: Shows the total revenue generated.
Guest Rating: Average guest satisfaction rating.
Net Revenue: Revenue after deducting costs.
Operating Cost: Total expenses incurred.
Profit: Calculated profit from operations.
Below the cards, interactive charts provide deeper insights:
Net Revenue by Accommodation Type: This chart breaks down net revenue by lodging options, helping you identify your best-performing accommodation types.
Profit Margin %: Displays the profit efficiency percentage across all offerings.
Total Records by Booking Status: Visualizes how many bookings are confirmed, canceled, or pending.
Profit Margin % by Season: Highlights profitability variations across different seasons, helping in strategic planning.
The Camping Resorts Dashboard in Power BI is a powerful tool empowering resort managers to track metrics, analyze trends, and make data-driven decisions effortlessly. With its easy update process and visually engaging reports, it is tailored to meet the dynamic needs of the camping resort industry.
Explore more about Power BI capabilities from Microsoft Power BI Official Site to enhance your data analytics strategy.
Visit our YouTube channel to watch the demo.
Meet PK, the founder of PK-AnExcelExpert.com! With over 15 years of experience in Data Visualization, Excel Automation, and dashboard creation. PK is a Microsoft Certified Professional who has a passion for all things in Excel. PK loves to explore new and innovative ways to use Excel and is always eager to share his knowledge with others. With an eye for detail and a commitment to excellence, PK has become a go-to expert in the world of Excel. Whether you're looking to create stunning visualizations or streamline your workflow with automation, PK has the skills and expertise to help you succeed. Join the many satisfied clients who have benefited from PK's services and see how he can take your Excel skills to the next level!
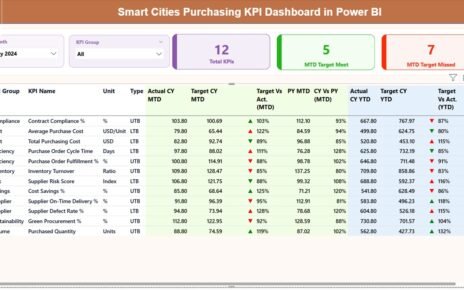
Smart cities demand speed, transparency, cost efficiency, and accountability in every public purchasing decision. However, managing procurement data across multiple
This website uses cookies to improve your user experience, analyze site traffic and serve targeted ads in accordance with our Privacy PolicyACCEPT
Privacy & Cookies Policy
Privacy Overview
This website uses cookies to improve your experience while you navigate through the website. Out of these cookies, the cookies that are categorized as necessary are stored on your browser as they are essential for the working of basic functionalities of the website. We also use third-party cookies that help us analyze and understand how you use this website. These cookies will be stored in your browser only with your consent. You also have the option to opt-out of these cookies. But opting out of some of these cookies may have an effect on your browsing experience.
Necessary cookies are absolutely essential for the website to function properly. This category only includes cookies that ensures basic functionalities and security features of the website. These cookies do not store any personal information.
Any cookies that may not be particularly necessary for the website to function and is used specifically to collect user personal data via analytics, ads, other embedded contents are termed as non-necessary cookies. It is mandatory to procure user consent prior to running these cookies on your website.