Introduction
The Cargo Drone Startups Dashboard is a powerful, ready-to-use Excel dashboard designed to give comprehensive insights into the operational, financial, and market performance of cargo drone startups. By simply updating the data in the Data sheet and refreshing through the Excel Ribbon, users can instantly visualize up-to-date analytics that drive informed business decisions.
Click to Purchases Cargo Drone Startups Dashboard in Excel
Key Features of Cargo Drone Startups Dashboard
- Easy data update by modifying the Data sheet and refreshing the dashboard.
- Interactive slicers for quick, customizable filtering of data.
- Multiple pages offering focused, detailed analysis on different aspects of cargo drone startups.
- Comprehensive cards presenting key metrics such as Total Revenue, Total Deliveries, and Total Funding.
- Dynamic pivot tables powering the entire dashboard for smooth data manipulation.
- Visually rich charts that simplify complex data interpretations.
Dashboard Pages Explanation
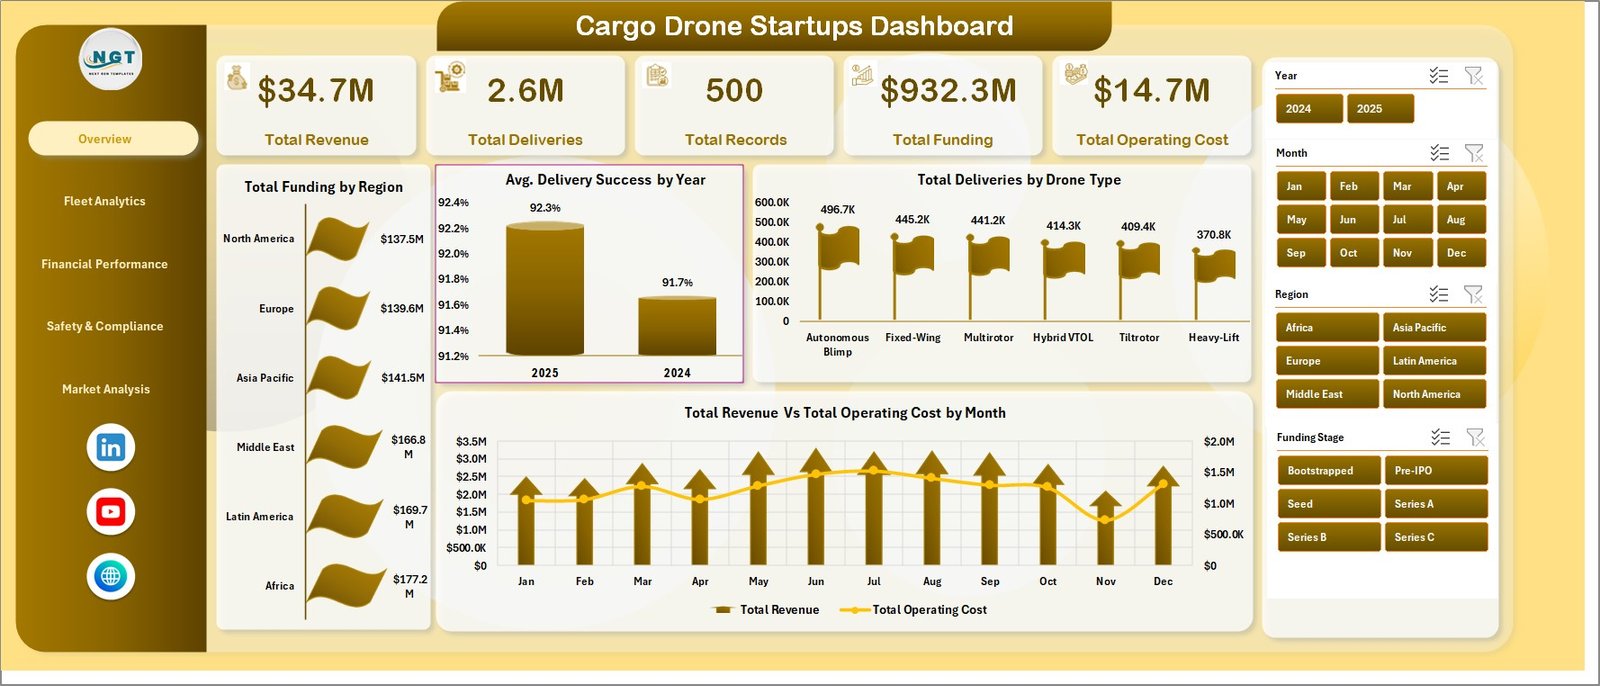
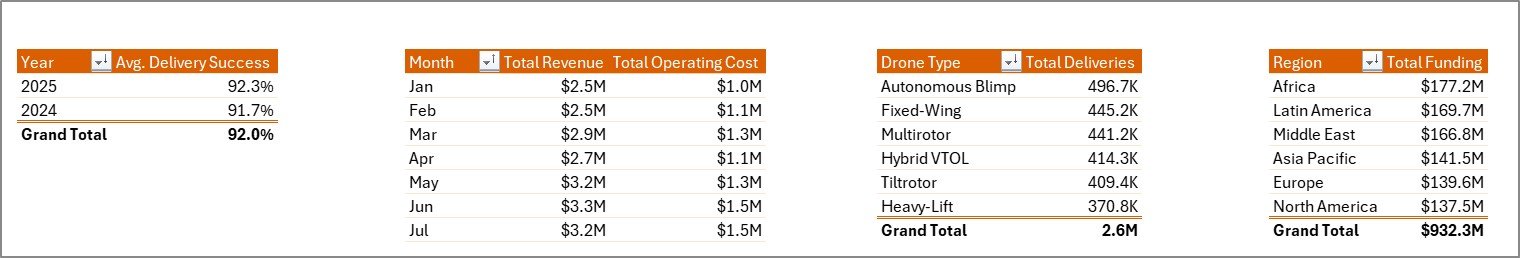
1. Overview Page
This page provides a high-level snapshot of the cargo drone startup ecosystem through cards and charts.
- Total Revenue: Shows the aggregate revenue generated across all startups.
- Total Deliveries: Displays the total number of deliveries completed.
- Total Records: Represents the total dataset entries available for analysis.
- Total Funding: Summarizes the capital invested into startups.
- Total Operating Cost: Indicates collective operational expenses.
Charts on Overview Page:
- Total Funding by Region: Visualizes funding distribution across various geographic regions.
- Avg. Delivery Success by Year: Tracks the average success rate of deliveries annually.
- Total Deliveries by Drone Type: Breaks down delivery volume by drone model or type.
- Total Revenue Vs Total Operating Cost by Month: Compares revenue against operating cost trends monthly.
-
Click to Purchases Cargo Drone Startups Dashboard in Excel
Cargo Drone Startups Dashboard
2. Fleet Analytics
This section focuses on the fleet management and operational insights of drones across startups.
- Total Fleet Vs Total Records by Drone Type: Compares number of drones owned to recorded data by drone type.
- Total Deliveries by Region: Highlights deliveries distribution geographically.
- Avg. Payload Capacity by Payload Category: Analyzes average payload weights sorted by category.
- Total Fleet Vs Total Records by Funding Stage: Shows drone count and records segmented by funding stages.
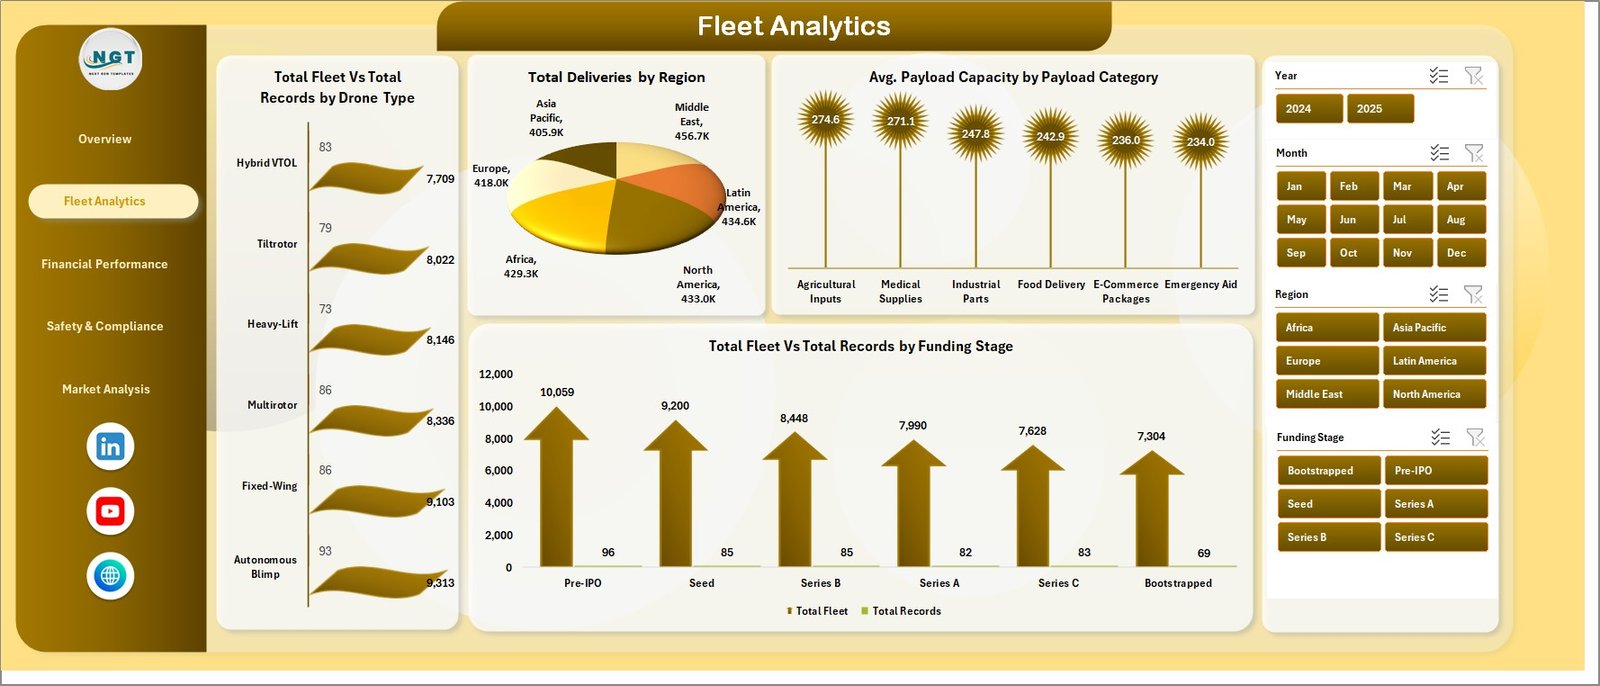
Fleet Analytics
3. Financial Performance
This page delivers insights into the financial health and funding progress of the startups.
- Total Revenue Vs Total Fleet by Month: Monthly comparison of revenue generated versus fleet size.
- Net Income by Region: Displays profitability across different regions.
- Total Funding Vs Total Records by Funding Stage: Visualizes funding and records by startup maturity levels.
- Total Revenue Vs Total Operating Cost by Company Name: Company-level financial performance overview.
-
Click to Purchases Cargo Drone Startups Dashboard in Excel
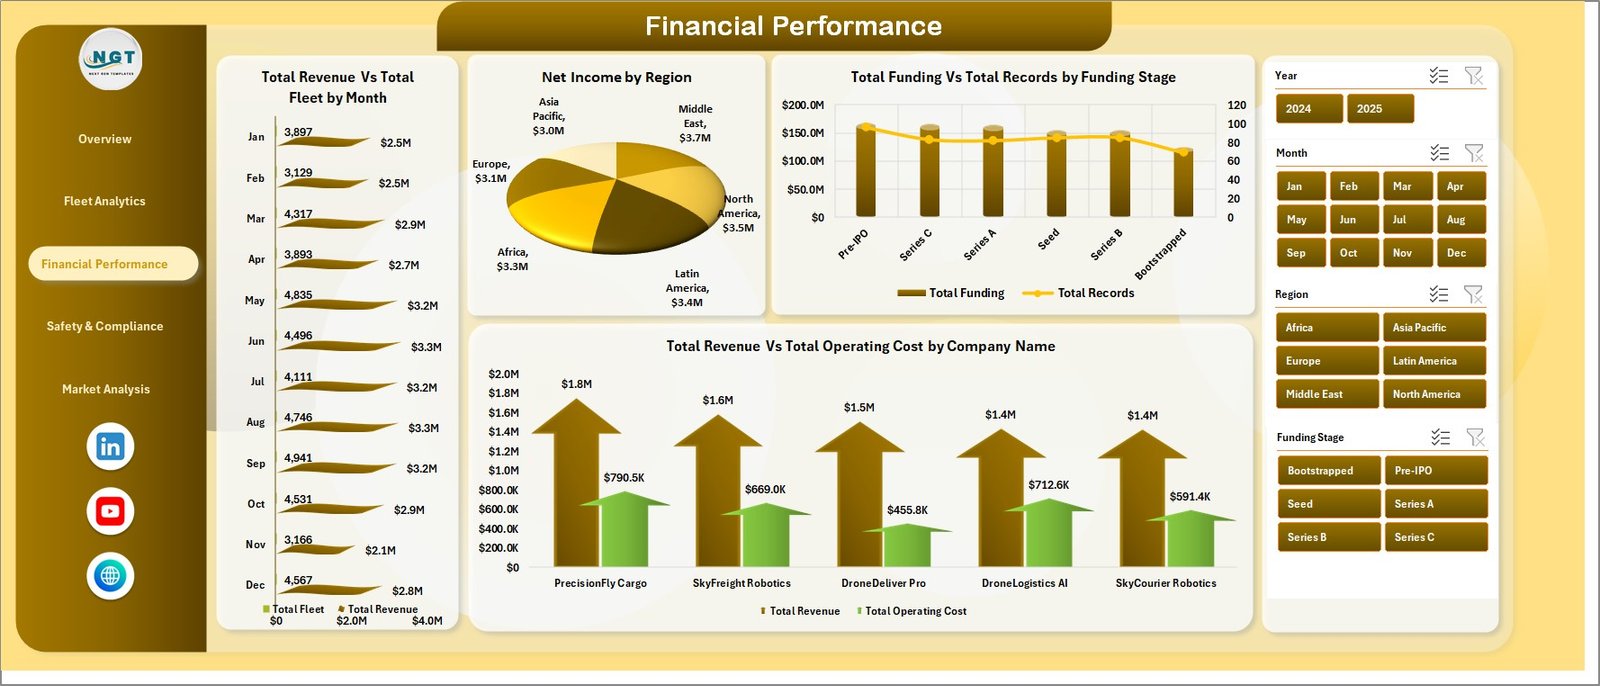
Financial Performance
4. Safety & Compliance
This tab focuses on the regulatory and safety aspects critical to drone operations.
- Total Incidents Vs Total Records by Drone Type: Tracks incident frequency relative to records per drone type.
- Total Records by Regulatory Approval: Categorizes records based on compliance certifications.
- Total Approved by Region: Regional breakdown of regulatory approvals.
- Total Incidents Vs Total Deliveries by Payload Category: Incident rates measured against delivery counts by payload type.
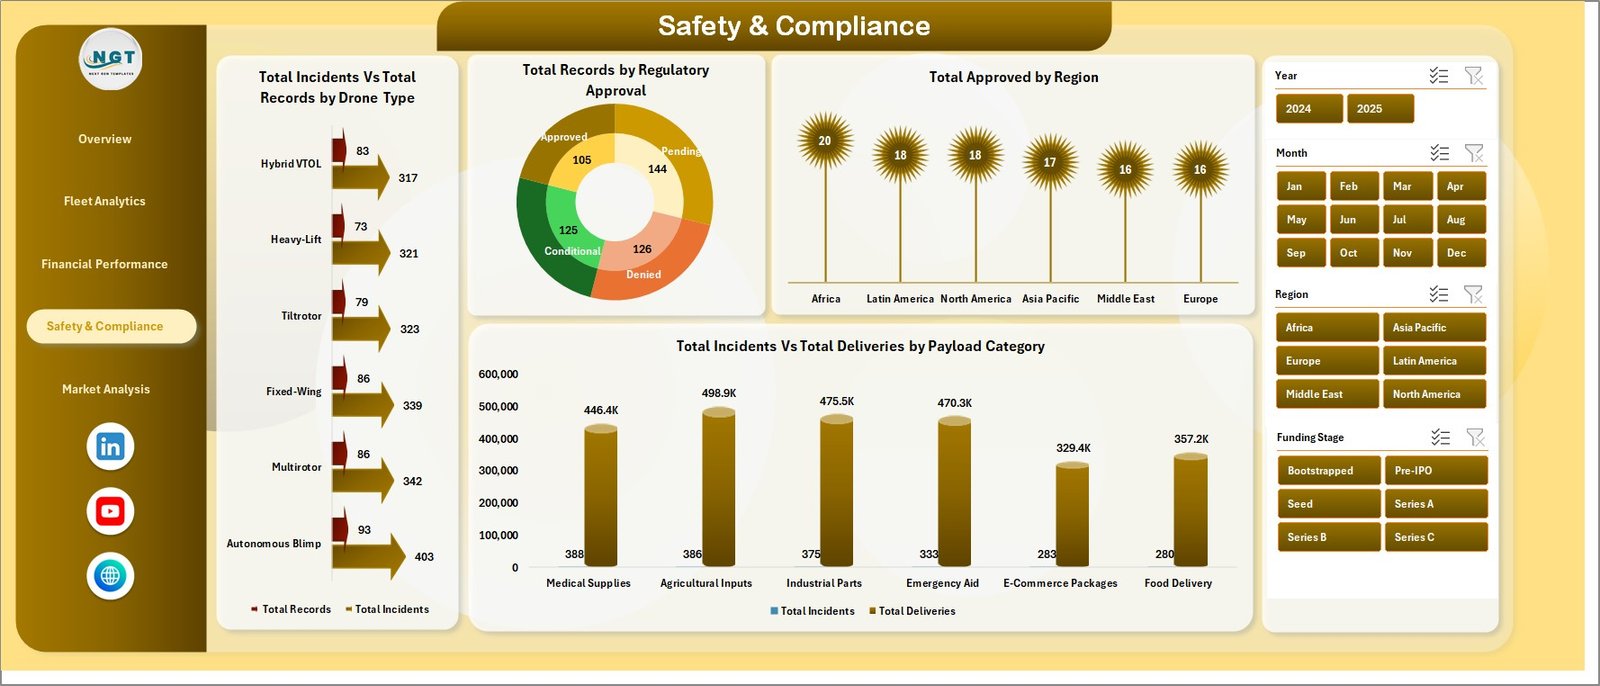
Safety & Compliance
5. Market Analysis
Deep dive into the market trends affecting cargo drone startups.
- Total Revenue Vs by Region: Breakdown of revenue generated by geographic markets.
- Total Funding by Country: Capital investments by country of operation.
- Total Revenue Vs by Drone Type: Revenue segmented according to drone models.
- Total Revenue Vs by Funding Stage: Revenue distribution aligned to different funding phases.

Market Analysis
6. Data Sheet Tab
This critical tab is where users input or update all raw data in a structured format to power the dashboard.
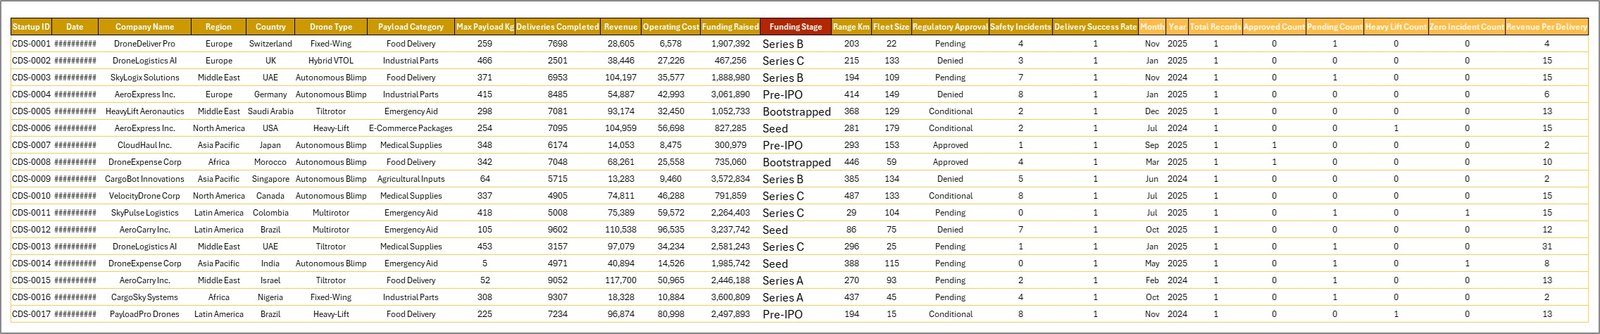
Data Sheet tab
7. Support Sheet
This hidden tab contains multiple pivot tables that underpin the dynamic nature of the dashboard, letting all charts refresh seamlessly once data updates.
Support sheet tab
Advantages of Cargo Drone Startups Dashboard
- Instant clarity on complex data through user-friendly visuals.
- Customizable filtering enables rapid insights on specific segments or regions.
- Comprehensive coverage of operational, financial, safety, and market metrics.
- Time-saving automated refresh with simple data input and refresh processes.
- Supports strategic decision-making by highlighting key performance indicators clearly.
-
Click to Purchases Cargo Drone Startups Dashboard in Excel
Opportunities for Improvement
- Incorporate predictive analytics for forecasting future delivery success or funding trends.
- Integrate external data such as weather patterns or regulatory changes impacting drone operations.
- Build mobile-friendly versions or web dashboards for wider accessibility.
- Enhance user interaction with drill-down functionalities on charts.
Best Practices
- Regularly update the Data sheet with accurate, timely data to ensure dashboard reliability.
- Use slicers effectively to explore data trends without overwhelming the view.
- Keep the Support sheet hidden to prevent accidental changes that can break pivot tables.
- Leverage dashboard insights in board meetings or investor reports for data-driven presentations.
- Back up your Excel file regularly, especially before major data updates.
FAQs
How do I refresh the dashboard after updating data?
Simply go to the Data tab in the Excel Ribbon and click Refresh All. This will update all pivot tables and refresh all charts automatically.
Can I add custom data fields to the dashboard?
Yes, but additional fields may require updating pivot tables and charts on the Support sheet to ensure proper integration.
Is this dashboard Excel version-specific?
The dashboard is compatible with Excel versions supporting pivot tables and slicers, typically Excel 2016 and later.
Can I share this dashboard with team members?
Absolutely! Share the Excel file with your team for collaborative data analysis and decision-making.
Conclusion
The Cargo Drone Startups Dashboard is a comprehensive analytical tool designed to empower stakeholders in the cargo drone industry with real-time insights. Its intuitive structure, combined with dynamic visuals and interactive filtering, makes it an essential asset for operational efficiency, financial analysis, and market strategy. By adopting this Excel dashboard, startups and investors alike can navigate the evolving cargo drone landscape with confidence and clarity.
Explore more on Microsoft’s Excel capabilities here: Microsoft Excel Support.
Visit our YouTube channel to watch the demo: Youtube.com/@NextGenTemplates
Click to Purchases Cargo Drone Startups Dashboard in Excel