Managing a catering business looks simple from the outside. However, in reality, it involves tight schedules, fluctuating demand, cost control, service quality, and customer satisfaction—all at the same time. Because of this, catering businesses need a clear and structured way to track performance. That is exactly where a Catering Services KPI Dashboard in Excel becomes a game-changer.
In this detailed guide, you will learn everything about a Catering Services KPI Dashboard in Excel. You will understand what it is, why it matters, how it works, and how you can use it to gain complete control over your catering KPIs. Moreover, you will explore its features, advantages, best practices, and frequently asked questions.
If you run a catering company, manage food services, or handle event catering operations, this article will help you make faster, smarter, and more confident decisions using Excel.
Click to Purchases Catering Services KPI Dashboard in Excel
What Is a Catering Services KPI Dashboard in Excel?
A Catering Services KPI Dashboard in Excel is a centralized performance tracking tool designed to monitor key catering metrics in one place. It converts raw catering data into meaningful insights using charts, indicators, and comparisons.
Instead of managing multiple spreadsheets for sales, costs, orders, and service quality, you can track everything on a single dashboard. As a result, you gain instant visibility into business performance.
This ready-to-use Excel template helps catering managers:
-
Track operational efficiency
-
Monitor financial performance
-
Compare actual results with targets
-
Analyze trends over time
-
Identify issues before they grow
Because Excel remains widely used, this dashboard works perfectly for small, medium, and even large catering businesses.
Why Do Catering Businesses Need a KPI Dashboard?
Catering operations change daily. Order volumes fluctuate, ingredient costs vary, and event schedules shift constantly. Therefore, relying on manual reporting creates delays and errors.
A Catering Services KPI Dashboard in Excel solves these challenges by providing:
-
Real-time performance visibility
-
Structured KPI tracking
-
Faster decision-making
-
Clear accountability
Moreover, when teams track KPIs regularly, they stay focused on what truly matters.
Common Challenges Without a KPI Dashboard
-
Scattered data across files
-
No clarity on performance trends
-
Late identification of cost overruns
-
Poor comparison between actual and target results
-
Time-consuming manual reports
Because of these reasons, a KPI dashboard becomes essential for sustainable growth.
How Does a Catering Services KPI Dashboard in Excel Work?
A Catering Services KPI Dashboard in Excel works by connecting input data with automated calculations and visuals. Once you enter actual, target, and previous-year numbers, the dashboard updates instantly.
The dashboard uses:
-
Monthly and Year-to-Date (YTD) tracking
-
Conditional formatting indicators
-
Dynamic charts and trends
-
Drop-down selections for interactivity
As a result, you can analyze performance from multiple angles without extra effort.
Overview of the Catering Services KPI Dashboard Structure
This Catering Services KPI Dashboard in Excel includes 7 well-structured worksheets. Each sheet serves a specific business purpose, which makes the dashboard easy to use and scalable.
1. Home Sheet: The Navigation Hub
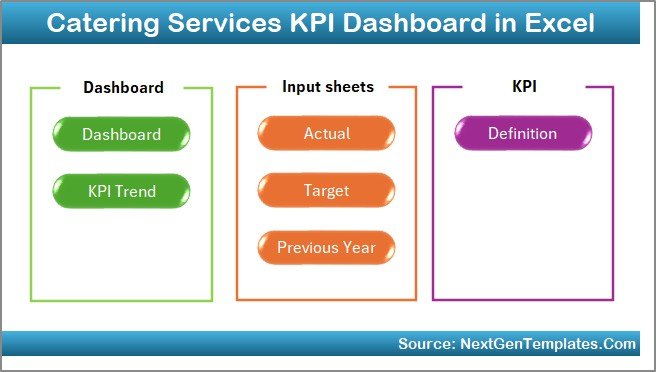
The Home Sheet acts as an index page for the entire dashboard.
Key Highlights of the Home Sheet
-
Clean and simple layout
-
Six navigation buttons
-
One-click access to each worksheet
-
No confusion while navigating
Because of this design, users can move between sheets effortlessly, even without advanced Excel knowledge.
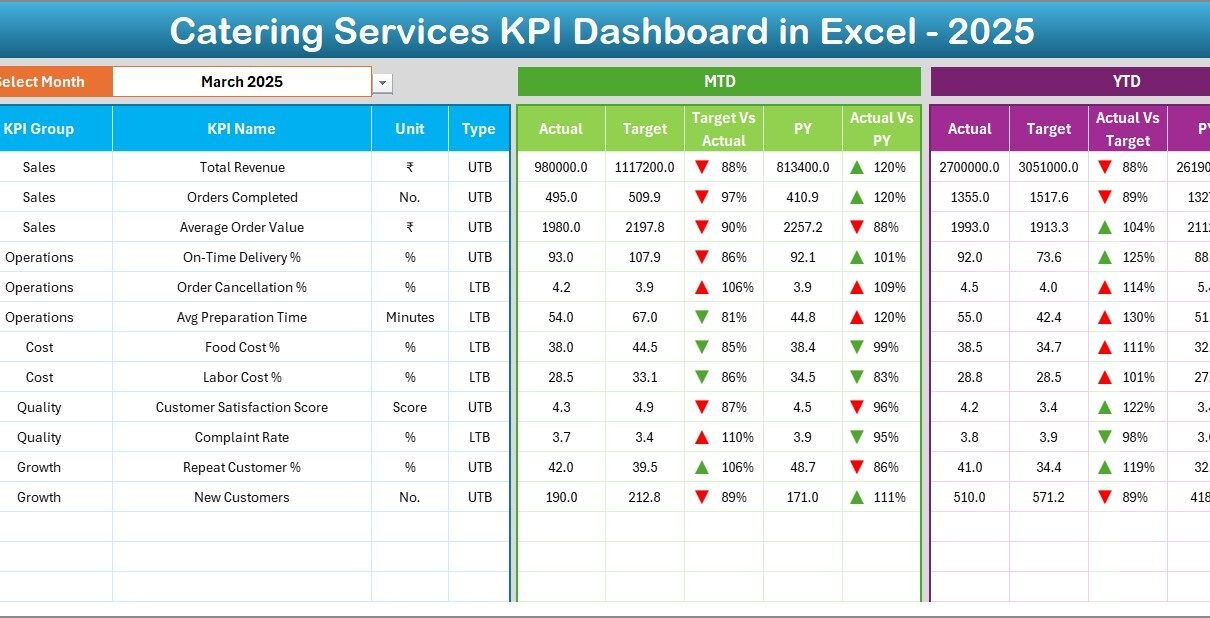
2. Dashboard Sheet: Central Performance Overview
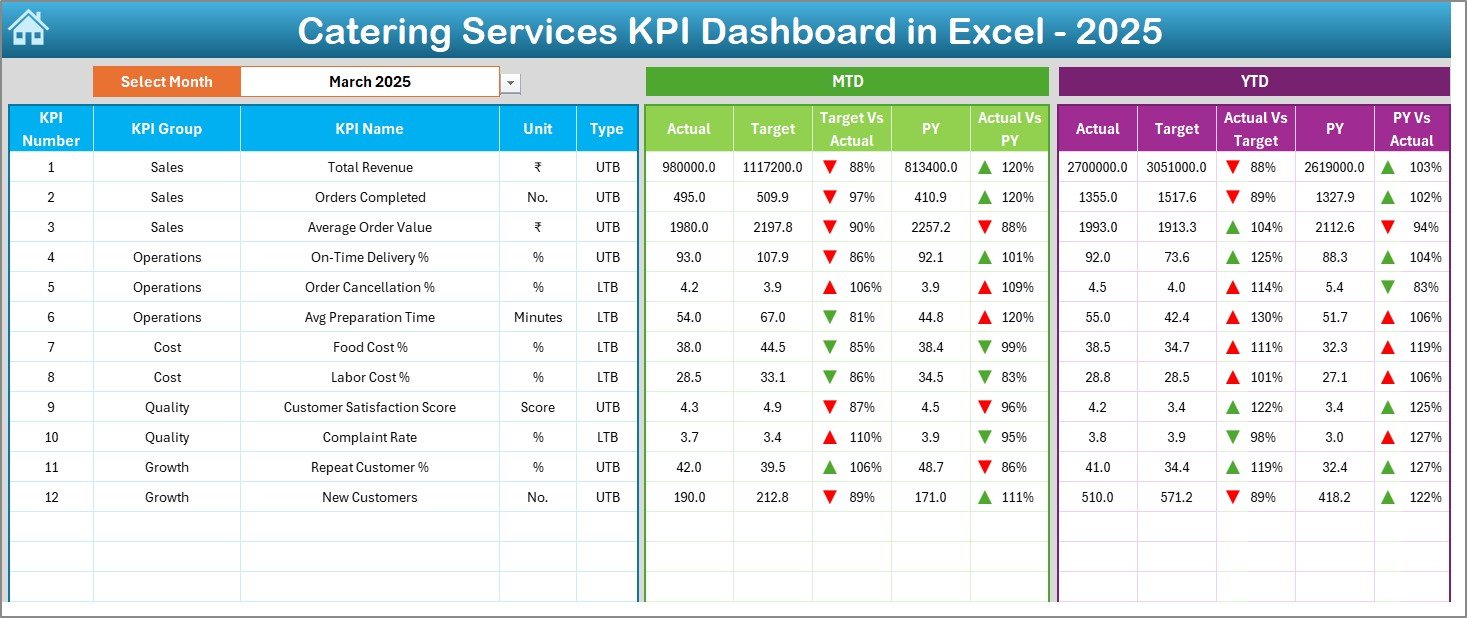
The Dashboard Sheet is the heart of the Catering Services KPI Dashboard in Excel.
Key Features of the Dashboard Sheet
Click to Purchases Catering Services KPI Dashboard in Excel
-
Month selector at cell D3
-
Automatic update of all KPIs based on selected month
-
Clear comparison of:
-
MTD Actual vs Target
-
MTD Actual vs Previous Year
-
YTD Actual vs Target
-
YTD Actual vs Previous Year
-
Visual Indicators Used
-
Up and down arrows using conditional formatting
-
Quick performance signals for decision-making
-
Easy identification of underperforming KPIs
Because of these visuals, managers can understand performance in seconds.
3. KPI Trend Sheet: Deep Performance Analysis
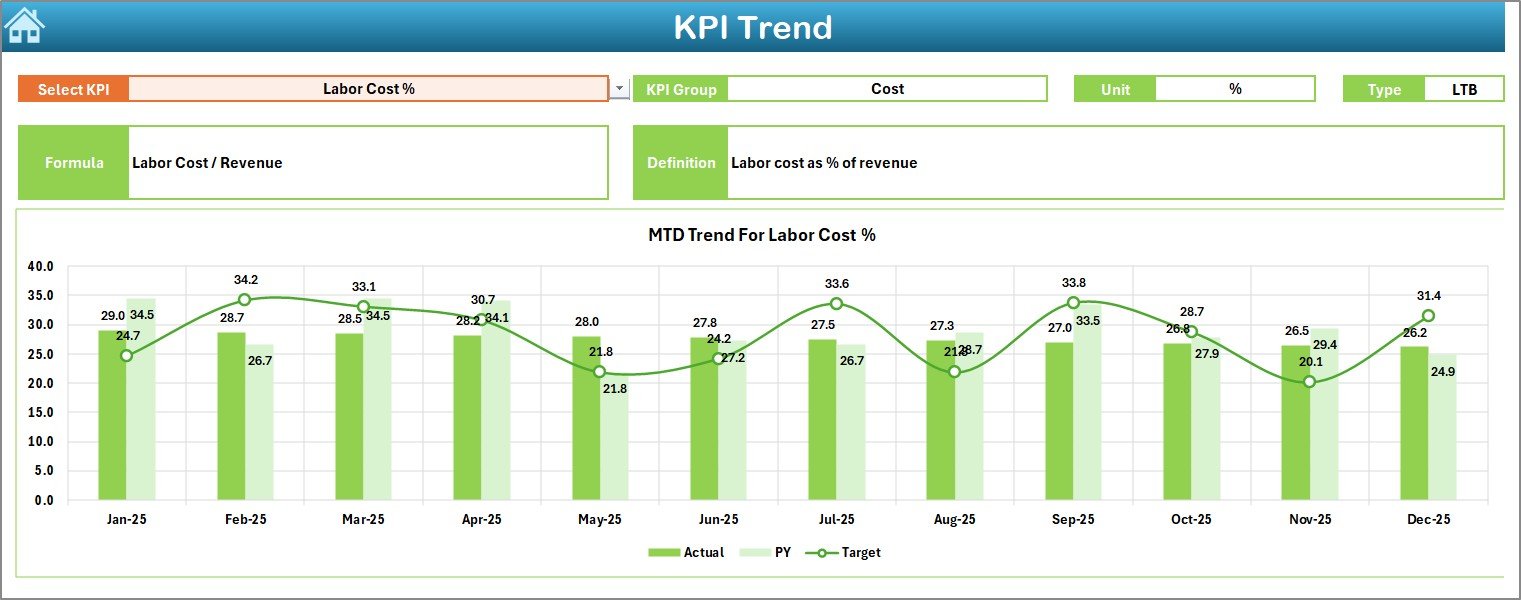
The KPI Trend Sheet allows detailed KPI-level analysis.
What You Can Do on the KPI Trend Sheet
-
Select KPI name from drop-down (Cell C3)
-
View KPI group, unit, and type
-
Understand KPI formula and definition clearly
-
Analyze MTD and YTD trends
Charts Available
-
Actual vs Target trend
-
Actual vs Previous Year trend
-
Monthly and cumulative views
As a result, managers can quickly identify whether performance improves or declines over time.
4. Actual Numbers Input Sheet: Data Entry Made Simple
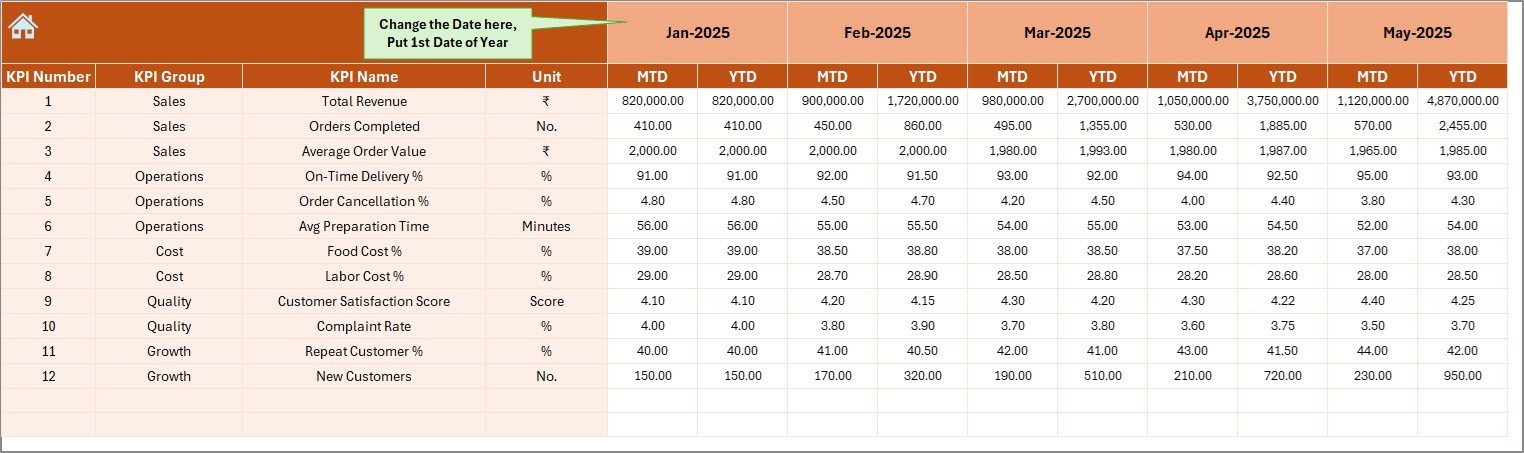
The Actual Numbers Input Sheet is where real performance data is entered.
Key Highlights
-
Enter MTD and YTD actual values
-
Month selection from cell E1
-
Automatic alignment with dashboard visuals
-
Clean data entry structure
Because data entry stays separate from analysis, the dashboard remains error-free and reliable.
5. Target Sheet: Performance Benchmarking

The Target Sheet defines expected performance goals.
Why This Sheet Matters
-
Enter monthly MTD targets
-
Enter cumulative YTD targets
-
Set clear expectations for each KPI
-
Compare actual results with planned goals
As a result, teams stay aligned with business objectives.
6. Previous Year Number Sheet: Historical Comparison

The Previous Year Number Sheet stores last year’s performance data.
Click to Purchases Catering Services KPI Dashboard in Excel
Benefits of Using Previous Year Data
-
Year-over-year performance comparison
-
Seasonal trend analysis
-
Better forecasting accuracy
-
Smarter strategic planning
Because catering businesses often face seasonal demand, this comparison becomes extremely valuable.
7. KPI Definition Sheet: Complete KPI Clarity
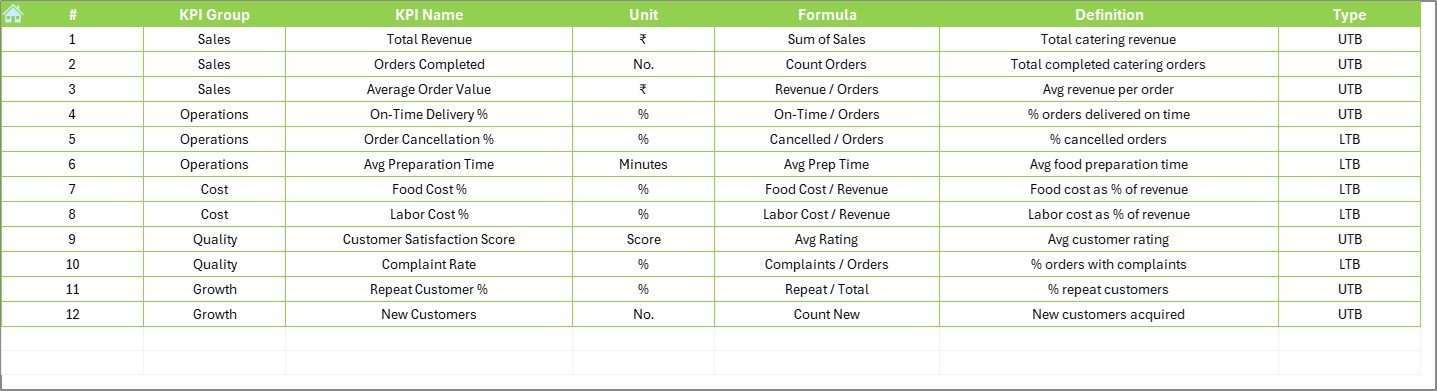
The KPI Definition Sheet acts as a reference guide.
Information Included
-
KPI Name
-
KPI Group
-
Unit of measurement
-
KPI Formula
-
KPI Definition
This sheet ensures that everyone understands KPIs the same way. As a result, confusion and misinterpretation disappear.
What KPIs Can You Track in a Catering Services KPI Dashboard?
A Catering Services KPI Dashboard in Excel can track a wide range of KPIs, including:
-
Total Orders Completed
-
Revenue per Event
-
Food Cost Percentage
-
On-Time Delivery Rate
-
Customer Satisfaction Score
-
Wastage Percentage
-
Labor Cost Ratio
-
Profit Margin
-
Repeat Customer Rate
-
Complaint Resolution Time
Because the dashboard is flexible, you can customize KPIs as per your business needs.
Advantages of a Catering Services KPI Dashboard in Excel
Using a Catering Services KPI Dashboard in Excel offers several powerful advantages.
1. Centralized Performance Monitoring
You can view all catering KPIs on a single screen. Therefore, you save time and reduce reporting complexity.
2. Faster Decision-Making
Because data updates instantly, managers can take action quickly.
3. Clear Target Tracking
Actual vs target comparisons help teams stay accountable.
4. Trend Visibility
MTD and YTD trend charts reveal long-term performance patterns.
5. Cost Control
Tracking food, labor, and wastage KPIs improves profitability.
6. Easy Customization
Excel allows you to modify KPIs, formulas, and visuals easily.
7. No Extra Software Cost
Since Excel is widely available, implementation remains affordable.
How Does This Dashboard Improve Catering Operations?
This dashboard directly impacts daily catering operations.
-
Improves planning accuracy
-
Reduces food wastage
-
Enhances service quality
-
Supports capacity management
-
Improves customer satisfaction
-
Strengthens financial control
As a result, catering businesses operate more efficiently and profitably.
Best Practices for the Catering Services KPI Dashboard in Excel
To get maximum value, follow these best practices.
1. Define KPIs Clearly
Use the KPI Definition Sheet properly. Always keep formulas and definitions simple.
2. Update Data Regularly
Enter actual numbers monthly to maintain dashboard accuracy.
3. Set Realistic Targets
Avoid unrealistic targets. Instead, base targets on historical data.
4. Review Trends, Not Just Numbers
Always analyze trends, not only single-month values.
5. Use Conditional Formatting Wisely
Keep arrows and indicators consistent for clarity.
6. Train Team Members
Ensure users understand how to input data and read visuals.
7. Review KPIs Periodically
Update KPIs as your catering business grows or changes.
Who Should Use a Catering Services KPI Dashboard in Excel?
This dashboard suits multiple roles, such as:
-
Catering business owners
-
Operations managers
-
Event managers
-
Finance teams
-
Restaurant groups offering catering
-
Corporate food service providers
Because it adapts easily, it works for small catering firms as well as large service providers.
How Is This Dashboard Better Than Manual Reports?
Manual reports consume time and often contain errors. However, this dashboard:
-
Automates calculations
-
Reduces manual effort
-
Improves accuracy
-
Saves reporting time
-
Enhances transparency
Therefore, it becomes a smarter alternative to traditional reporting.
Conclusion: Why You Should Use a Catering Services KPI Dashboard in Excel
A Catering Services KPI Dashboard in Excel gives you complete control over your catering performance. It replaces scattered spreadsheets with a structured, visual, and data-driven system.
Because it tracks actuals, targets, and previous-year data, it helps you make confident decisions. Moreover, its ready-to-use design saves time and improves efficiency from day one.
If you want to grow your catering business, improve profitability, and deliver consistent service quality, this dashboard becomes an essential tool.
Frequently Asked Questions (FAQs)
What is a Catering Services KPI Dashboard in Excel used for?
It tracks catering performance metrics like revenue, costs, service quality, and efficiency in one centralized Excel dashboard.
Is this dashboard suitable for small catering businesses?
Yes, it works perfectly for small, medium, and large catering operations.
Do I need advanced Excel skills to use this dashboard?
No, basic Excel knowledge is enough to use and update this dashboard.
Can I customize KPIs in this dashboard?
Yes, you can easily modify KPIs, formulas, and targets.
How often should I update the dashboard?
You should update it monthly for accurate MTD and YTD analysis.
Does the dashboard support year-over-year comparison?
Yes, it includes a Previous Year sheet for easy comparison.
Can this dashboard reduce catering costs?
Yes, by tracking food cost, labor cost, and wastage KPIs, it helps control expenses.
Is this dashboard ready to use?
Yes, it is a ready-to-use Excel template designed for catering KPIs.
Visit our YouTube channel to learn step-by-step video tutorials