Running a cleaning business demands speed, accuracy, and smart decision-making. You manage multiple clients, service types, locations, teams, and schedules every day. However, when you do not track performance properly, your operations slow down. Teams lose clarity, managers fail to identify problems, and financial results fluctuate without warning.
A Cleaning Services KPI Dashboard in Excel solves these issues. It gives you a clear, simple, and dynamic way to track all key performance indicators for daily, monthly, and yearly operations. You understand your business performance in seconds, not hours. As a result, you make decisions confidently and stay ahead of your targets.
In this guide, you will learn everything about this dashboard, including structure, features, advantages, and best practices. You will also see how each worksheet works and how the dashboard boosts overall business efficiency.
Click to buy Cleaning Services KPI Dashboard in Excel
What Is a Cleaning Services KPI Dashboard in Excel?
A Cleaning Services KPI Dashboard in Excel is a ready-to-use analytics template that cleaning agencies, facility management teams, housekeeping service providers, and janitorial companies use to track operational and financial KPIs. It organizes raw cleaning data into meaningful visual insights. You get charts, tables, and performance cards that help you track trends and compare key metrics across months.
The dashboard supports continuous improvement by showing:
- Monthly and yearly performance (MTD & YTD)
- Actual vs Target results
- Actual vs Previous Year comparisons
- Team performance and operational efficiency
- Client-wise and service-wise trends
- Quality, safety, and satisfaction performance
Since the dashboard works in Excel, you can refresh it with a single click whenever you update the input sheets. It requires no coding or advanced tools.
Why Do Cleaning Companies Need a KPI Dashboard?
Cleaning companies operate in a fast-moving environment. You manage resources, clients, teams, and supplies on tight deadlines. Without clear KPI tracking, small issues turn into big operational problems. Therefore, cleaning companies use Excel dashboards to:
- Track service quality
- Monitor staff performance
- Improve customer satisfaction
- Control cleaning costs
- Maintain SLA compliance
- Increase productivity
- Prevent delays and rework
A KPI dashboard connects all performance points and gives management a full 360° view of the business.
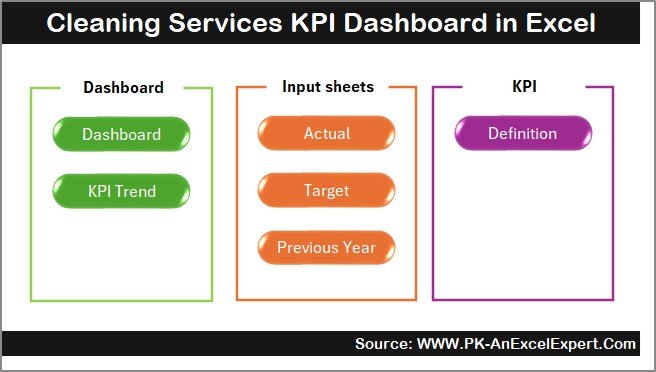
How Does the Cleaning Services KPI Dashboard in Excel Work?
This dashboard includes seven important worksheets, each designed for a specific role. You get full control over monthly data, targets, KPI definitions, previous year numbers, and trend analysis.
Below is a detailed explanation of each worksheet.
Summary Page – What Does the Summary Page Show?
The Summary Page works as an index or navigation panel for the entire dashboard. It displays six buttons that allow you to jump directly to any sheet. Instead of scrolling through multiple tabs, you reach the required page instantly.
This sheet improves user experience, especially when multiple team members use the dashboard.
Click to buy Cleaning Services KPI Dashboard in Excel
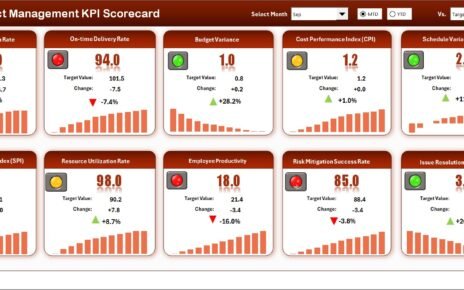
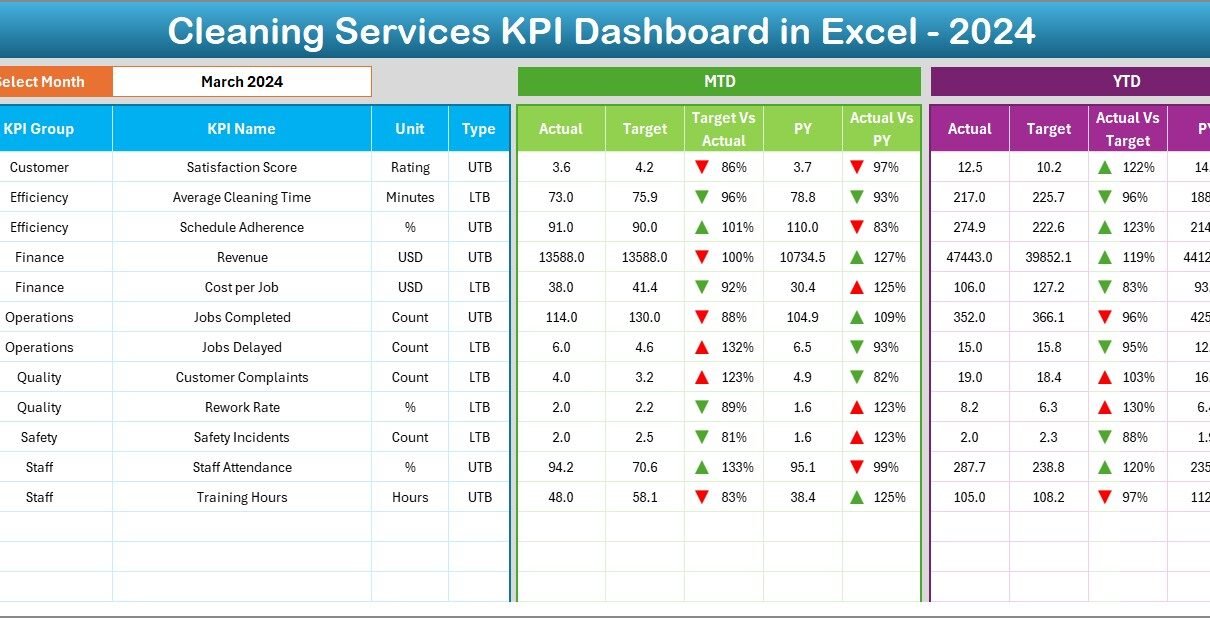
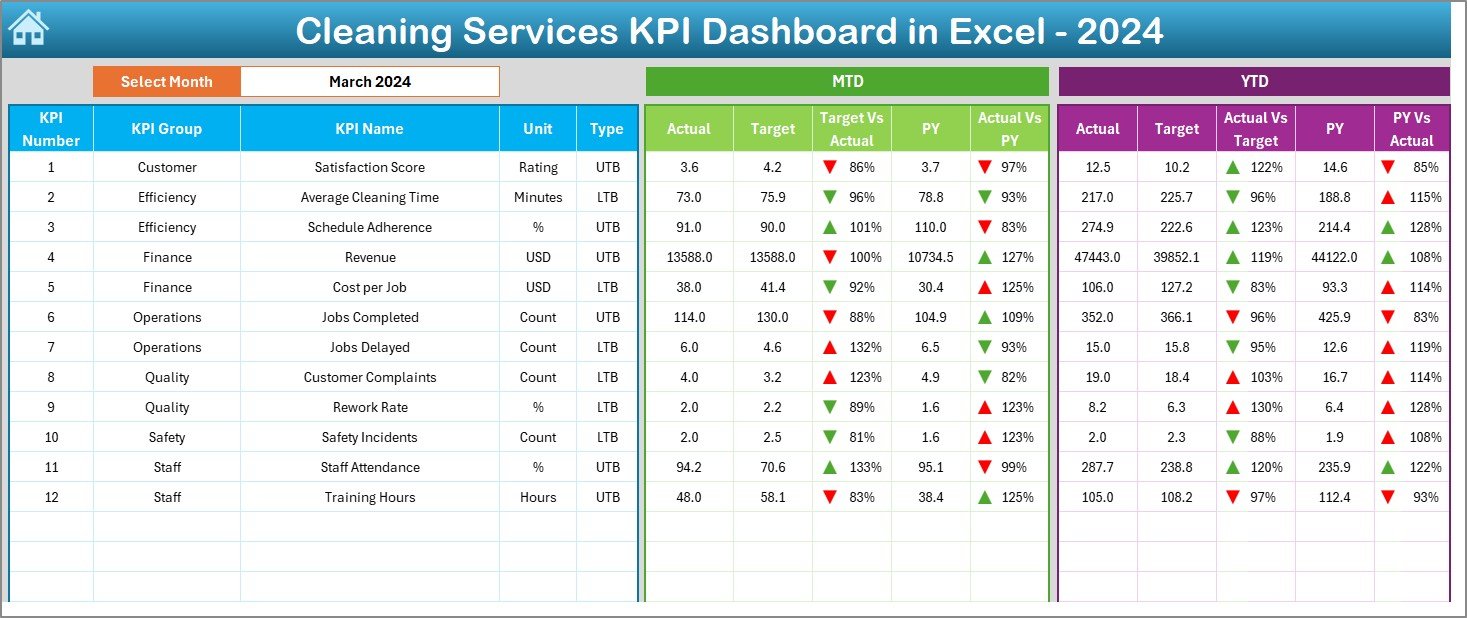
Dashboard Sheet – How Does the Main Dashboard Work?
The Dashboard Sheet is the main reporting page. It displays all KPIs in one place with dynamic visuals and conditional formatting.
Key Features of the Dashboard Sheet
- A Month selector at cell D3
- Automatic updates for all KPIs based on the selected month
- MTD and YTD analysis
- Actual, Target, and Previous Year values
- Comparison of Actual vs Target
- Comparison of Actual vs Previous Year
- Conditional formatting arrows (Up/Down)
- Color-coded indicators for quick decision-making
You see performance insights instantly. When the month changes, all numbers and visuals update automatically.
MTD (Month-To-Date) Analysis
You track:
- MTD Actual
- MTD Target
- MTD Previous Year
- MTD Actual vs Target
- MTD Actual vs PY
This helps you understand how well your team performs during the current month.
YTD (Year-To-Date) Analysis
You track:
- YTD Actual
- YTD Target
- YTD Previous Year
- YTD Actual vs Target
- YTD Actual vs PY
This comparison shows long-term performance trends.
Click to buy Cleaning Services KPI Dashboard in Excel
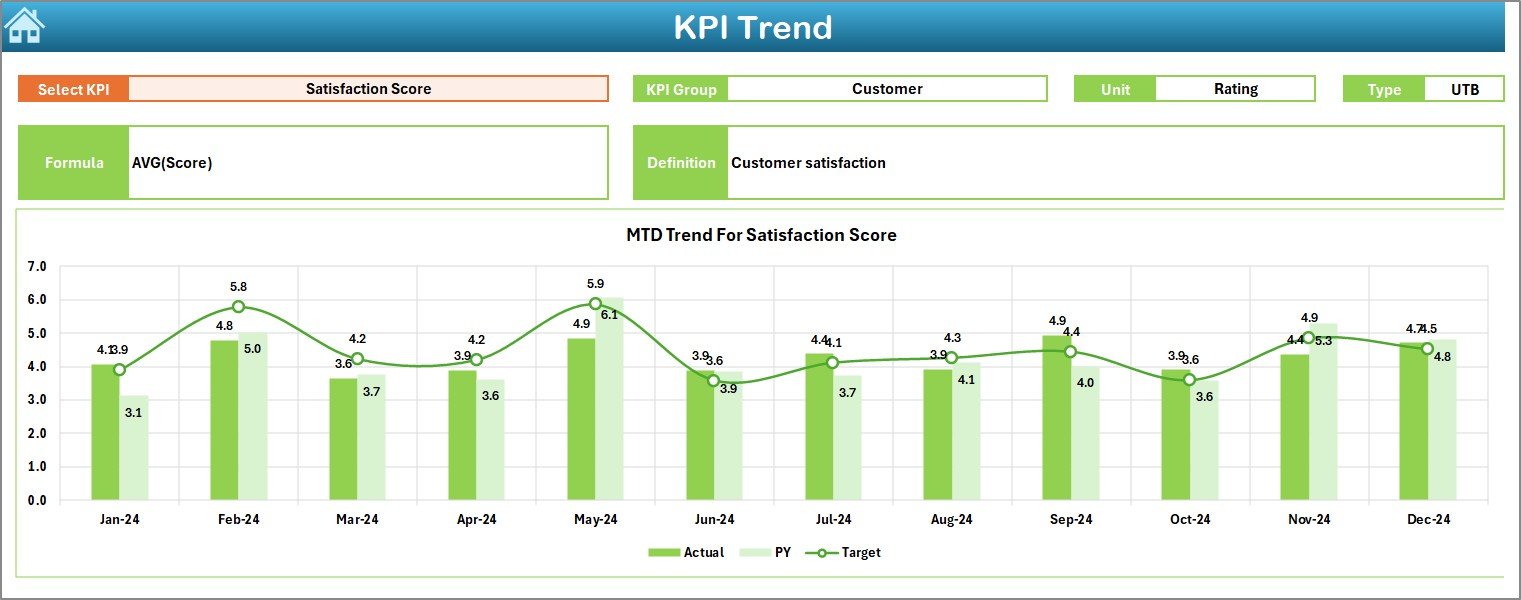
Trend Sheet – Why Is Trend Analysis Important?
The Trend Sheet gives you monthly trend charts for any KPI you choose. You select the KPI from the drop-down menu at cell C3.
What Does the Trend Sheet Display?
- KPI Group
- Unit of measurement
- KPI Type (Lower the Better / Upper the Better)
- KPI Formula
- KPI Definition
- MTD Trend charts
- YTD Trend charts
- Actual vs Target vs Previous Year comparison
Trend analysis helps you see the direction of performance. You identify which KPIs improve and which need attention.
Click to buy Cleaning Services KPI Dashboard in Excel
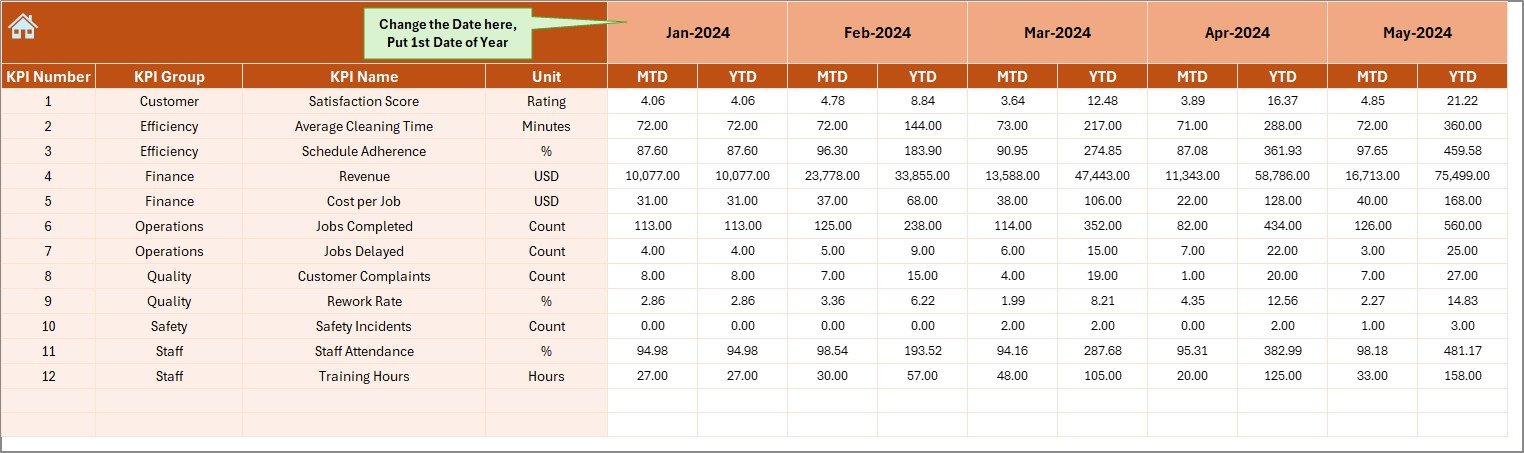
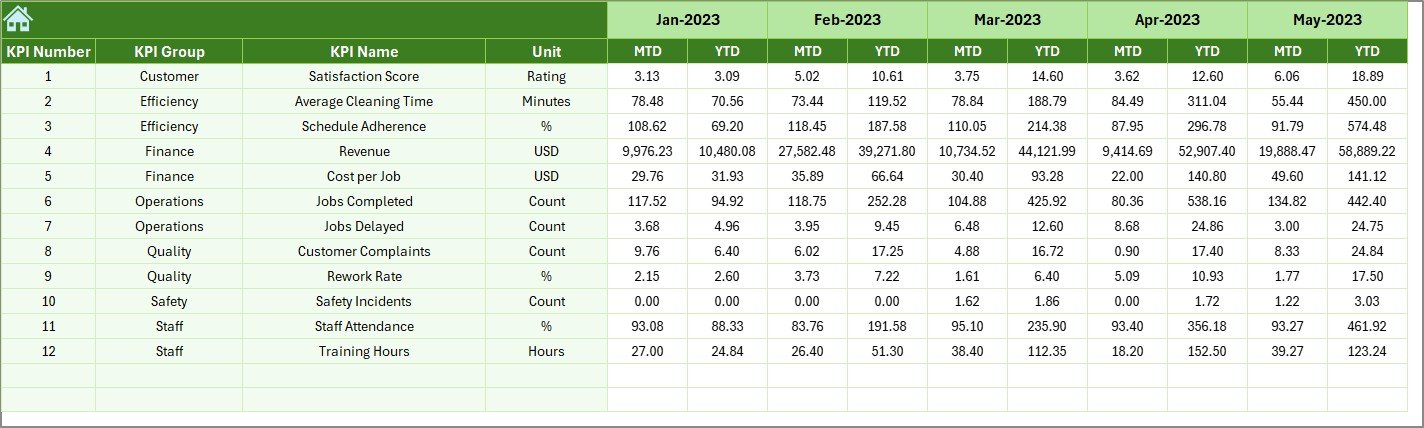
Actual Numbers Input Sheet – How Do You Enter Monthly Actuals?
The Actual Numbers Input Sheet is where you enter monthly actual performance data. The month starts from cell E1. When you update the first month of the year, all entries realign automatically.
You must enter both MTD and YTD actuals for each KPI.
This sheet ensures the dashboard pulls correct information.
Click to buy Cleaning Services KPI Dashboard in Excel
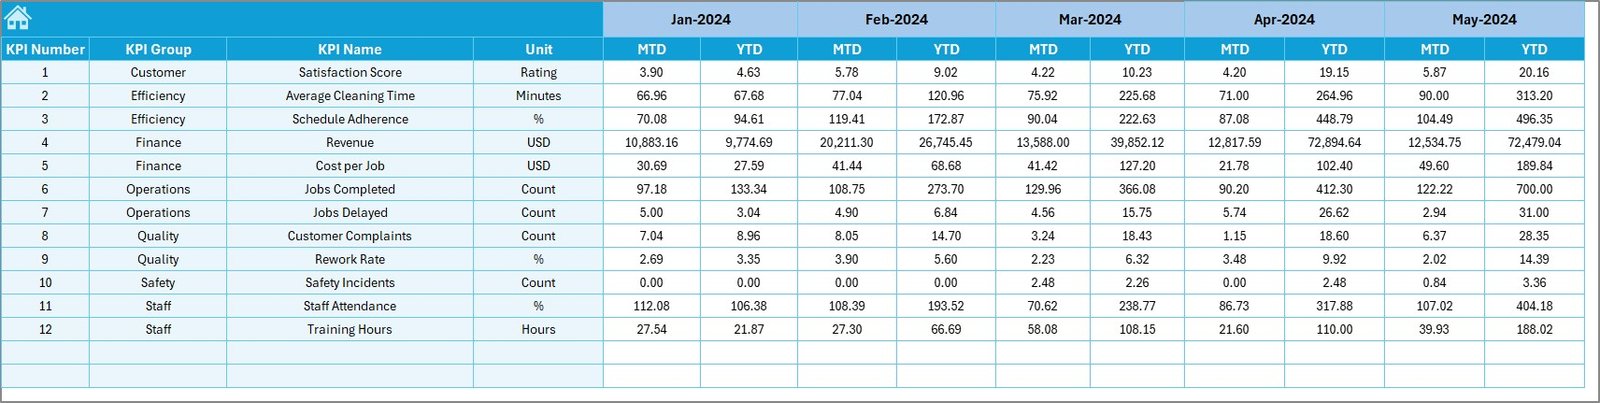
Target Sheet – How Do You Set Monthly Targets?
The Target Sheet allows you to enter:
- Monthly MTD Targets
- Monthly YTD Targets
- KPI-wise monthly target planning
You can assign goals for the entire year. These targets help your teams stay focused and aligned with business objectives.
Click to buy Cleaning Services KPI Dashboard in Excel
Previous Year Numbers Sheet – Why Should You Compare with Last Year?
This sheet stores the previous year’s MTD and YTD numbers. Comparing current year results with last year helps you:
- Measure improvement
- Identify seasonal patterns
- Benchmark performance
- Plan better yearly goals
This historical comparison is essential for long-term strategic planning.
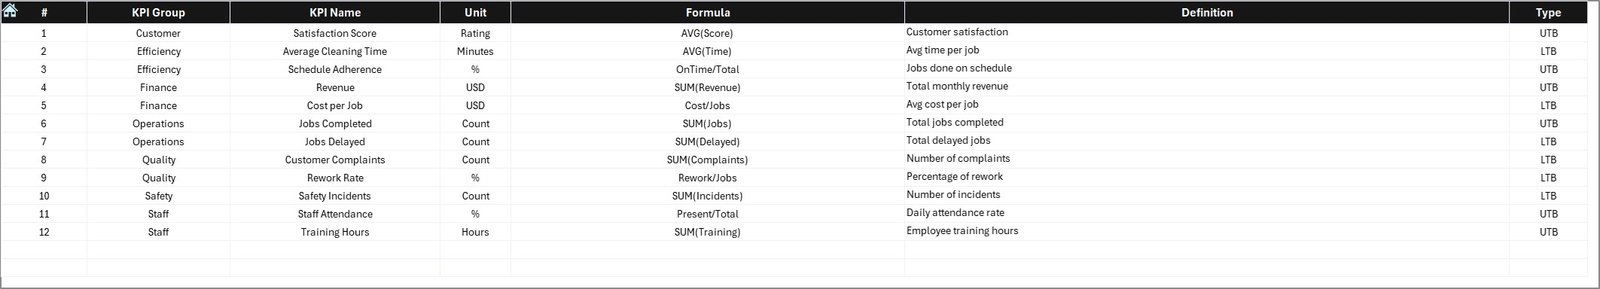
KPI Definition Sheet – What Details Should KPI Definition Include?
This sheet is the foundation of your dashboard. Here, you enter:
- KPI Name
- KPI Group
- KPI Unit
- Formula
- KPI Definition
- KPI Type
This sheet helps everyone understand how each KPI works. It standardizes reporting across teams.
Which KPIs Should Cleaning Companies Track?
A cleaning company must track KPIs across operations, service quality, team performance, finance, and customer satisfaction.
Here are essential KPIs:
Operational KPIs
- Jobs Completed
- Job Completion Time
- First-Time Fix Rate
- Rework Percentage
- Response Time
- Cleaning Coverage per Staff
Quality KPIs
- Inspection Score
- Defect Rate
- Compliance Rate
- Safety Incidents
Financial KPIs
- Revenue per Job
- Cost per Job
- Profit Margin
- Material Usage Cost
Customer KPIs
- Satisfaction Score
- Complaints Count
- Repeat Customer Rate
- SLA Compliance %
Workforce KPIs
- Productivity per Cleaner
- Attendance Rate
- Overtime Hours
- Training Hours
Tracking these KPIs ensures smooth operations and high client satisfaction.
Advantages of Cleaning Services KPI Dashboard in Excel
A KPI dashboard creates clarity in a business that runs on speed and accuracy. Here are the major benefits:
- Clear Visibility
You see all KPI performance in one place with simple visuals.
- Faster Decision-Making
Real-time insights allow you to correct issues before they grow.
- Improved Service Quality
When you track quality KPIs, inspection scores and compliance improve naturally.
- Better Client Satisfaction
Clients appreciate timely work and fewer complaints.
- Increased Team Productivity
You monitor team performance and plan workload balancing.
- Cost Control
You reduce material wastage and track job cost precisely.
- Accurate Forecasting
Trend charts help you plan future capacity and budgets.
- Easy Reporting
Excel allows exporting, printing, sharing, and customizing reports easily.
- Simple to Use
No coding or advanced tools needed. Anyone can update the dashboard.
How to Use the Dashboard Effectively?
Follow these steps to use the dashboard for daily cleaning operations:
- Enter actual numbers every month
- Update target sheet regularly
- Add previous year data before the new cycle starts
- Review dashboard charts weekly
- Identify KPIs that need attention
- Analyze trends for long-term insights
- Share reports with management
- Compare month-to-month performance
When used consistently, the dashboard becomes your best operational tool.
Best Practices for the Cleaning Services KPI Dashboard in Excel
You get the maximum value from this dashboard when you follow these best practices:
- Keep Data Updated
Enter actual numbers on time so that dashboard visuals remain accurate.
- Use Standard KPI Definitions
Maintain consistency in formulas and definitions across teams.
- Review Trends Frequently
Trend charts show hidden issues early. Use them every week.
- Compare Actual vs Target Regularly
This helps you adjust staffing, material planning, and workload.
- Analyze Seasonal Peaks
Cleaning demand changes by season. Trends help you plan better.
- Keep the Template Organized
Do not add random columns or changes in formulas.
- Train Your Team
Ensure everyone understands KPI meaning and dashboard navigation.
- Backup Files
Keep versions of the dashboard to avoid data loss.
Conclusion
A Cleaning Services KPI Dashboard in Excel gives you the control your business needs. You track performance, ensure quality, and make faster decisions. This dashboard combines operational, financial, workforce, and customer KPIs in one place. You understand what works, what needs improvement, and how to grow your business with confidence.
When cleaning companies use this dashboard regularly, they transform how they work. They deliver services on time, reduce costs, improve satisfaction, and achieve higher productivity. This Excel template becomes an essential tool for cleaning service success.
Frequently Asked Questions (FAQs)
- What is the main purpose of a Cleaning Services KPI Dashboard?
It helps managers track MTD, YTD, Target, and Previous Year performance of all key cleaning KPIs from one place.
- Who can use this dashboard?
Cleaning companies, facility management teams, housekeeping service providers, and janitorial service firms can use it.
- Do I need advanced Excel skills to use the dashboard?
No. The dashboard is simple and uses drop-downs, charts, formulas, and conditional formatting that work automatically.
- Can I customize the KPIs?
Yes. You can add, remove, or rename KPIs in the KPI Definition sheet.
- How often should I update the actual data?
Update it monthly. For better control, you can also update it weekly.
- Does trend analysis improve performance?
Yes. Trend charts reveal patterns that help you plan staffing, materials, and scheduling better.
- Why should I compare with the previous year?
This comparison helps you evaluate improvement, track growth, and understand seasonal fluctuations.
Visit our YouTube channel to learn step-by-step video tutorials
Watch the step-by-step video tutorial:
Click to buy Cleaning Services KPI Dashboard in Excel