Managing client billing efficiently remains one of the biggest challenges for finance teams, service providers, and growing businesses. Although invoices go out on time, payments often arrive late, partially, or not at all. As a result, cash flow suffers, follow-ups increase, and financial visibility drops.
That is exactly where a Client Billing Dashboard in Power BI becomes a game changer.
This detailed, SEO-friendly guide explains what a Client Billing Dashboard in Power BI is, how it works, why it matters, and how each dashboard page delivers actionable billing insights. Moreover, you will explore its advantages, best practices, and frequently asked questions. By the end of this article, you will clearly understand how this dashboard helps organizations take full control of their billing and payment performance.
What Is a Client Billing Dashboard in Power BI?
A Client Billing Dashboard in Power BI is an interactive reporting and analytics solution that tracks, monitors, and analyzes client invoices, payments, delays, and billing performance in one centralized view.
Instead of reviewing scattered Excel sheets, manual reports, or static summaries, this dashboard brings all billing data together. Consequently, finance teams gain real-time visibility into paid invoices, overdue amounts, partial payments, and payment delays.
Additionally, Power BI enables dynamic filtering, drill-downs, and visual storytelling. Therefore, decision-makers can quickly identify risks, trends, and opportunities without complex calculations.
Why Do Businesses Need a Client Billing Dashboard in Power BI?
Billing data directly impacts cash flow and financial stability. However, many organizations still rely on manual tracking, which leads to errors and delays.
A Client Billing Dashboard in Power BI solves these challenges by offering:
- Clear visibility into payment status
- Faster identification of overdue invoices
- Better accountability across account managers
- Stronger regional and service-level analysis
- Improved client payment behavior tracking
As a result, organizations move from reactive billing management to proactive financial control.
How Does a Client Billing Dashboard in Power BI Work?
The dashboard typically connects to an Excel file, ERP system, or billing database. Once data loads into Power BI, predefined visuals and calculations transform raw records into meaningful insights.
Here is how the process flows:
- You update invoice and payment data in the source file
- You refresh the Power BI dashboard
- Visuals update automatically across all pages
- Users apply filters to explore specific insights
Because of this structure, even non-technical users can analyze billing performance with confidence.
What Are the Key Pages in a Client Billing Dashboard in Power BI?
This Client Billing Dashboard includes five powerful pages, each designed to answer specific billing-related questions. Let us explore them one by one.
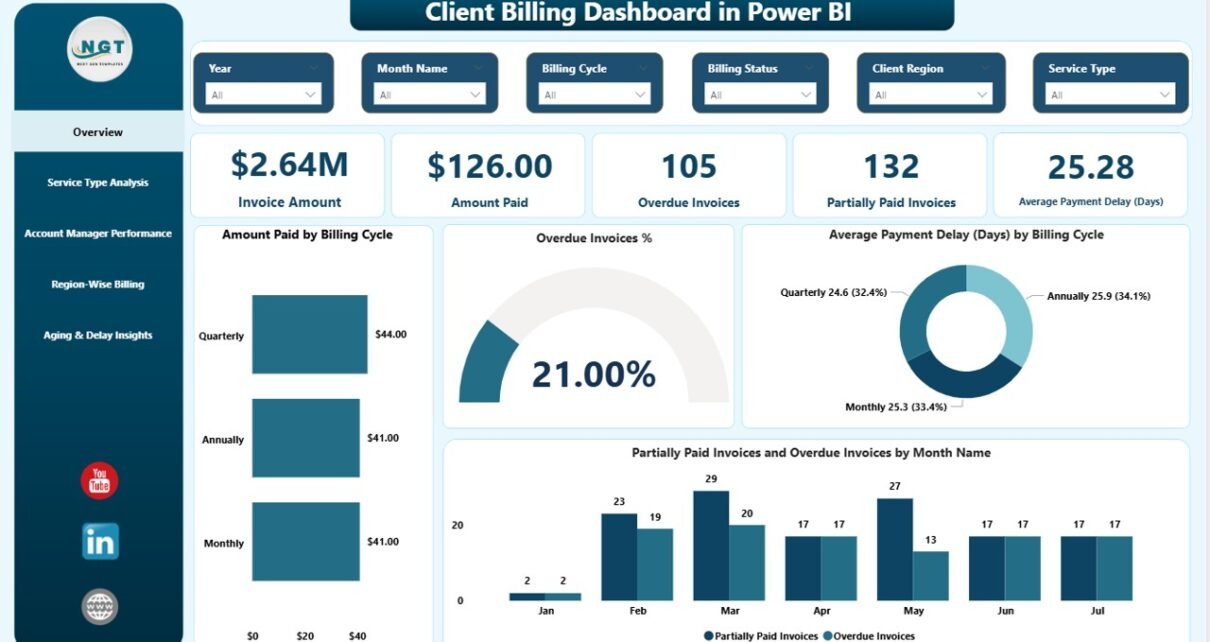
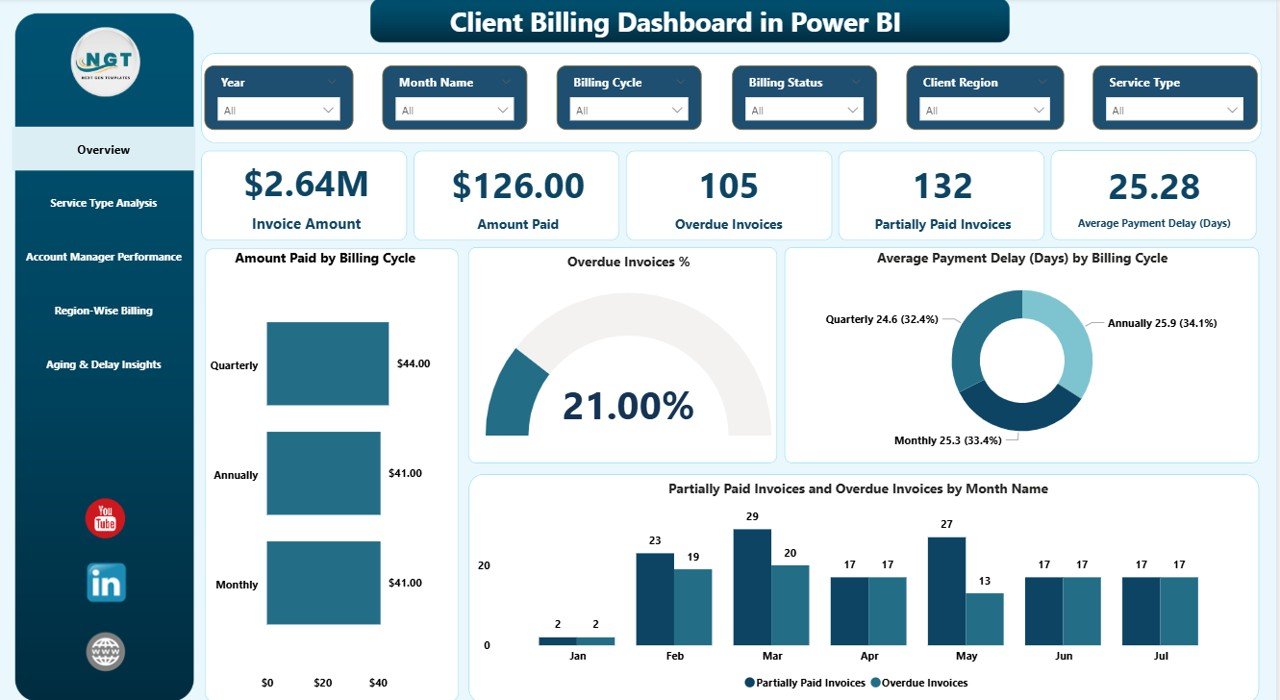
Overview Page: How Healthy Is Your Overall Billing Performance?
The Overview page provides a high-level snapshot of billing performance. It helps leadership quickly understand the current financial position.
Key Metrics Displayed on the Overview Page
- Total Paid Invoice Amount
Shows the total value of invoices that clients have fully paid. - Invoice Amount
Displays the total billed amount across all clients. - Amount Paid
Highlights how much money the business has already collected. - Partially Paid Amount
Identifies invoices where clients have made partial payments. - Average Payment Delay (Days)
Measures how late payments arrive on average.
Key Visual Insights
- Amount Paid by Billing Cycle
Helps analyze how payment behavior varies monthly, quarterly, or annually. - Overdue Invoice Percentage
Shows the proportion of invoices that remain unpaid past the due date. - Average Payment Delay by Billing Cycle
Reveals seasonal or periodic payment delays. - Partially Paid and Overdue Invoices by Month
Makes trends easy to spot across months.
As a result, this page sets the context for deeper analysis.
Service Type Analysis: Which Services Face the Most Billing Issues?
Different services often show different payment behaviors. Therefore, the Service Type Analysis page focuses on billing performance by service category.
Key Insights from Service Type Analysis
- Invoice Amount by Service Type
Identifies which services generate the highest billing value. - Total Number of Invoices by Service Type
Highlights billing volume across services. - Average Payment Delay (Days) by Service Type
Shows which services experience late payments more frequently. - Paid on Time by Service Type
Measures client discipline across service offerings.
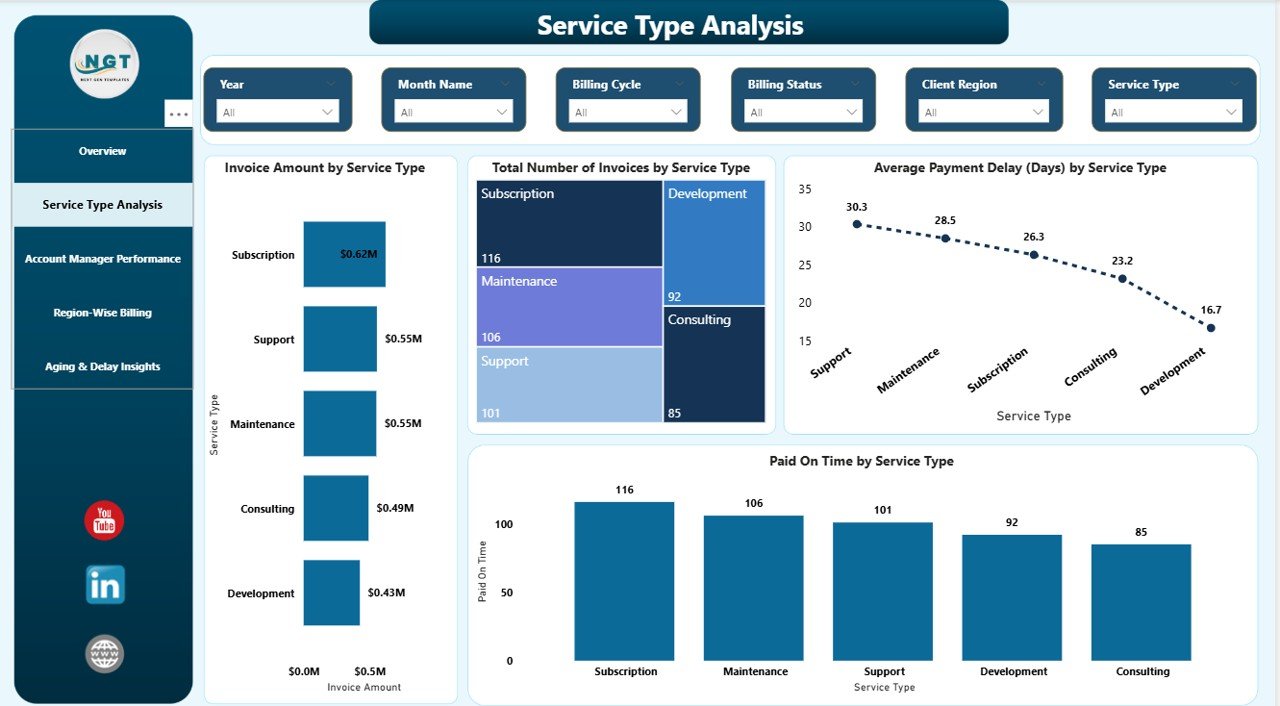
Because of this breakdown, businesses can revise pricing, payment terms, or follow-up strategies for specific services.
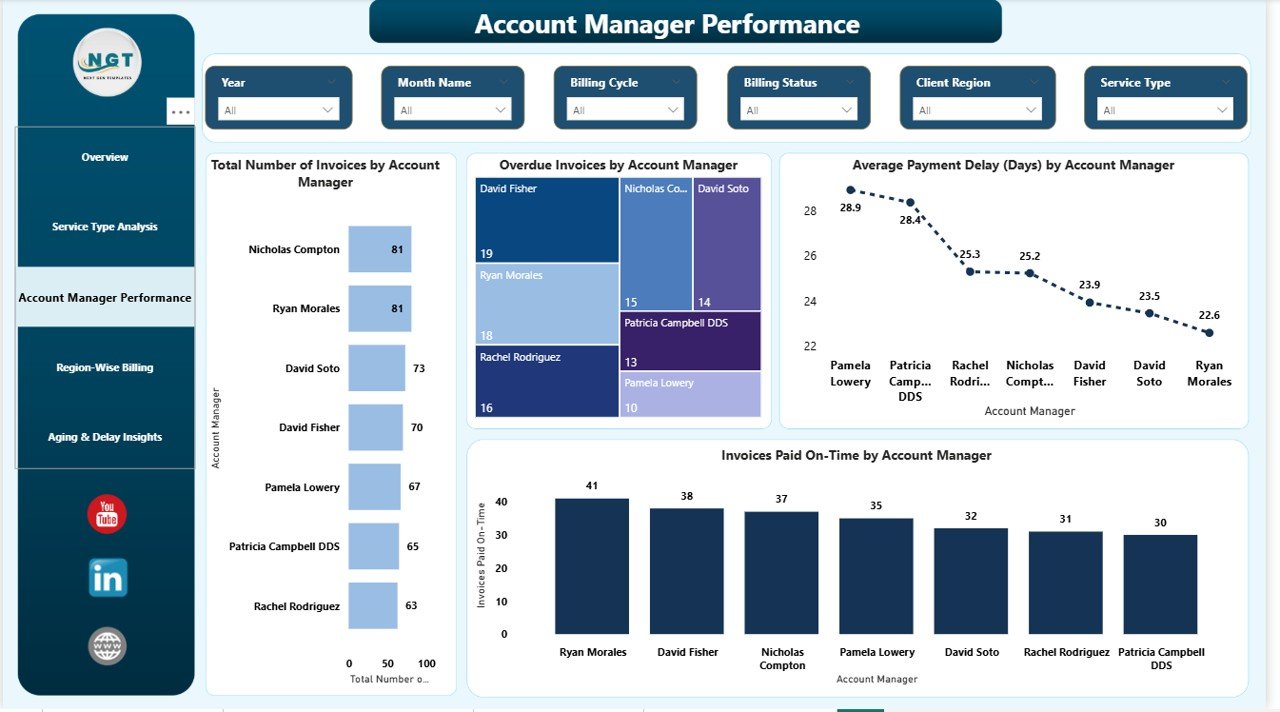
Account Manager Performance: Who Manages Billing Most Effectively?
Account managers play a critical role in ensuring timely payments. Therefore, this page focuses on accountability and performance.
Key Metrics on the Account Manager Performance Page
- Total Number of Invoices by Account Manager
Displays workload distribution among managers. - Overdue Invoices by Account Manager
Identifies managers handling high-risk clients. - Average Payment Delay (Days) by Account Manager
Highlights differences in follow-up effectiveness.
This page encourages ownership and supports performance-based reviews.
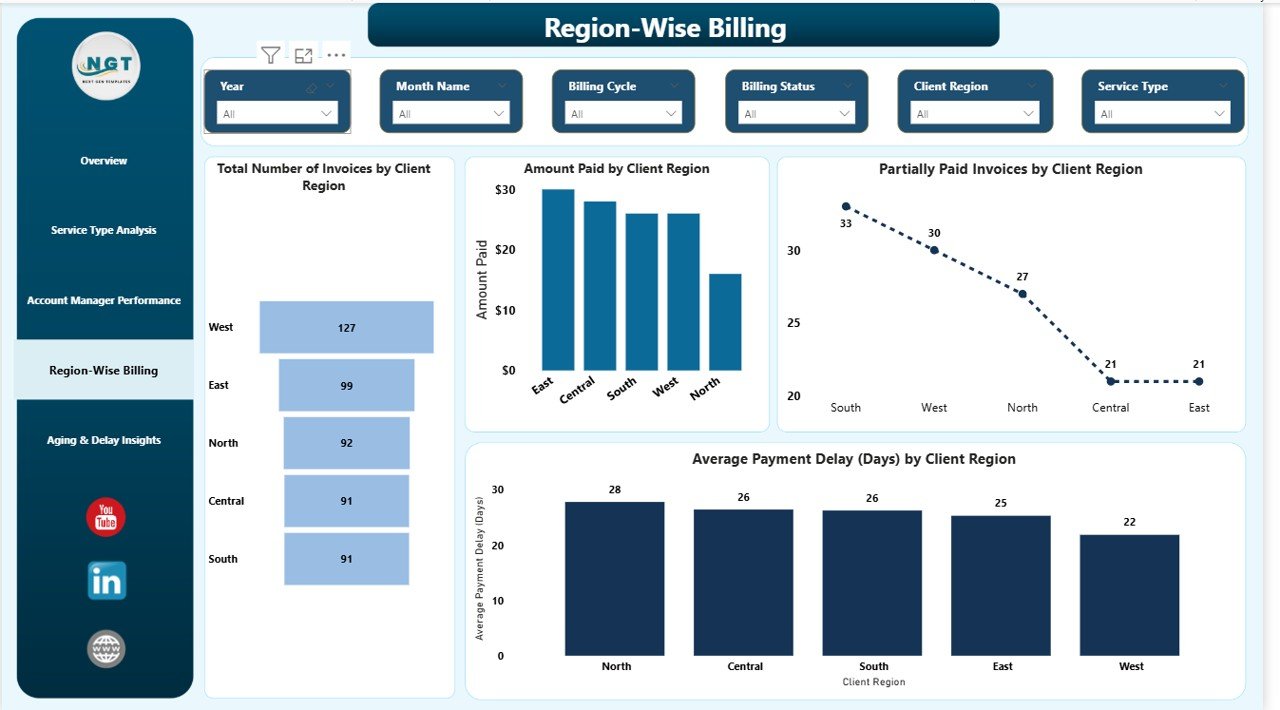
Region-Wise Billing: How Does Billing Performance Vary by Location?
Client payment behavior often varies by geography. Hence, the Region-Wise Billing page focuses on regional insights.
Key Regional Insights
- Total Number of Invoices by Client Region
Shows billing volume across regions. - Amount Paid by Client Region
Highlights strong and weak cash flow areas. - Partially Paid Invoices by Client Region
Identifies regions with payment challenges. - Average Payment Delay (Days) by Client Region
Reveals where delays commonly occur.
With these insights, organizations can tailor credit policies and payment terms regionally.
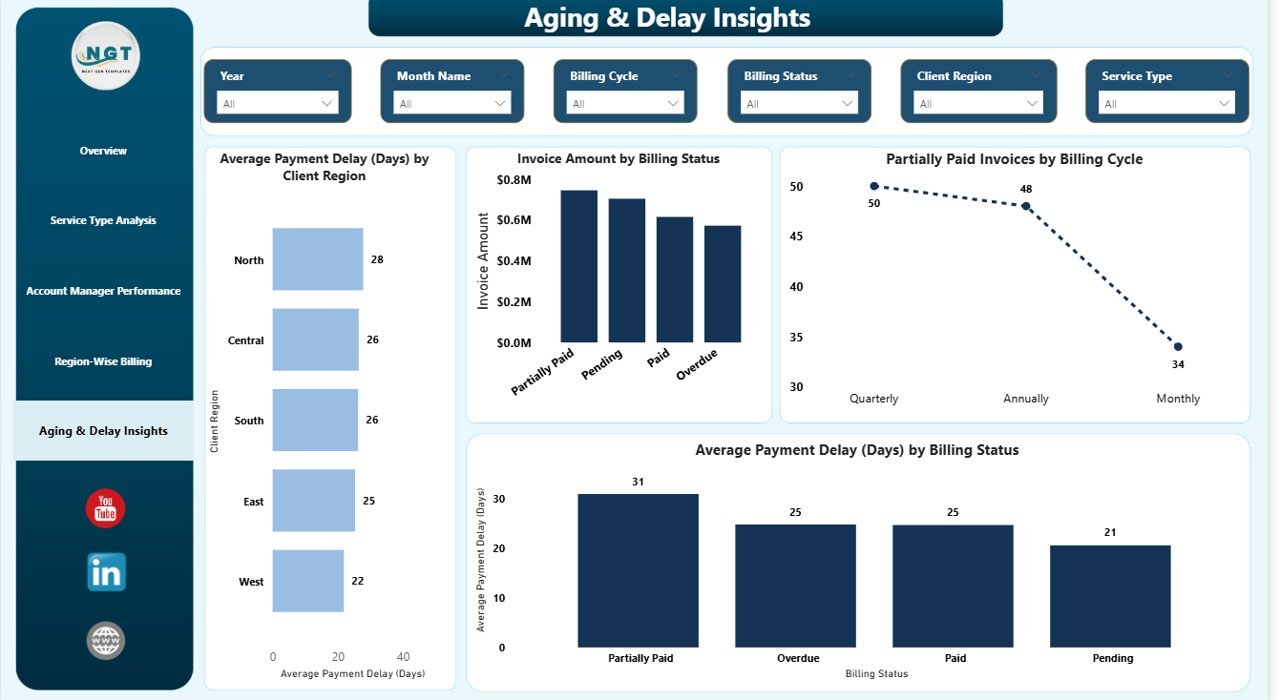
Aging & Delay Insights: Where Are the Biggest Payment Risks?
The Aging & Delay Insights page focuses on payment risk and invoice aging patterns.
Key Metrics on Aging & Delay Insights
- Average Payment Delay (Days) by Client Region
Helps compare delay behavior across locations. - Invoice Amount by Billing Status
Splits amounts into paid, overdue, and partially paid categories. - Partially Paid Invoices by Billing Cycle
Tracks partial payments over time. - Average Payment Delay (Days) by Billing Status
Highlights which statuses cause maximum delays.
As a result, finance teams can prioritize collections more effectively.
Advantages of a Client Billing Dashboard in Power BI
A Client Billing Dashboard in Power BI offers several practical benefits.
Improved Cash Flow Visibility
- Track paid, unpaid, and partial invoices instantly
- Reduce surprises in monthly cash flow
Faster Decision-Making
- Visual insights replace manual analysis
- Filters and drill-downs speed up reviews
Stronger Client Payment Control
- Identify chronic late payers quickly
- Improve follow-up strategies
Better Team Accountability
- Monitor account manager performance
- Encourage ownership and transparency
Scalable and Flexible Reporting
- Add new clients, services, or regions easily
- Update data without redesigning reports
Best Practices for the Client Billing Dashboard in Power BI
To maximize value, follow these best practices.
Maintain Clean and Structured Data
- Use consistent invoice statuses
- Avoid blank or duplicate records
Define Clear Payment Status Rules
- Standardize definitions for paid, overdue, and partial invoices
- Align due dates and grace periods
Use Meaningful Filters
- Add slicers for billing cycle, region, and service type
- Keep the dashboard easy to navigate
Review the Dashboard Regularly
- Analyze trends weekly or monthly
- Act quickly on overdue insights
Train Users Properly
- Teach finance and sales teams how to use filters
- Encourage data-driven discussions
Who Can Use a Client Billing Dashboard in Power BI?
This dashboard suits many roles, including:
- Finance managers
- Accounts receivable teams
- Business owners
- Operations leaders
- Account managers
Because of its simplicity, even non-technical users can benefit.
How Does Power BI Improve Client Billing Compared to Excel?
Although Excel works well for basic billing, Power BI delivers superior insights.
- Interactive visuals instead of static tables
- Faster analysis with slicers and drill-downs
- Better scalability for growing data
- Professional reporting for leadership
Therefore, Power BI turns billing data into a strategic asset.
Conclusion: Why a Client Billing Dashboard in Power BI Is Essential
A Client Billing Dashboard in Power BI transforms how organizations manage invoices, payments, and delays. Instead of reacting to late payments, teams gain proactive control over billing performance.
With structured pages like Overview, Service Type Analysis, Account Manager Performance, Region-Wise Billing, and Aging & Delay Insights, this dashboard delivers clarity, accountability, and action.
Ultimately, it helps businesses improve cash flow, reduce payment risks, and make smarter financial decisions.
Frequently Asked Questions (FAQs)
What is a Client Billing Dashboard in Power BI used for?
A Client Billing Dashboard in Power BI tracks invoices, payments, overdue amounts, and payment delays to improve billing control and cash flow visibility.
Can I connect this dashboard to Excel?
Yes, you can connect the dashboard directly to an Excel billing file and refresh it whenever data updates.
Does this dashboard support regional analysis?
Yes, it includes detailed region-wise billing and payment delay analysis.
Can account managers use this dashboard?
Yes, account managers can track their invoice performance and overdue risks easily.
Is Power BI suitable for small businesses?
Yes, Power BI works well for both small and large organizations due to its scalability and ease of use.
Visit our YouTube channel to learn step-by-step video tutorials
Watch the step-by-step video tutorial: