Managing clinic contracts without clear performance tracking often creates confusion, delays, and financial risks. However, modern clinics manage multiple vendor contracts, service-level agreements, compliance terms, and cost controls at the same time. Therefore, decision-makers need real-time visibility into contract performance instead of relying on scattered Excel sheets or manual reports.
That is exactly why a Clinic Contract KPI Dashboard in Power BI becomes an essential analytical solution. This dashboard transforms raw contract data into meaningful KPIs, visual indicators, and trends that support faster and better decisions.
In this detailed and SEO-friendly guide, you will learn what a Clinic Contract KPI Dashboard in Power BI is, why clinics need it, how it works, its page structure, KPI logic, Excel data design, advantages, best practices, and frequently asked questions. By the end, you will clearly understand how this dashboard improves contract governance, financial control, and operational efficiency in clinics.
Click to buy Clinic Contract KPI Dashboard in Power BI
What Is a Clinic Contract KPI Dashboard in Power BI?
A Clinic Contract KPI Dashboard in Power BI is a ready-to-use performance monitoring tool designed to track, analyze, and evaluate key performance indicators related to clinic contracts.
Instead of managing contract data in multiple files, this dashboard consolidates all KPIs into one interactive Power BI report. As a result, clinic administrators, finance teams, and contract managers gain instant visibility into contract performance.
Moreover, because the dashboard uses Excel as the data source, clinics can implement it quickly without complex system integrations. You only need to update the Excel file, and Power BI refreshes the visuals automatically.
Why Do Clinics Need a Contract KPI Dashboard?
Clinic contracts directly affect costs, service quality, compliance, and patient satisfaction. However, many clinics still track contract data manually. This approach creates gaps in monitoring and increases operational risk.
A Clinic Contract KPI Dashboard in Power BI solves these challenges because it:
- Centralizes all contract KPIs in one place
- Tracks targets versus actual performance
- Highlights risks using visual indicators
- Supports data-driven contract decisions
Therefore, clinics gain control, transparency, and accountability across all contract activities.
How Does a Clinic Contract KPI Dashboard in Power BI Work?
The dashboard follows a simple and effective workflow:
- Data Entry in Excel
Users update actuals, targets, and KPI definitions in structured Excel sheets. - Data Modeling in Power BI
Power BI connects to the Excel file and applies predefined measures and calculations. - Interactive Reporting
Users explore KPIs using slicers, tables, charts, and drill-through pages. - Performance Monitoring
Visual icons and percentages instantly show whether KPIs meet or miss targets.
Because of this structure, even non-technical users can operate the dashboard confidently.
What Are the Key Pages in the Clinic Contract KPI Dashboard?
The Clinic Contract KPI Dashboard in Power BI includes three powerful pages, each designed for a specific analytical purpose.
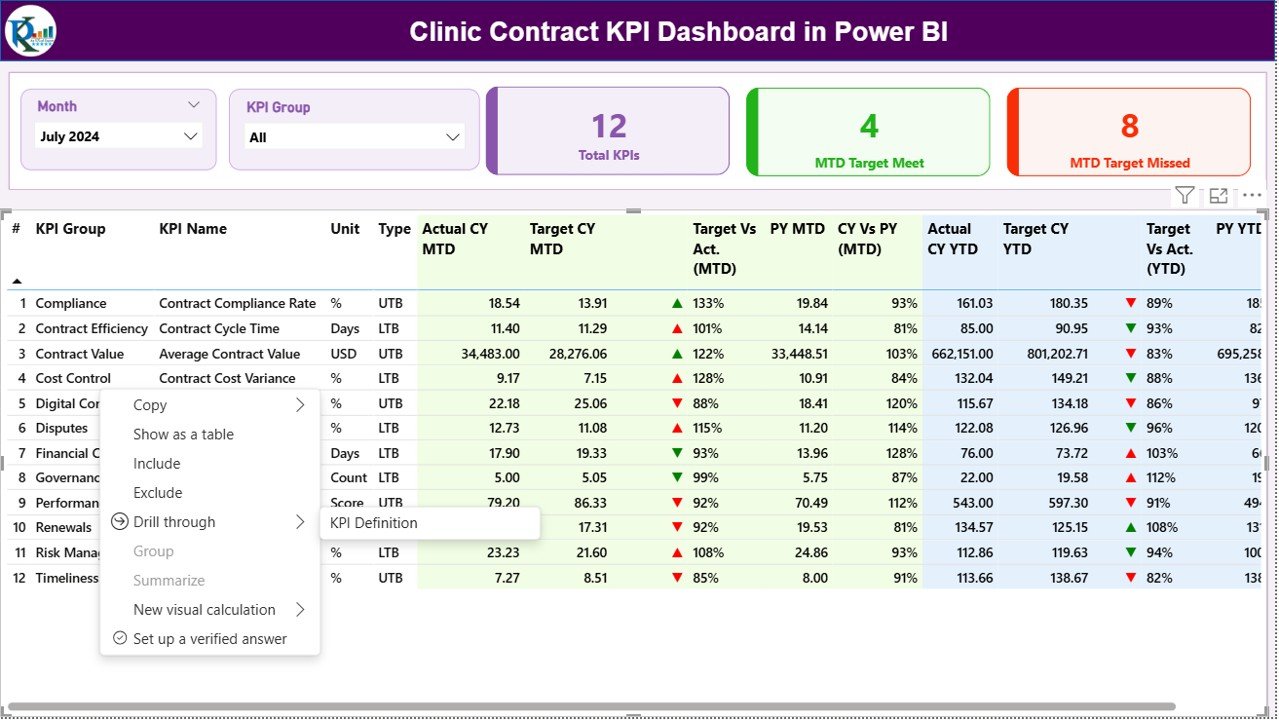
Summary Page: How Does It Provide a Quick Performance Snapshot?
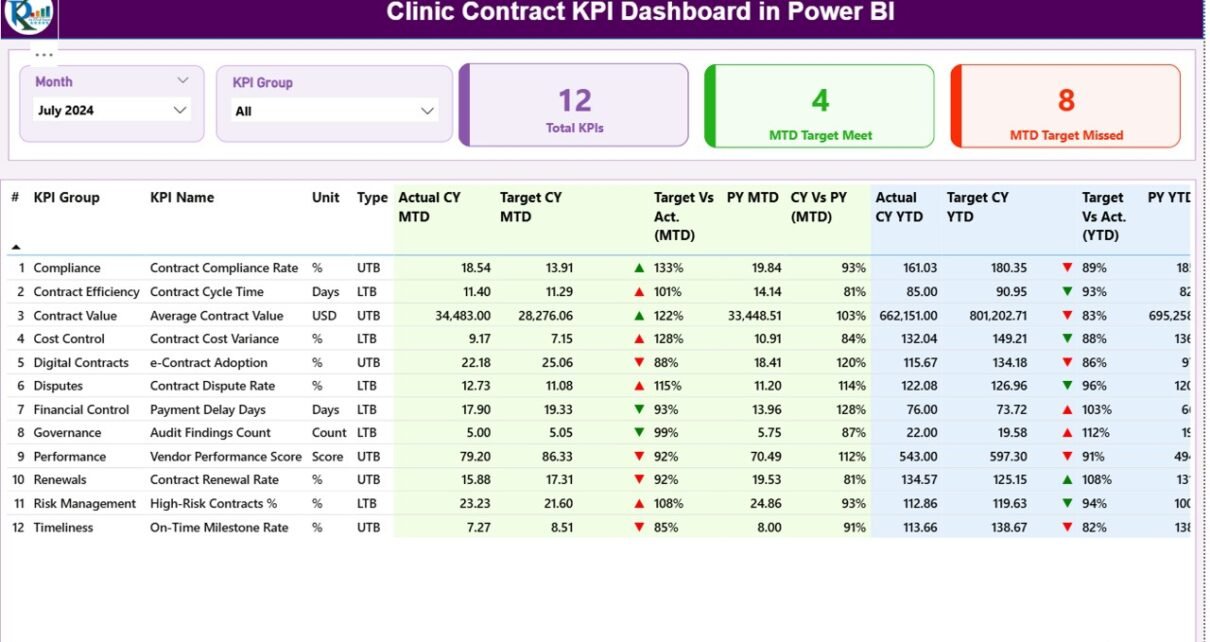
The Summary Page acts as the main landing page of the dashboard. It delivers a complete overview of contract KPIs at a glance.
Top-Level Filters and Cards
At the top of the page, you will find:
- Month Slicer – Filter KPIs by reporting month
- KPI Group Slicer – Focus on specific contract categories
In addition, three KPI cards display:
- Total KPIs Count
- MTD Target Meet Count
- MTD Target Missed Count
These cards instantly show overall contract performance.
Detailed KPI Table Explained
Below the cards, a detailed KPI table presents comprehensive contract metrics:
- KPI Number – Sequential identifier of the KPI
- KPI Group – Category or contract area
- KPI Name – Name of the KPI
- Unit – Measurement unit
- Type – LTB (Lower the Better) or UTB (Upper the Better)
MTD Performance Metrics
The table also includes Month-to-Date performance indicators:
- Actual CY MTD – Current year MTD actual value
- Target CY MTD – Current year MTD target value
- MTD Icon – ▲ green or ▼ red to show status
- Target vs Actual (MTD) – Actual ÷ Target percentage
- PY MTD – Previous year MTD value
- CY vs PY (MTD) – Current year MTD ÷ Previous year MTD
Because of these metrics, users quickly identify improving or declining KPIs.
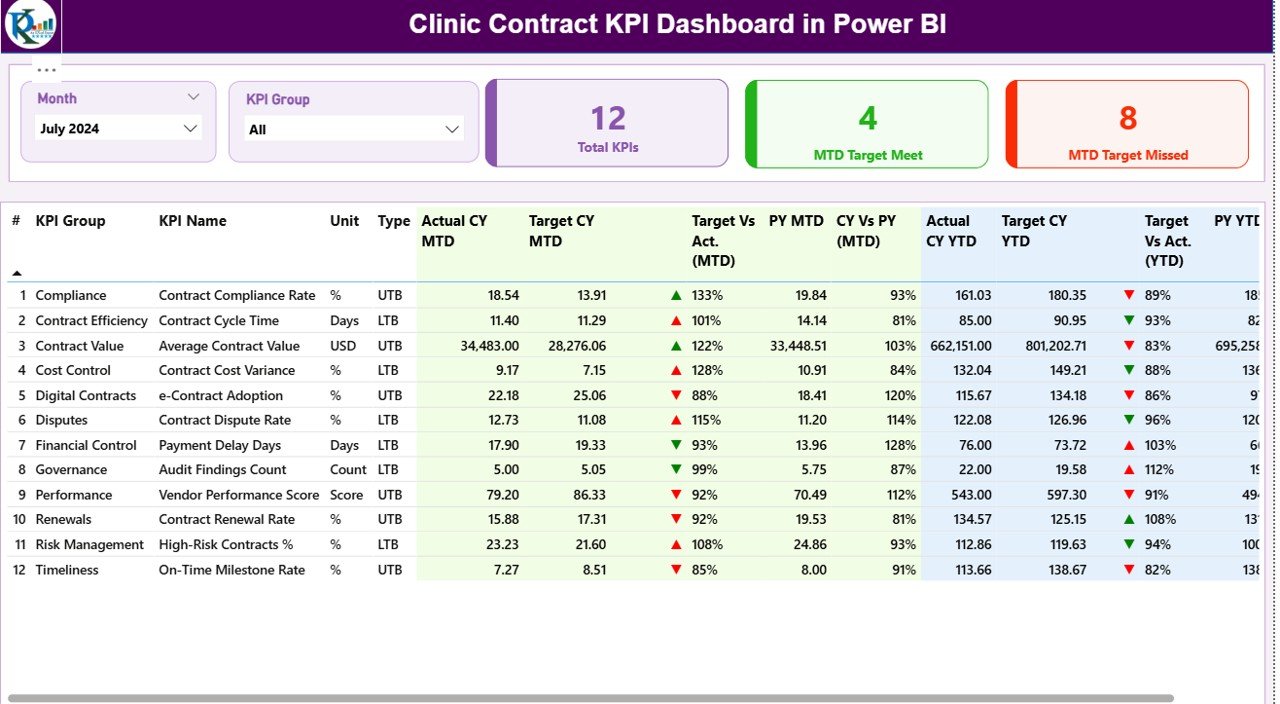
YTD Performance Metrics
Similarly, Year-to-Date performance appears clearly:
- Actual CY YTD – Current year YTD actual
- Target CY YTD – Current year YTD target
- YTD Icon – ▲ or ▼ status indicator
- Target vs Actual (YTD) – Actual ÷ Target percentage
- PY YTD – Previous year YTD value
- CY vs PY (YTD) – Current year YTD ÷ Previous year YTD
As a result, clinics can track long-term contract performance trends effectively.
Click to buy Clinic Contract KPI Dashboard in Power BI
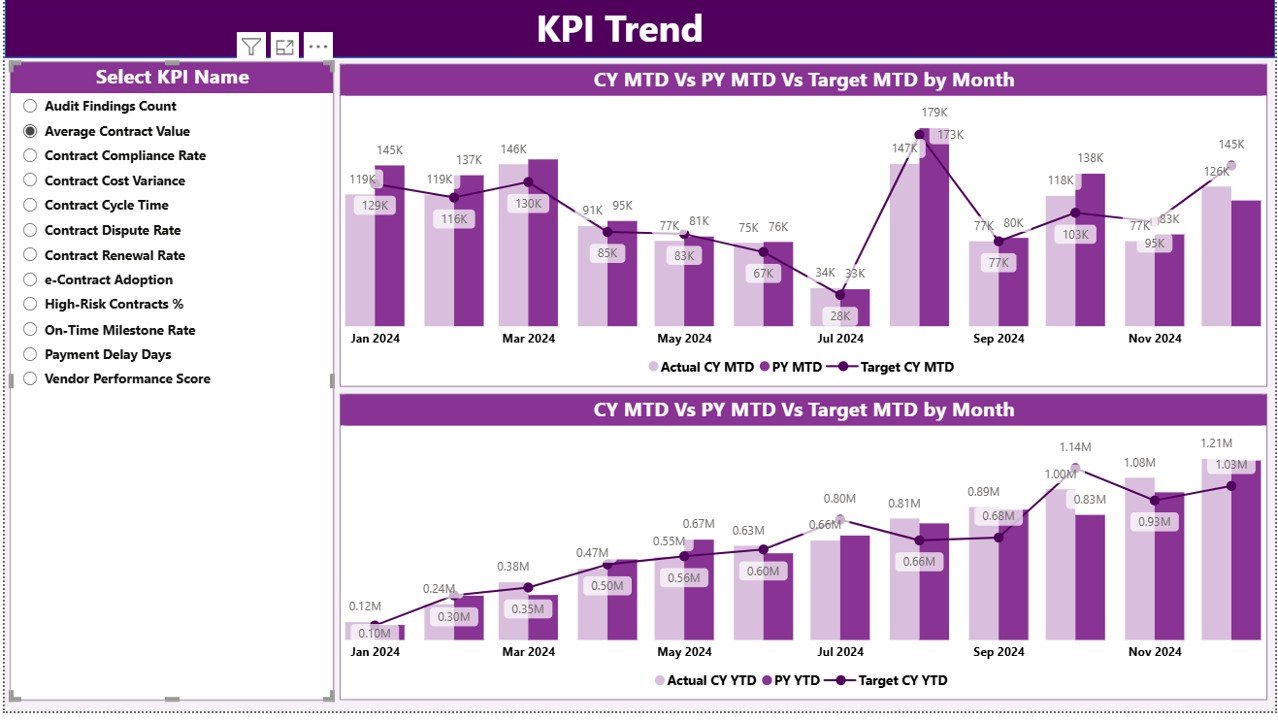
KPI Trend Page: How Do Trends Improve Contract Decisions?
The KPI Trend Page focuses on performance analysis over time.
Key Visuals on the Trend Page
This page includes:
Two Combo Charts
MTD: Actual CY, Actual PY, and Target
YTD: Actual CY, Actual PY, and Target
KPI Name Slicer
Users can select a specific KPI to analyze its trend.
Because these visuals show trends clearly, clinics can:
Detect performance fluctuations early
- Compare current performance with past results
- Validate whether corrective actions work
Click to buy Clinic Contract KPI Dashboard in Power BI
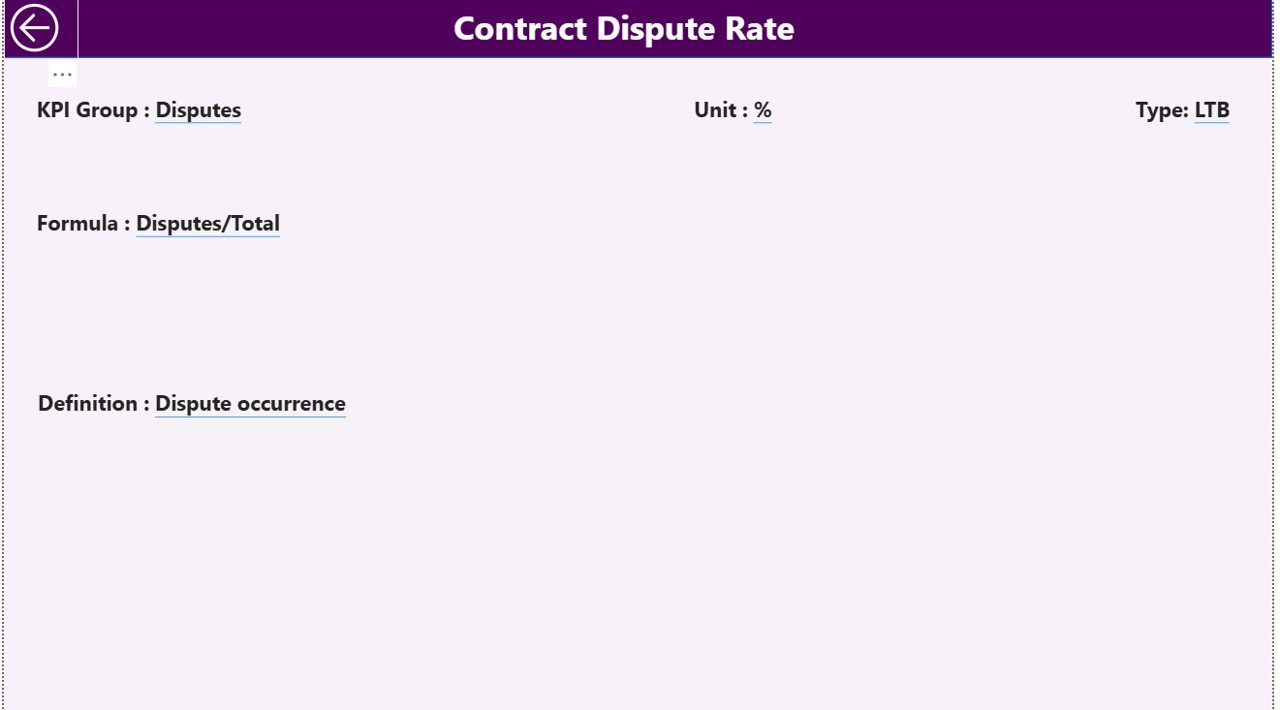
KPI Definition Page: Why Is It Important?
The KPI Definition Page is a hidden drill-through page that explains KPI logic.
What Does This Page Contain?
When users drill through from the Summary Page, they see:
- KPI Formula
- KPI Definition
- Measurement Unit
- KPI Type (LTB or UTB)
This page ensures that everyone interprets KPIs consistently. Therefore, misunderstandings and reporting errors reduce significantly
.Click to buy Clinic Contract KPI Dashboard in Power BI
How Does the Excel Data Source Support the Dashboard?
The Clinic Contract KPI Dashboard uses Excel as its data source, which makes it flexible and user-friendly.
Excel Sheets Required
You need to maintain three structured worksheets:
Input_Actual Sheet
In this sheet, you enter:
- KPI Name
- Month (use the first date of the month)
- MTD Actual Value
- YTD Actual Value
Input_Target Sheet
In this sheet, you enter:
- KPI Name
- Month (first date of the month)
- MTD Target Value
- YTD Target Value
Click to buy Clinic Contract KPI Dashboard in Power BI
KPI Definition Sheet
This sheet defines KPI metadata:
- KPI Number
- KPI Group
- KPI Name
- Unit
- Formula
- Definition
- Type (LTB or UTB)
Because of this structure, data entry stays clean and consistent.
What KPIs Can Clinics Track Using This Dashboard?
Clinics can track a wide range of contract-related KPIs, such as:
- Contract compliance rate
- Vendor SLA adherence
- Cost variance percentage
- Contract renewal timeliness
- Service delivery accuracy
- Penalty and claim trends
Therefore, the dashboard adapts easily to different clinic contract models.
Advantages of Clinic Contract KPI Dashboard in Power BI
Using this dashboard delivers multiple operational and strategic benefits.
Centralized Contract Monitoring
All contract KPIs appear in one dashboard. As a result, teams stop juggling multiple reports.
Faster Decision-Making
Real-time visuals and indicators highlight issues instantly. Therefore, managers act faster.
Improved Contract Compliance
Clear metrics ensure vendors meet contractual obligations consistently.
Better Financial Control
Target versus actual comparisons reveal cost overruns early.
Year-over-Year Performance Analysis
MTD and YTD comparisons show whether performance improves or declines over time.
User-Friendly Design
Because the dashboard uses Excel and Power BI, teams adopt it quickly.
Best Practices for the Clinic Contract KPI Dashboard in Power BI
Following best practices ensures maximum value from the dashboard.
Define KPIs Clearly
Always document KPI definitions, formulas, and targets clearly in the KPI Definition sheet.
Maintain Data Consistency
Use consistent KPI names, units, and date formats across Excel sheets.
Update Data Regularly
Update actual and target values monthly to keep insights accurate.
Use LTB and UTB Correctly
Set KPI types carefully so icons reflect the correct performance logic.
Review Trends Periodically
Analyze KPI trends monthly and quarterly to identify long-term patterns.
Train Users
Explain dashboard navigation, slicers, and drill-through features to all users.
Who Can Benefit from This Dashboard?
This dashboard supports multiple clinic stakeholders:
- Clinic administrators
- Contract managers
- Finance and accounts teams
- Procurement teams
- Senior leadership
Because it serves diverse roles, it improves collaboration and transparency.
How Does This Dashboard Improve Governance and Accountability?
Governance improves when performance stays visible and measurable. This dashboard:
- Tracks KPIs objectively
- Highlights missed targets clearly
- Creates accountability for contract owners
- Supports audit readiness
As a result, clinics strengthen internal controls and external compliance.
Conclusion: Is a Clinic Contract KPI Dashboard in Power BI Worth It?
Yes, absolutely. A Clinic Contract KPI Dashboard in Power BI transforms contract monitoring from a reactive task into a proactive strategy. It centralizes data, improves visibility, and supports smarter decisions.
Because the dashboard uses Excel as its data source and Power BI for analytics, clinics gain a powerful yet easy-to-use solution. Over time, this dashboard reduces risks, controls costs, and improves contract outcomes.
Frequently Asked Questions (FAQs)
What is the main purpose of a Clinic Contract KPI Dashboard in Power BI?
The dashboard helps clinics monitor contract performance, track targets versus actuals, and identify risks in real time.
Do I need advanced Power BI skills to use this dashboard?
No. Basic Power BI navigation knowledge is enough because the dashboard is ready to use.
Can I customize KPIs in the dashboard?
Yes. You can add, modify, or remove KPIs by updating the Excel sheets.
How often should I update the Excel data?
You should update the data monthly or as per your reporting cycle.
Does the dashboard support year-over-year comparisons?
Yes. The dashboard includes CY vs PY comparisons for both MTD and YTD.
Can this dashboard work for different clinic sizes?
Yes. The dashboard scales easily for small clinics and large healthcare networks.
If you want, I can also:
Visit our YouTube channel to learn step-by-step video tutorials
Watch the step-by-step video tutorial: