Managing clinic contracts efficiently remains a constant challenge for healthcare organizations. Clinics handle multiple contracts related to medical equipment, laboratory services, facility maintenance, IT systems, outsourced staff, and vendor partnerships. However, when contract data stays scattered across Excel sheets, emails, and paper files, tracking performance becomes slow and risky. As a result, missed renewals, cost overruns, and compliance issues increase.
That is exactly where a Clinic Contract Management Dashboard in Power BI becomes a powerful and practical solution.
In this detailed guide, you will learn what a Clinic Contract Management Dashboard in Power BI is, why clinics need it, how it works, its complete dashboard structure, key features, advantages, best practices, use cases, and frequently asked questions. Moreover, the article uses clear language, strong transition words, and a business-focused approach so clinic administrators, procurement teams, and decision-makers can apply it confidently.
Click to Purchases Clinic Contract Management Dashboard in Power BI
What Is a Clinic Contract Management Dashboard in Power BI?
A Clinic Contract Management Dashboard in Power BI is an interactive reporting and analytics solution designed to monitor, analyze, and control clinic contracts in one centralized view.
Instead of reviewing hundreds of contract rows in spreadsheets, this dashboard converts raw contract data into:
-
Interactive KPI cards
-
Dynamic charts and visuals
-
Department-wise and vendor-wise insights
-
Monthly and annual contract trends
As a result, clinic leaders gain instant visibility into contract status, value, renewals, and performance.
Why Do Clinics Need a Contract Management Dashboard?
Clinics operate in a highly regulated and cost-sensitive environment. Therefore, contract oversight plays a critical role in financial control and compliance.
Without a centralized dashboard, clinics often face:
-
Missed contract renewals
-
Untracked vendor obligations
-
Inaccurate contract value reporting
-
Delayed decision-making
-
Poor departmental accountability
However, a Clinic Contract Management Dashboard in Power BI solves these problems by bringing clarity, speed, and accuracy to contract reporting.
How Does a Clinic Contract Management Dashboard in Power BI Work?
The dashboard connects clinic contract data—usually stored in Excel, SharePoint, or a database—to Power BI. Then, Power BI transforms this raw data into visual insights using:
-
Data models
-
Measures and KPIs
-
Filters and slicers
-
Interactive charts
Because Power BI updates automatically, the dashboard always reflects the latest contract data. As a result, decision-makers stay informed at all times.
What Is the Dashboard Structure of a Clinic Contract Management Dashboard in Power BI?
This dashboard contains five powerful analytical pages, each designed to answer specific business questions. Let us explore each page in detail.
1. Overview Page – How Can Clinics Track Contracts at a Glance?
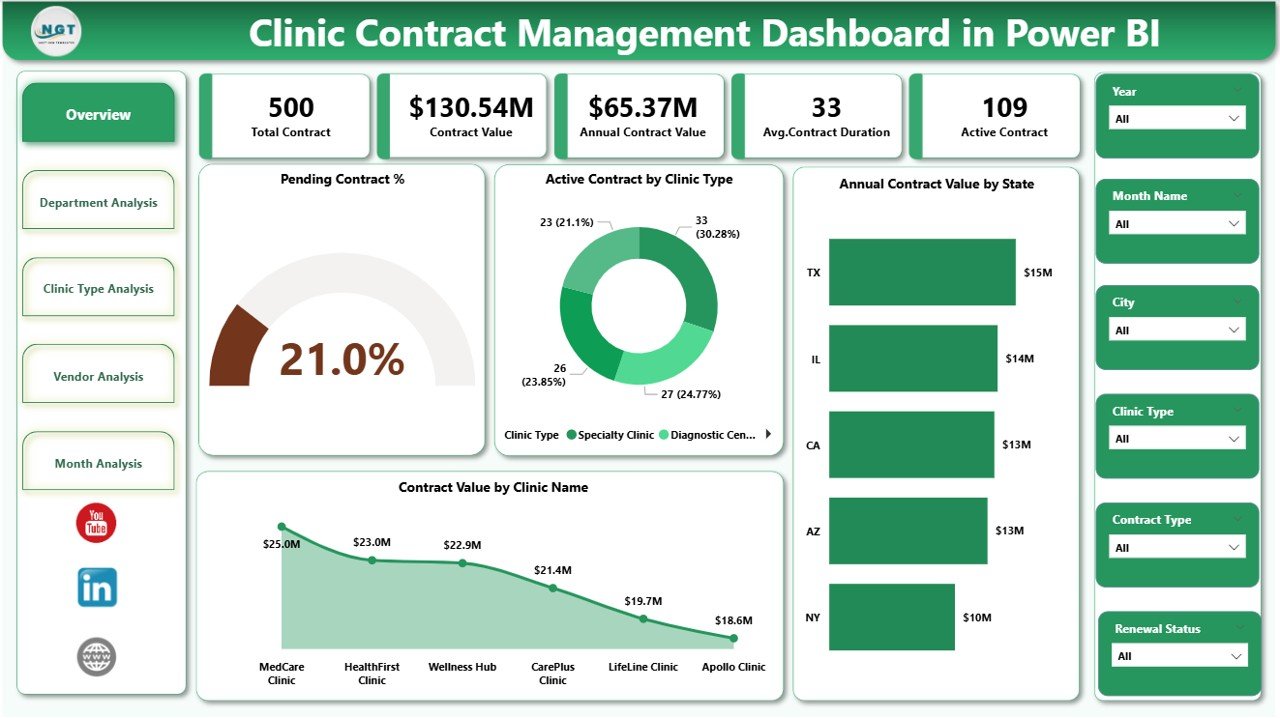
The Overview Page acts as the central control panel of the dashboard. It provides a high-level snapshot of clinic contract performance.
Key Elements of the Overview Page
Interactive Slicers
-
Filter data by time period, clinic, state, or category
-
Instantly update all visuals
KPI Cards
-
Pending Contract %
-
Other critical summary metrics
Charts Included
-
Pending Contract % – Highlights contracts nearing expiry or awaiting action
-
Active Contract by Clinic Type – Shows how many contracts run across clinic categories
-
Annual Contract Value by State – Reveals geographic distribution of contract spending
-
Contract Value by Clinic Name – Identifies high-value clinics
Why Is the Overview Page Important?
Because it summarizes key metrics instantly, management can quickly identify risks and priorities without digging into raw data.
Click to Purchases Clinic Contract Management Dashboard in Power BI
2. Department Analysis – Which Departments Drive Contract Value?
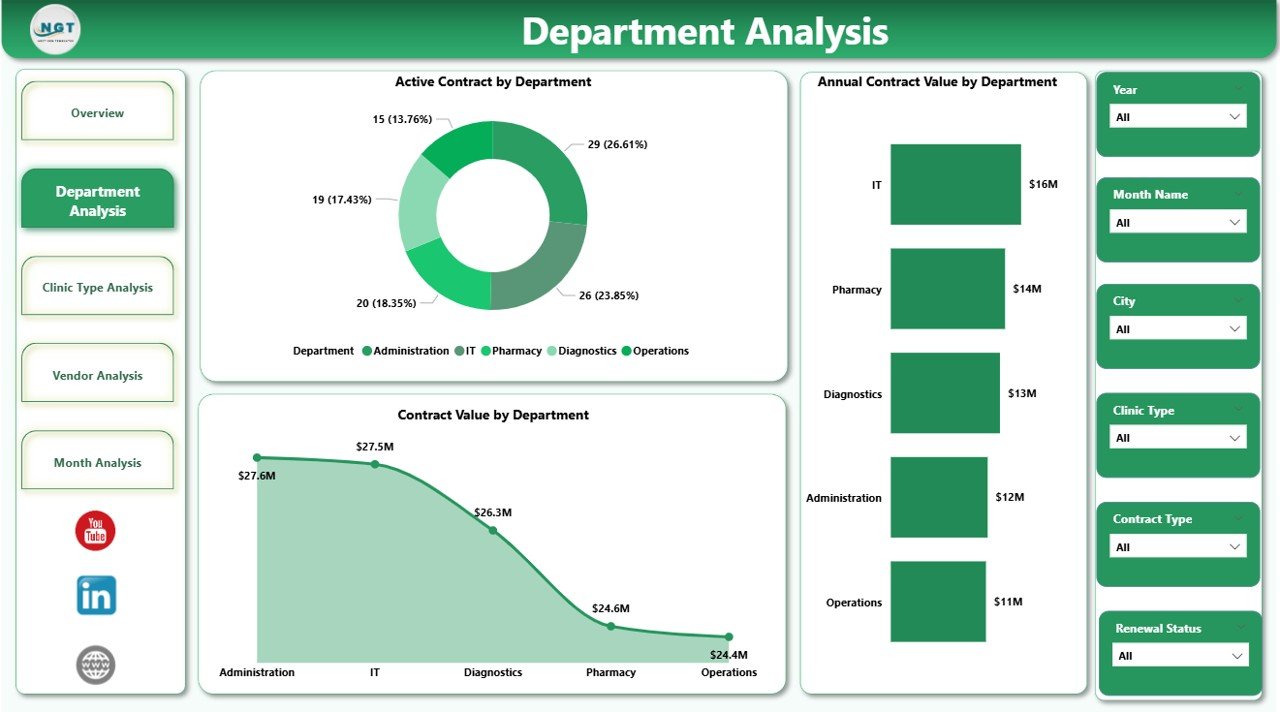
The Department Analysis Page focuses on departmental contract performance. Since different departments manage different contracts, this view ensures accountability.
Charts on the Department Analysis Page
-
Active Contract by Department – Shows which departments manage the most active contracts
-
Annual Contract Value by Department – Highlights departments with higher financial exposure
-
Contract Value by Department – Supports cost allocation and budgeting
Business Value of Department Analysis
-
Helps allocate budgets accurately
-
Identifies departments with contract overload
-
Supports performance-based evaluations
3. Clinic Type Analysis – How Do Contracts Vary by Clinic Type?
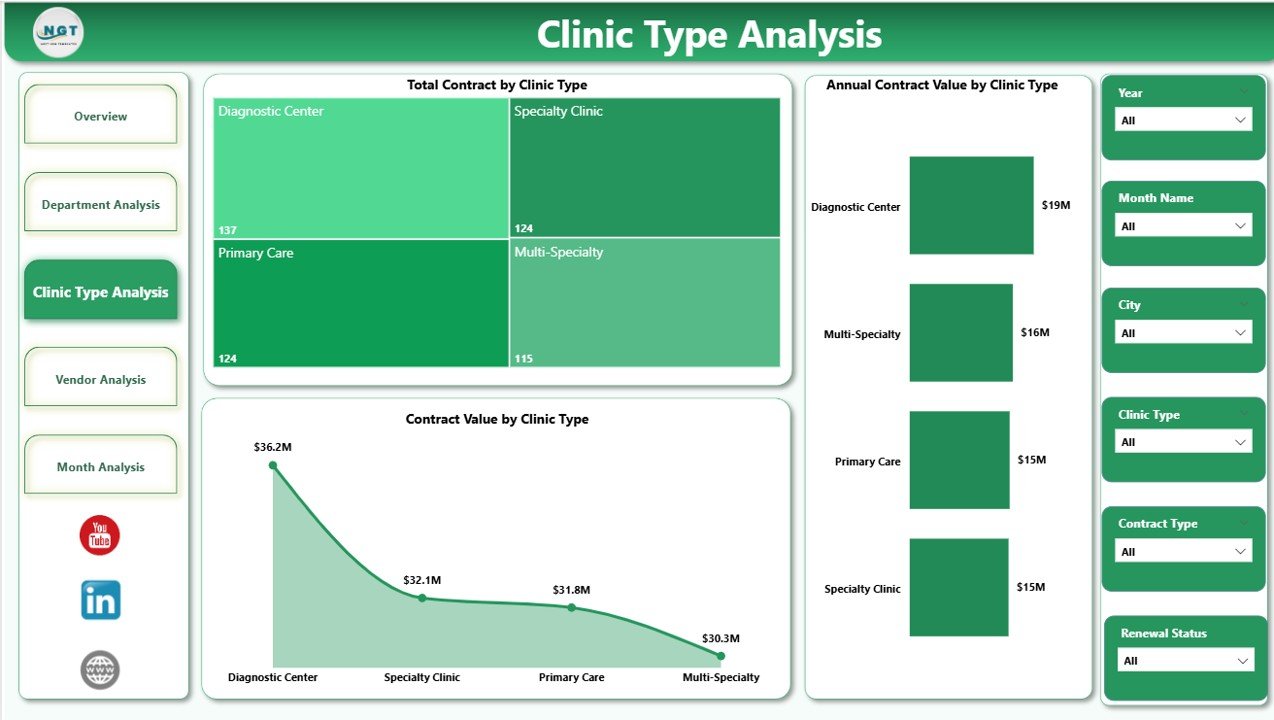
Clinics often operate across multiple types such as general clinics, specialty clinics, diagnostic centers, or outpatient facilities. Therefore, contract behavior varies significantly.
Charts on the Clinic Type Analysis Page
-
Total Contract by Clinic Type
-
Annual Contract Value by Clinic Type
-
Contract Value by Clinic Type
Why Clinic Type Analysis Matters
This page helps leadership understand:
-
Which clinic types consume higher contract value
-
Where cost optimization opportunities exist
-
How contract strategies differ by clinic category
4. Vendor Analysis – Which Vendors Control the Highest Contract Value?
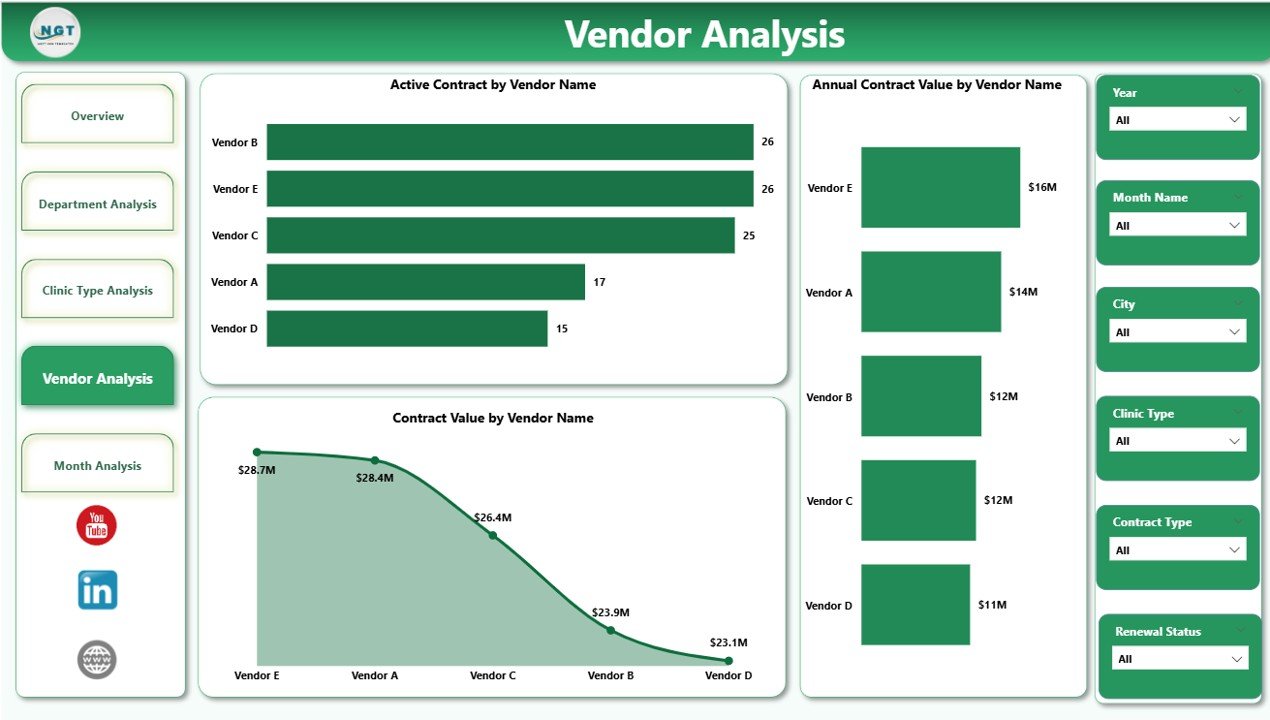
Vendor management remains a critical component of clinic operations. The Vendor Analysis Page focuses on supplier-level insights.
Charts on the Vendor Analysis Page
-
Active Contract by Vendor Name
-
Annual Contract Value by Vendor Name
-
Contract Value by Vendor Name
How Vendor Analysis Helps Clinics
-
Identifies vendor concentration risks
-
Supports renegotiation strategies
-
Improves vendor performance monitoring
-
Click to Purchases Clinic Contract Management Dashboard in Power BI
5. Monthly Trends – How Are Contracts Changing Over Time?
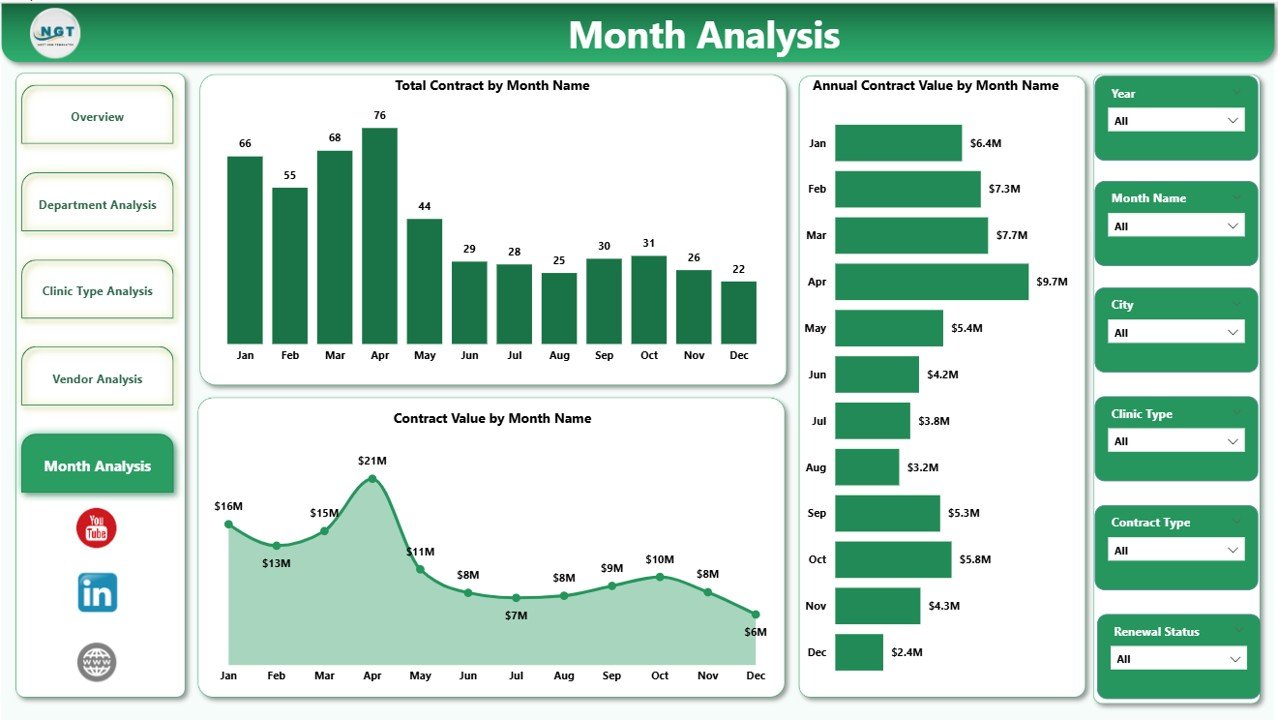
The Monthly Trends Page reveals contract behavior over time, helping clinics forecast future obligations.
Charts on the Monthly Trends Page
-
Total Contract by Month
-
Annual Contract Value by Month
-
Contract Value by Month
Why Monthly Trends Are Critical
-
Supports renewal planning
-
Detects seasonal contract patterns
-
Improves cash flow forecasting
What KPIs Can You Track in a Clinic Contract Management Dashboard?
A strong dashboard focuses on meaningful KPIs. Some essential KPIs include:
-
Total Contracts
-
Active Contracts
-
Pending Contracts %
-
Annual Contract Value
-
Contract Value by Department
-
Contract Value by Vendor
-
Monthly Contract Growth
Because Power BI allows flexibility, clinics can easily add or customize KPIs as needed.
What Are the Advantages of a Clinic Contract Management Dashboard in Power BI?
1. Centralized Contract Visibility
Instead of managing scattered files, clinics access all contract information in one dashboard.
2. Faster Decision-Making
Because insights update instantly, leaders respond quickly to risks and opportunities.
3. Improved Financial Control
The dashboard highlights high-value contracts, helping clinics manage costs proactively.
4. Reduced Compliance Risk
By tracking pending and expiring contracts, clinics avoid missed renewals and penalties.
5. Better Vendor Management
Vendor-level insights support negotiations and performance tracking.
How Does This Dashboard Support Clinic Decision-Making?
The dashboard supports decisions such as:
-
Which contracts need renewal first
-
Which departments overspend on contracts
-
Which vendors require renegotiation
-
How contract value trends impact budgets
As a result, clinic management moves from reactive to proactive decision-making.
Who Should Use a Clinic Contract Management Dashboard in Power BI?
This dashboard benefits:
-
Clinic administrators
-
Procurement teams
-
Finance and accounts teams
-
Compliance officers
-
Senior management
Because the visuals remain intuitive, both technical and non-technical users can use it confidently.
Best Practices for the Clinic Contract Management Dashboard in Power BI
To get maximum value, clinics should follow these best practices.
1. Maintain Clean and Consistent Data
Always standardize contract dates, values, and categories before loading data.
2. Update Data Regularly
Frequent data refresh ensures accurate and reliable insights.
3. Use Clear Naming Conventions
Consistent naming improves readability and reduces confusion.
4. Focus on Actionable KPIs
Avoid clutter. Instead, track KPIs that drive decisions.
5. Secure Sensitive Contract Data
Use role-based access in Power BI to protect confidential information.
Common Use Cases of a Clinic Contract Management Dashboard
-
Contract renewal planning
-
Vendor performance review meetings
-
Budget forecasting sessions
-
Compliance audits
-
Management reporting
Because the dashboard adapts easily, clinics can use it across multiple scenarios.
How Is Power BI Better Than Traditional Excel for Contract Management?
While Excel works well for data entry, Power BI offers:
-
Interactive visuals
-
Automatic refresh
-
Advanced filtering
-
Drill-down analysis
Therefore, Power BI provides deeper insights with less manual effort.
What Data Is Required to Build This Dashboard?
Typical data fields include:
-
Contract ID
-
Clinic Name
-
Clinic Type
-
Department
-
Vendor Name
-
Contract Start Date
-
Contract End Date
-
Contract Value
-
Contract Status
-
State
Once prepared, this data feeds directly into Power BI.
Conclusion: Why Should Clinics Adopt a Contract Management Dashboard in Power BI?
A Clinic Contract Management Dashboard in Power BI transforms contract data into actionable insights. Instead of reacting to issues after they occur, clinics gain visibility, control, and confidence.
Because the dashboard centralizes contracts, highlights risks, and tracks trends, it becomes an essential tool for modern clinic management. Ultimately, clinics that adopt this dashboard improve financial control, reduce compliance risk, and strengthen vendor relationships.
Frequently Asked Questions (FAQs)
What is a Clinic Contract Management Dashboard in Power BI used for?
It helps clinics track, analyze, and manage contracts through interactive visuals and KPIs.
Can small clinics use this dashboard?
Yes. Both small and large clinics can use it because Power BI scales easily.
Does this dashboard replace Excel completely?
No. Excel often serves as a data source, while Power BI handles analysis and visualization.
How often should contract data be updated?
Ideally, clinics should update data weekly or monthly for accurate insights.
Is Power BI secure for contract data?
Yes. Power BI supports role-based access and data security features.
Can this dashboard track contract renewals?
Yes. Pending and expiring contracts appear clearly through KPIs and trends.
Visit our YouTube channel to learn step-by-step video tutorials