Managing clinic projects is no longer simple. Clinics today handle multiple projects at the same time, such as facility expansion, equipment installation, IT system upgrades, renovation work, compliance initiatives, and patient service improvements. Because budgets remain tight and timelines stay strict, clinic management teams need clear visibility, real-time tracking, and confident decision-making. Therefore, relying on scattered spreadsheets and manual reporting no longer works.
That is exactly why a Clinic Project KPI Dashboard in Excel becomes a powerful and practical solution. This ready-to-use dashboard transforms raw project data into clear, visual, and actionable insights using Microsoft Excel. Moreover, it helps clinics track performance, control timelines, monitor costs, and improve accountability—without investing in expensive project management software.
In this detailed and SEO-friendly article, you will learn everything about the Clinic Project KPI Dashboard in Excel. Additionally, you will understand how it works, its worksheet structure, advantages, best practices, and common questions. By the end, you will clearly see why this dashboard is an essential tool for modern clinics.
Click to buy Clinic Project KPI Dashboard in Excel
What Is a Clinic Project KPI Dashboard in Excel?
A Clinic Project KPI Dashboard in Excel is a structured and interactive Excel-based reporting tool designed to track, analyze, and monitor key performance indicators (KPIs) related to clinic projects.
Instead of reviewing multiple project files, emails, and manual reports, this dashboard consolidates all project KPIs into one centralized view. As a result, clinic managers, administrators, and project teams gain instant clarity on project health.
Why Do Clinics Need a Project KPI Dashboard?
Clinics usually manage projects such as:
- New clinic or department setup
- Medical equipment installation
- IT and EMR system upgrades
- Infrastructure renovation
- Compliance and accreditation projects
- Process improvement initiatives
Because these projects involve budgets, timelines, resources, and risks, clinics must track performance regularly. Therefore, a Clinic Project KPI Dashboard in Excel ensures transparency, consistency, and control at every stage.
How Does a Clinic Project KPI Dashboard in Excel Work?
The dashboard works by connecting structured KPI definitions with actual, target, and previous-year data. Once you enter the numbers, Excel automatically calculates variances, trends, and comparisons. Consequently, users can analyze performance without complex formulas or manual effort.
Moreover, the dashboard updates dynamically when you change the selected month. As a result, decision-makers always see the most relevant data.
What Are the Key Features of a Clinic Project KPI Dashboard in Excel?
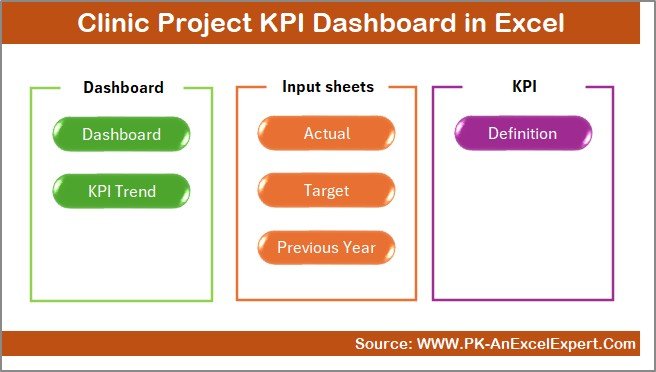
The Clinic Project KPI Dashboard in Excel includes 7 well-structured worksheets, each designed for a specific purpose. Let us explore each sheet in detail.
Summary Page
The Summary Page acts as an index or navigation hub for the entire dashboard.
Key Highlights of the Summary Page
- Provides 6 navigation buttons
- Allows quick access to all major sheets
- Improves usability and user experience
- Saves time by eliminating manual sheet searches
Because clinics often share dashboards with multiple stakeholders, this summary page ensures that everyone navigates the file easily and confidently.
Click to buy Clinic Project KPI Dashboard in Excel
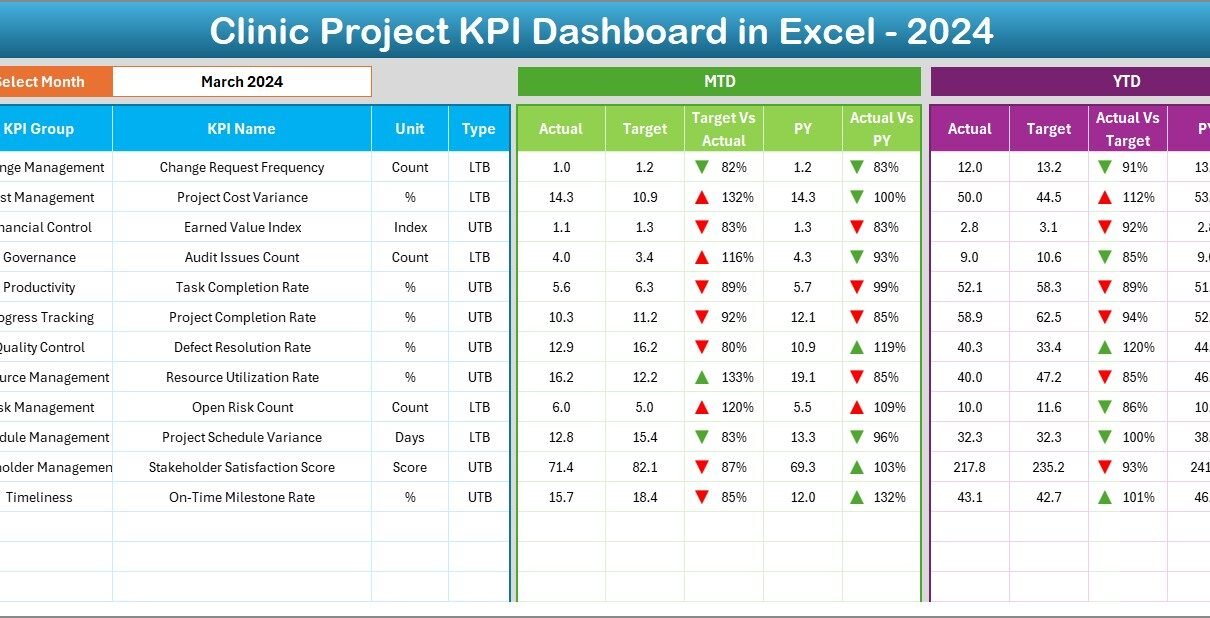
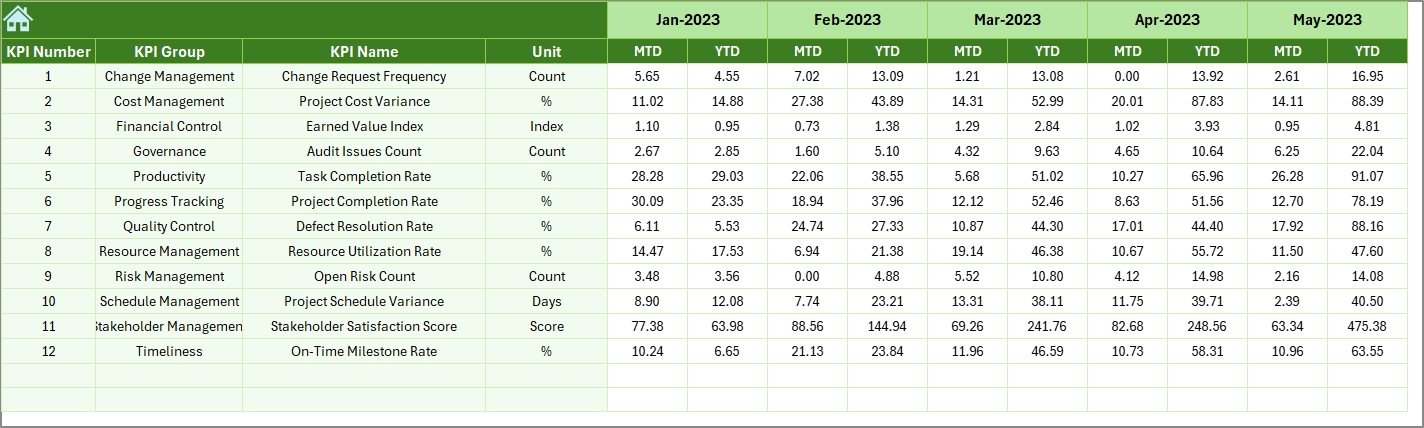
Dashboard Sheet
The Dashboard Sheet is the main and most critical sheet in the Clinic Project KPI Dashboard in Excel.

Click to buy Clinic Project KPI Dashboard in Excel
Key Functionalities of the Dashboard Sheet
- Displays all project KPIs in one view
- Allows month selection from cell D3
- Updates all metrics automatically based on the selected month
KPIs Displayed on the Dashboard
The dashboard shows both MTD (Month-to-Date) and YTD (Year-to-Date) metrics, including:
- MTD Actual
- MTD Target
- MTD Previous Year
- Target vs Actual (with up/down arrows)
- Previous Year vs Actual (with up/down arrows)
Similarly, it also shows:
- YTD Actual
- YTD Target
- YTD Previous Year
- YTD Target vs Actual
- YTD Previous Year vs Actual
Because of conditional formatting, users can instantly identify positive or negative performance trends.
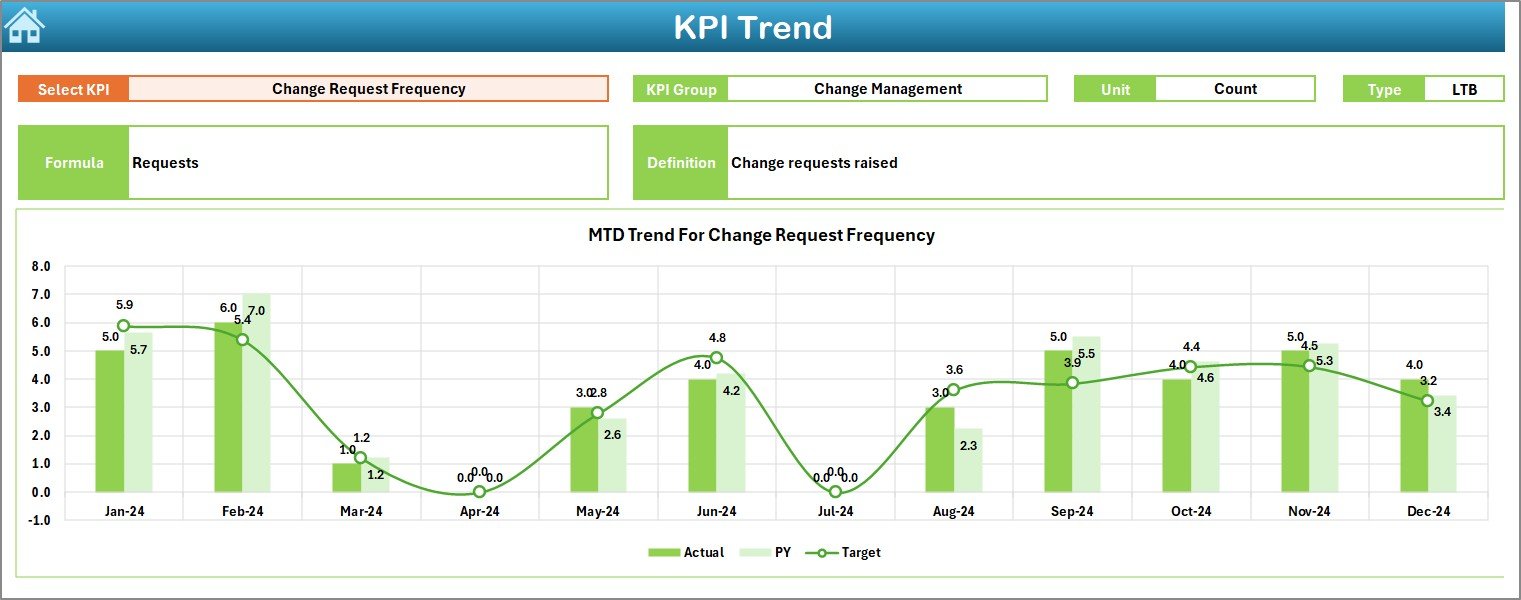
Trend Sheet
The Trend Sheet focuses on deep KPI analysis and performance trends.
Features of the Trend Sheet
- KPI selection from dropdown at cell C3
- Displays KPI Group
- Shows Unit of KPI
- Identifies KPI Type (UTB or LTB)
- Shows KPI Formula and Definition
Trend Charts Included
- MTD Actual vs Target vs Previous Year
- YTD Actual vs Target vs Previous Year
Because trends reveal performance patterns over time, this sheet helps clinics identify recurring delays, budget overruns, or performance improvements.
Click to buy Clinic Project KPI Dashboard in Excel
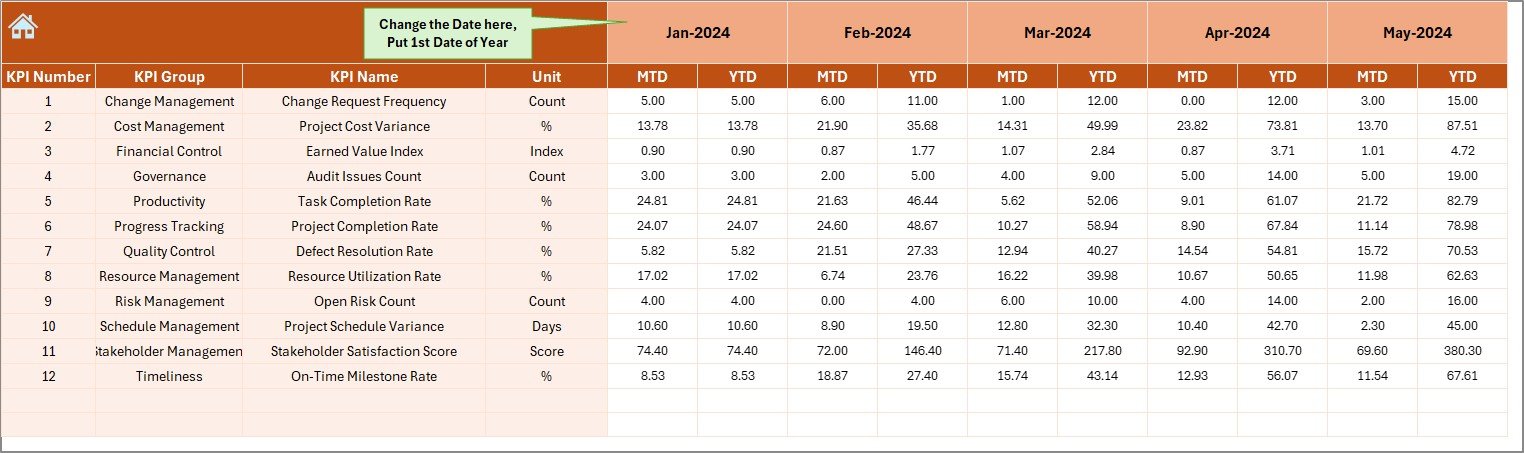
Actual Numbers Input Sheet
The Actual Numbers Input Sheet is where users enter real project performance data.
How This Sheet Works
- Enter MTD and YTD actual values
- Select the starting month from cell E1
- Maintain consistent monthly data structure
Because the dashboard pulls data directly from this sheet, accuracy here ensures reliable insights everywhere else.
Click to buy Clinic Project KPI Dashboard in Excel
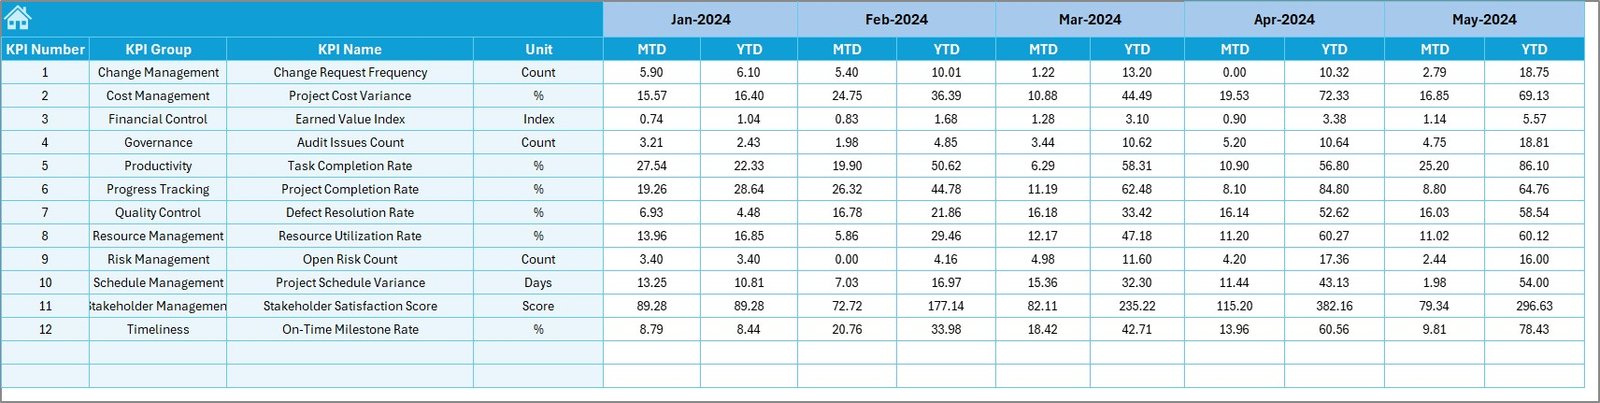
Target Sheet
The Target Sheet defines expected project performance.
Key Inputs in the Target Sheet
- Monthly MTD targets for each KPI
- YTD cumulative targets
- KPI-wise target values
By comparing actuals against targets, clinics can quickly identify gaps and take corrective action.
Click to buy Clinic Project KPI Dashboard in Excel
Previous Year Number Sheet
The Previous Year Number Sheet stores historical performance data.
Benefits of Previous Year Comparison
- Measures year-over-year improvement
- Highlights long-term performance trends
- Supports realistic future target setting
Because improvement matters more than absolute numbers, this sheet adds valuable context to project analysis.
Click to buy Clinic Project KPI Dashboard in Excel
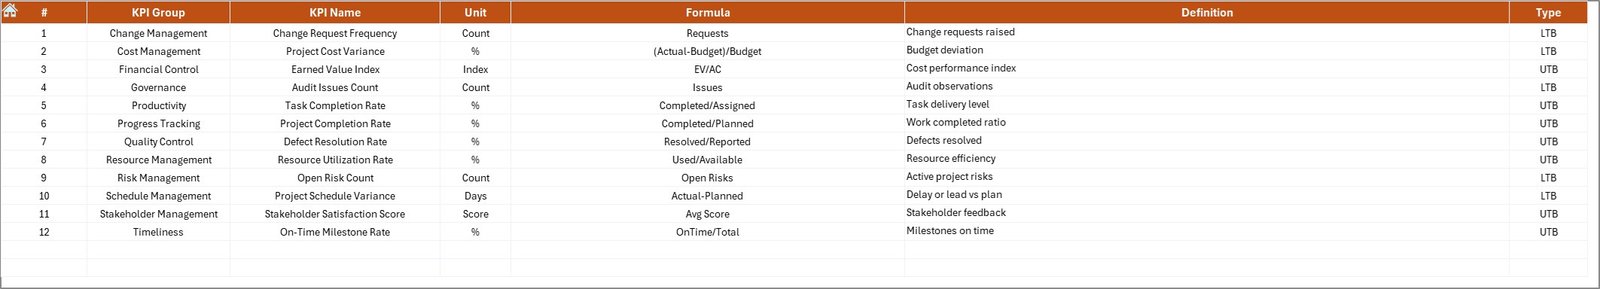
KPI Definition Sheet
The KPI Definition Sheet acts as the foundation of the entire dashboard.
Information Captured in This Sheet
- KPI Name
- KPI Group
- Unit of Measurement
- KPI Formula
- KPI Definition
Because standardized definitions reduce confusion, this sheet ensures consistency across teams and reporting periods.
Click to buy Clinic Project KPI Dashboard in Excel
What KPIs Can Be Tracked in a Clinic Project KPI Dashboard?
Clinics can track a wide range of project-related KPIs, such as:
- Project Completion Rate (%)
- Schedule Variance (Days)
- Budget Variance (%)
- Cost Overrun Amount
- Resource Utilization Rate
- Milestone Achievement Rate
- Delay Days per Project
- Change Request Count
- Risk Closure Rate
- Issue Resolution Time
Because the dashboard remains flexible, clinics can customize KPIs based on project type.
Advantages of a Clinic Project KPI Dashboard in Excel
Using a Clinic Project KPI Dashboard in Excel offers several powerful advantages.
- Centralized Project Visibility
Instead of managing multiple files, clinics track all project KPIs in one dashboard. As a result, visibility improves instantly.
- Better Decision-Making
Because data updates dynamically, managers make faster and more confident decisions.
- Improved Accountability
Clear KPIs assign ownership and responsibility. Therefore, teams stay focused and accountable.
- Cost Control and Budget Monitoring
By comparing actual vs target costs, clinics identify overruns early and take corrective action.
- Time Savings
Automation reduces manual calculations and reporting efforts. Consequently, teams focus more on execution.
- Easy Customization
Because Excel is flexible, clinics can add or modify KPIs without technical expertise.
- No Expensive Software Required
Clinics avoid costly project management tools and still gain powerful insights.
Best Practices for the Clinic Project KPI Dashboard in Excel
To maximize value, clinics should follow these best practices.
- Define Clear KPIs
Always choose KPIs that align with project goals. Avoid tracking too many irrelevant metrics.
- Maintain Accurate Data Entry
Ensure teams update actual numbers regularly. Accuracy drives trust in the dashboard.
- Review the Dashboard Monthly
Schedule monthly review meetings using the dashboard. Consistent reviews improve performance.
- Use Trends, Not Just Snapshots
Always analyze trends instead of single-month values. Trends reveal deeper insights.
- Standardize KPI Definitions
Use the KPI Definition Sheet effectively. Standard definitions avoid confusion.
- Protect the Dashboard Structure
Lock formulas and visuals to prevent accidental changes.
- Train Users Properly
Ensure all users understand how to read and update the dashboard.
Who Can Benefit from a Clinic Project KPI Dashboard in Excel?
This dashboard benefits multiple stakeholders, including:
- Clinic administrators
- Project managers
- Operations managers
- Finance teams
- Compliance teams
- Senior leadership
Because everyone views the same data, alignment improves across departments.
How Does This Dashboard Improve Project Governance?
Strong governance depends on transparency, accountability, and control. The Clinic Project KPI Dashboard in Excel supports governance by:
- Providing regular performance updates
- Highlighting risks and delays early
- Supporting data-driven reviews
- Creating audit-ready documentation
As a result, clinics manage projects more professionally.
Conclusion: Why Every Clinic Needs a Project KPI Dashboard in Excel
A Clinic Project KPI Dashboard in Excel is no longer optional. Instead, it is a necessity for clinics that want control, clarity, and confidence in project execution. By centralizing KPIs, automating analysis, and presenting clear visuals, this dashboard transforms how clinics manage projects.
Moreover, because Excel remains familiar and cost-effective, clinics achieve professional project reporting without complexity. Therefore, adopting this dashboard improves efficiency, accountability, and long-term success.
Frequently Asked Questions (FAQs)
What is a Clinic Project KPI Dashboard in Excel?
A Clinic Project KPI Dashboard in Excel is a structured Excel tool that tracks and analyzes project performance using key metrics like cost, timeline, and completion status.
Can this dashboard handle multiple projects?
Yes, the dashboard supports multiple projects by consolidating KPI data into a unified structure.
Do I need advanced Excel skills to use it?
No, basic Excel knowledge is enough. The dashboard uses predefined formulas and dropdowns.
Can I customize KPIs in the dashboard?
Yes, clinics can easily add, remove, or modify KPIs based on project requirements.
How often should I update the dashboard?
Ideally, update it monthly. However, weekly updates work well for critical projects.
Is this dashboard suitable for small clinics?
Yes, both small and large clinics can benefit because the dashboard scales easily.
Does it support year-over-year comparison?
Yes, the Previous Year Number Sheet enables year-over-year performance analysis.
Can I use this dashboard for non-clinical projects?
Absolutely. You can adapt it for IT, infrastructure, or administrative projects.
Visit our YouTube channel to learn step-by-step video tutorials
Watch the step-by-step video tutorial:
Click to buy Clinic Project KPI Dashboard in Excel