Managing purchasing activities in clinics is never simple. Clinics deal with medicines, medical equipment, consumables, services, taxes, and multiple vendors every single day. Therefore, purchasing teams must control costs, track pending orders, monitor vendors, and ensure compliance at all times. However, when purchasing data stays scattered across Excel files, invoices, emails, and ERP exports, visibility drops quickly.
That is exactly why a Clinic Purchasing Dashboard in Power BI becomes a powerful and practical solution.
In this in-depth article, you will learn what a Clinic Purchasing Dashboard in Power BI is, why clinics need it, how it works, its page-wise dashboard structure, key metrics, advantages, best practices, and frequently asked questions. Moreover, this guide uses simple language, strong transitions, and real clinic purchasing logic so you can confidently apply it in real-world healthcare environments.
Click to Purchases Clinic Purchasing Dashboard in Power BI
What Is a Clinic Purchasing Dashboard in Power BI?
A Clinic Purchasing Dashboard in Power BI is an interactive analytics tool that helps clinics track, analyze, and visualize purchasing-related data in one centralized platform.
Instead of manually reviewing purchase orders, vendor bills, and cost sheets, this dashboard converts raw data into clear KPIs, charts, and trends. As a result, clinic administrators, procurement teams, and finance managers gain instant clarity on spending, vendor performance, and cost distribution.
Because Power BI updates visuals dynamically, decision-makers can identify issues early and take corrective actions faster.
Why Do Clinics Need a Purchasing Dashboard in Power BI?
Clinic purchasing involves high volumes, strict budgets, and regulatory pressure. Therefore, teams must work with accuracy and speed. However, traditional reporting methods fail to deliver real-time insights.
Here is why clinics increasingly rely on a Clinic Purchasing Dashboard in Power BI:
-
Clinics purchase from multiple vendors across departments
-
Medical items have tax variations and price fluctuations
-
Manual reports cause delays and errors
-
Leadership needs quick cost visibility for decisions
-
Compliance requires accurate documentation and tracking
With Power BI, clinics gain a single source of truth for all purchasing data.
How Does a Clinic Purchasing Dashboard in Power BI Work?
The dashboard connects purchasing data from sources such as Excel, ERP systems, accounting software, or hospital management systems. Then, Power BI cleans, models, and visualizes the data using interactive visuals.
Here is how the process flows:
-
Data loads from purchasing systems
-
Data gets cleaned and transformed
-
KPIs and measures get calculated
-
Visuals update automatically
-
Users interact using slicers and filters
As a result, teams spend less time preparing reports and more time analyzing insights.
Page-Wise Structure of Clinic Purchasing Dashboard in Power BI
This Clinic Purchasing Dashboard in Power BI contains five well-structured pages, each designed to answer specific purchasing questions.
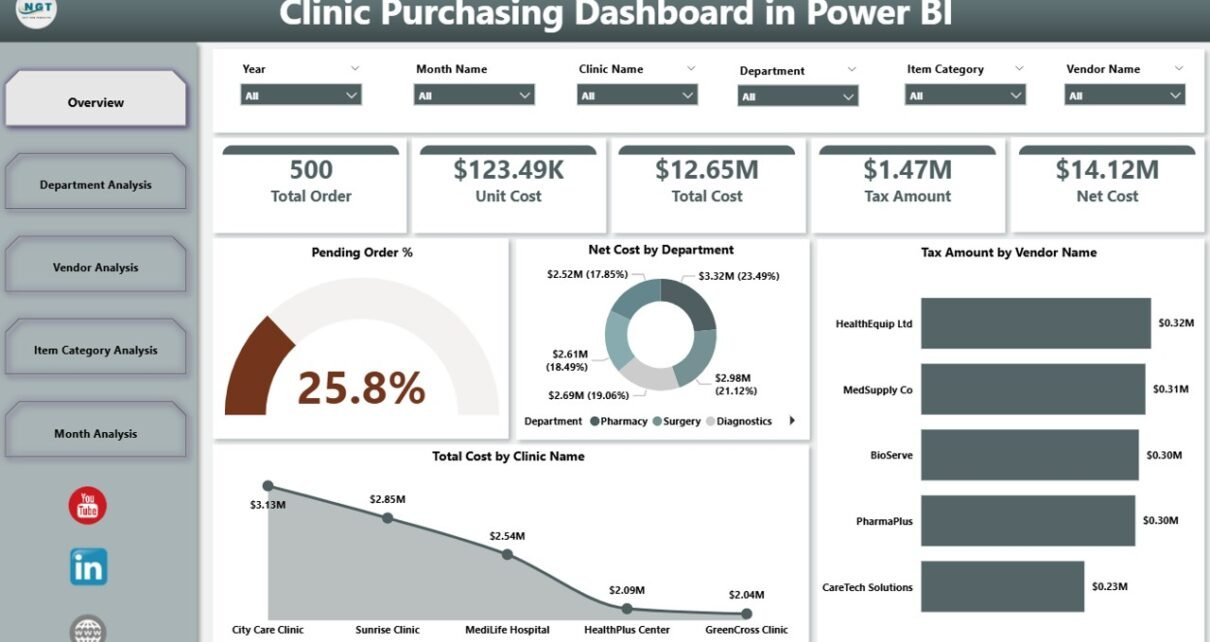
Overview Page: What Is the Overall Purchasing Health of the Clinic?
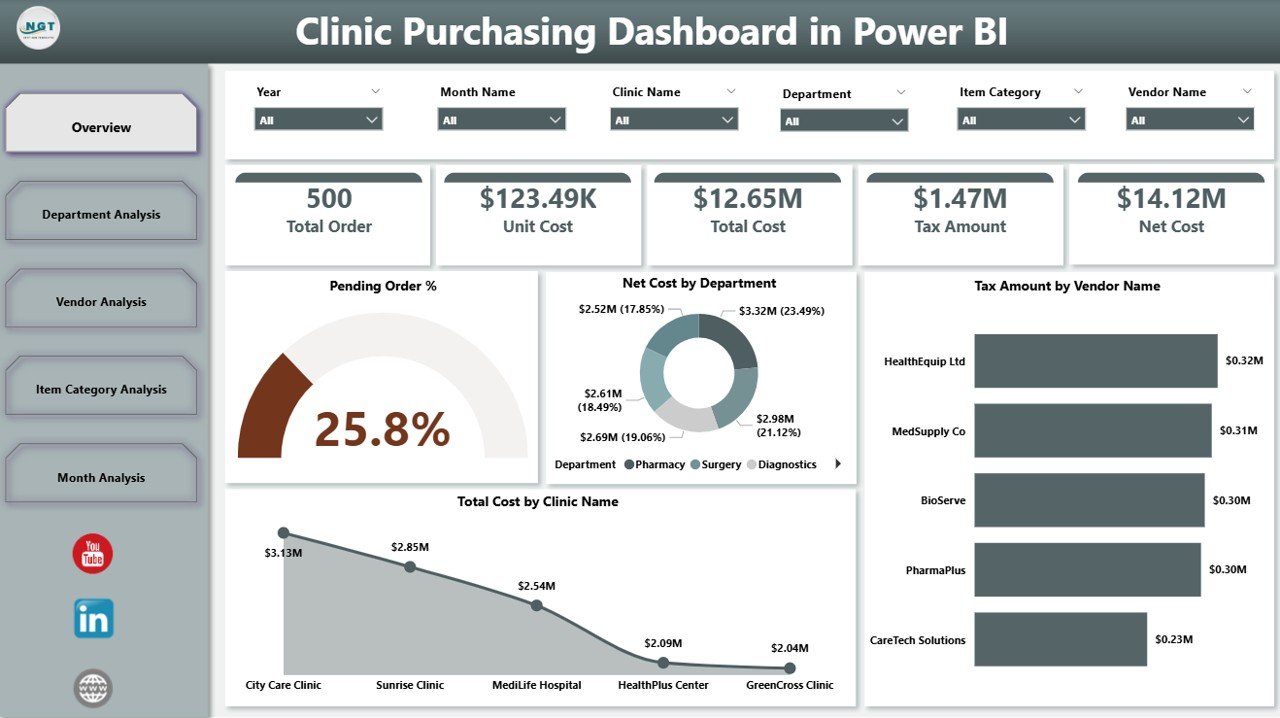
The Overview Page serves as the main entry point of the dashboard. Therefore, it provides a high-level snapshot of purchasing performance across clinics, departments, and vendors.
Key Features of the Overview Page
This page includes slicers, cards, and charts that update dynamically.
KPI Cards on Overview Page
The dashboard displays four KPI cards:
-
Pending Order % – Shows how many purchase orders remain open
-
Net Cost – Displays total net purchasing cost
-
Tax Amount – Highlights tax impact on purchases
-
Total Cost – Combines net cost and tax
These cards help decision-makers quickly assess purchasing efficiency.
Charts on Overview Page
The page also includes four analytical charts:
-
Pending Order % – Highlights procurement delays
-
Net Cost by Department – Shows department-wise spending
-
Tax Amount by Vendor Name – Identifies tax-heavy vendors
-
Total Cost by Clinic Name – Compares spending across clinics
As a result, leadership can spot cost drivers instantly.
Department Analysis Page: Which Departments Spend the Most?
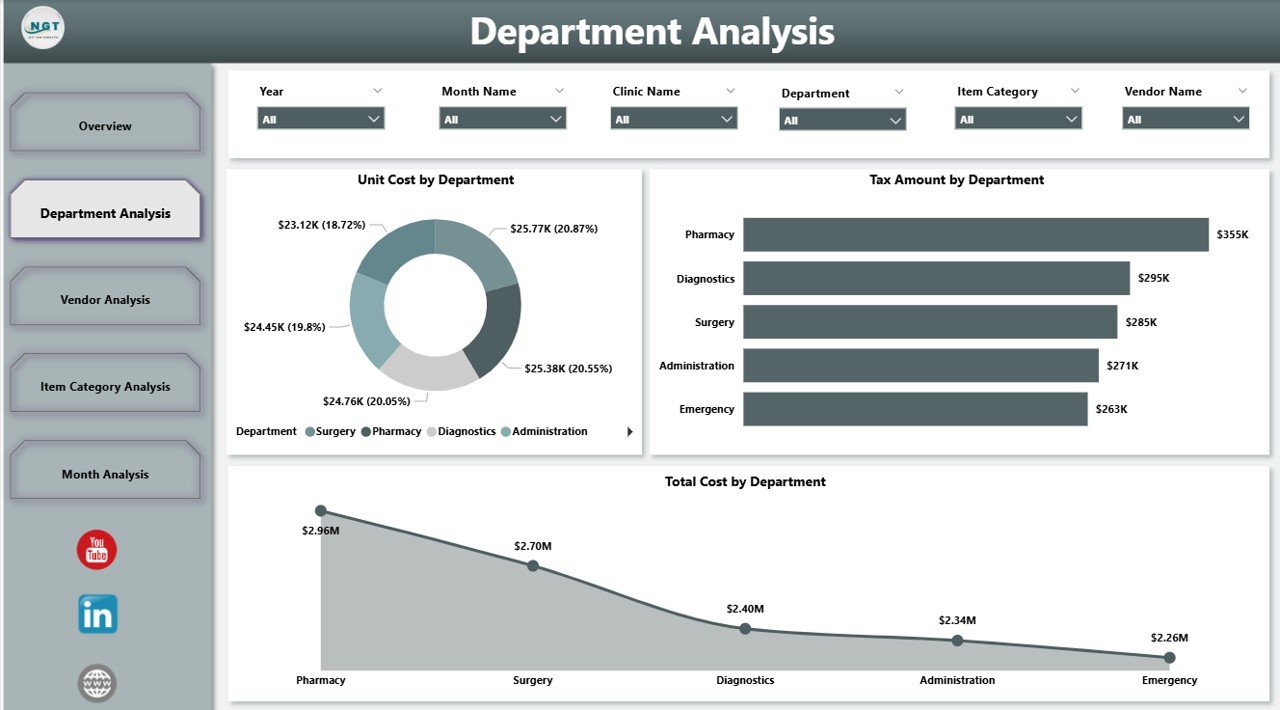
The Department Analysis Page focuses on internal spending patterns. Therefore, it helps clinics control departmental budgets more effectively.
Charts on Department Analysis Page
This page includes three focused charts:
-
Unit Cost by Department – Identifies departments with high unit prices
-
Tax Amount by Department – Highlights tax contribution per department
-
Total Cost by Department – Shows overall purchasing impact
Because slicers control the view, users can drill down by time, clinic, or vendor.
Vendor Analysis Page: Which Vendors Impact Costs the Most?
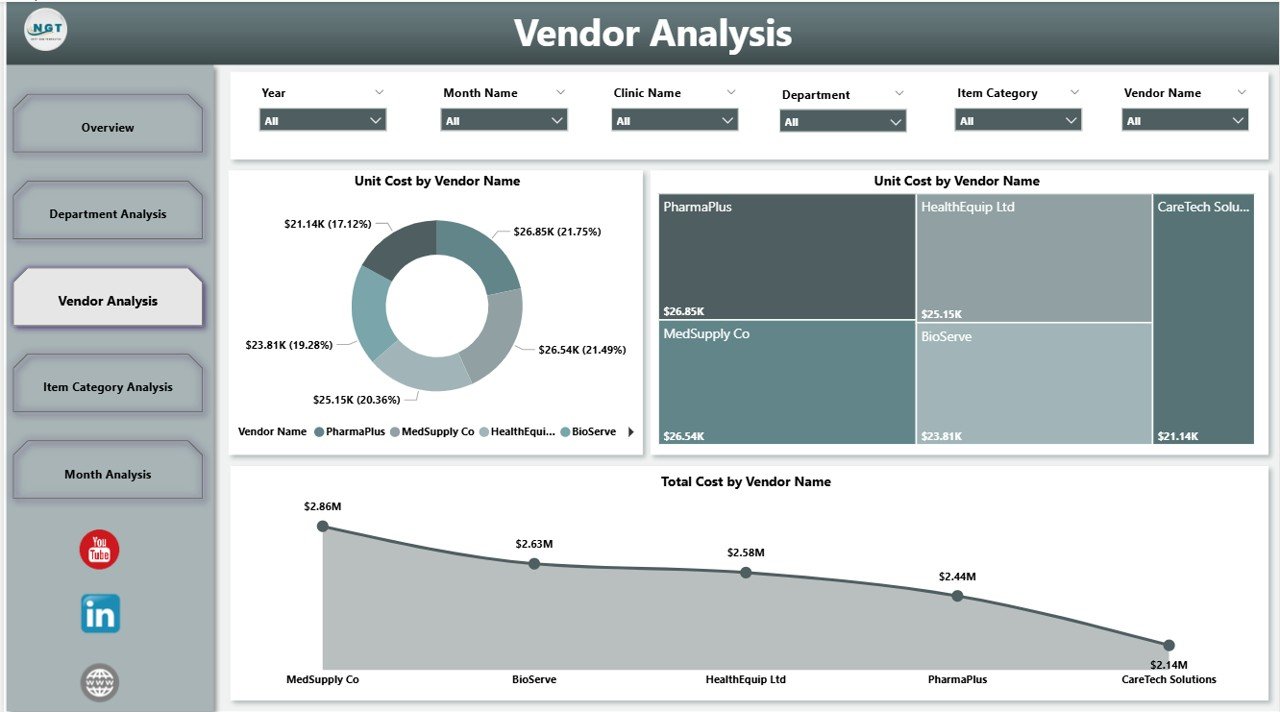
Vendor performance plays a major role in clinic purchasing success. Therefore, the Vendor Analysis Page helps evaluate suppliers clearly.
Charts on Vendor Analysis Page
This page includes three vendor-focused charts:
-
Unit Cost by Vendor Name – Compares vendor pricing
-
Tax Amount by Vendor Name – Highlights tax differences
-
Total Cost by Vendor Name – Shows vendor-wise spending
As a result, clinics can renegotiate contracts and improve vendor selection.
Item Category Analysis Page: Which Item Categories Drive Costs?
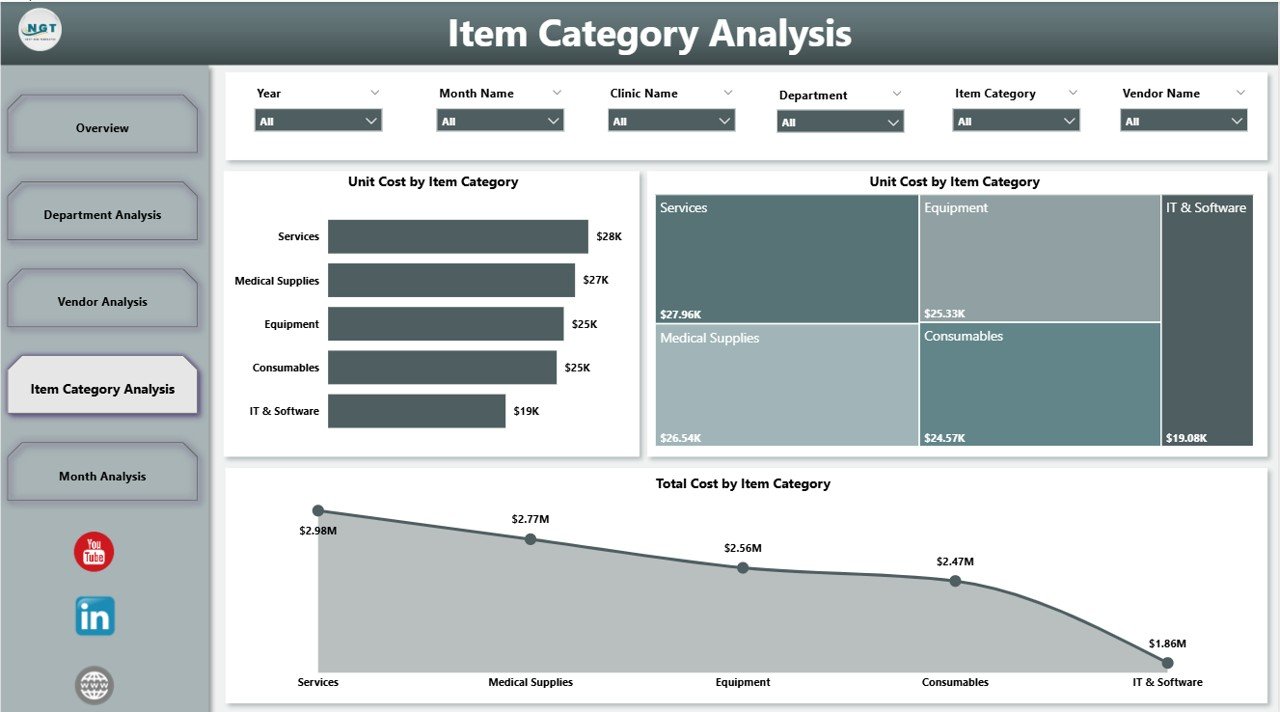
Clinics purchase items across multiple categories such as medicines, surgical tools, lab supplies, and consumables. Therefore, category-level analysis becomes essential.
Charts on Item Category Analysis Page
This page includes three category-based charts:
-
Unit Cost by Item Category – Identifies costly categories
-
Tax Amount by Item Category – Shows tax impact per category
-
Total Cost by Item Category – Highlights major spending areas
This insight supports better budgeting and inventory planning.
Click to Purchases Clinic Purchasing Dashboard in Power BI
Monthly Trends Page: How Do Purchasing Costs Change Over Time?
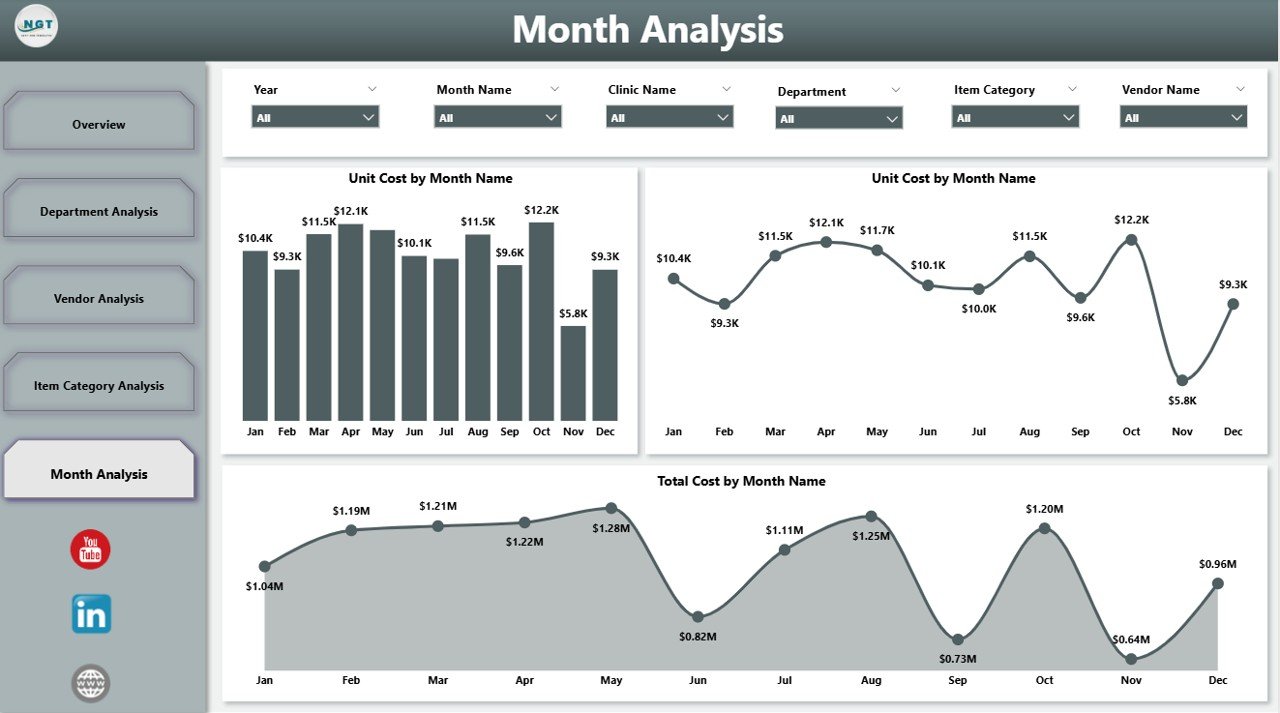
Purchasing patterns change month by month. Therefore, the Monthly Trends Page helps clinics understand seasonality and trends.
Charts on Monthly Trends Page
This page includes three time-based charts:
-
Unit Cost by Month – Tracks price changes
-
Tax Amount by Month – Shows tax fluctuations
-
Total Cost by Month – Reveals monthly spending trends
As a result, clinics can forecast costs and prepare budgets more accurately.
This dashboard tracks several essential KPIs, including:
-
Pending Order Percentage
-
Unit Cost
-
Net Cost
-
Tax Amount
-
Total Purchasing Cost
-
Department-wise Spending
-
Vendor-wise Cost Distribution
-
Category-wise Purchasing Trends
Because these metrics update automatically, teams always work with current data.
Advantages of Clinic Purchasing Dashboard in Power BI
Why Should Clinics Use This Dashboard?
A Clinic Purchasing Dashboard in Power BI delivers measurable operational and financial benefits.
Major Advantages
-
✔ Improves purchasing transparency
-
✔ Reduces manual reporting effort
-
✔ Identifies cost leakages early
-
✔ Supports better vendor negotiations
-
✔ Enhances budget control
-
✔ Improves compliance and audit readiness
-
✔ Enables faster, data-driven decisions
Because insights remain visual and interactive, adoption stays high across teams.
Who Can Benefit from a Clinic Purchasing Dashboard in Power BI?
This dashboard supports multiple stakeholders, including:
-
Clinic administrators
-
Procurement managers
-
Finance teams
-
Accounts payable staff
-
Operations managers
-
Senior leadership
Each role benefits from tailored insights using the same data model.
Best Practices for the Clinic Purchasing Dashboard in Power BI
How Can Clinics Get Maximum Value from This Dashboard?
Following best practices ensures long-term success.
Recommended Best Practices
-
🔹 Maintain clean and standardized purchasing data
-
🔹 Use consistent vendor and item naming conventions
-
🔹 Refresh data regularly for accuracy
-
🔹 Apply role-based access control
-
🔹 Review KPIs weekly or monthly
-
🔹 Use trend analysis for forecasting
-
🔹 Align dashboard metrics with purchasing policies
Because Power BI evolves continuously, clinics should also review dashboards periodically.
How Does This Dashboard Support Cost Optimization?
The dashboard highlights cost drivers clearly. Therefore, clinics can:
-
Reduce unnecessary purchases
-
Control department overspending
-
Identify high-cost vendors
-
Optimize item category spending
-
Improve procurement cycle efficiency
As a result, purchasing becomes proactive instead of reactive.
How Secure Is a Clinic Purchasing Dashboard in Power BI?
Power BI supports enterprise-grade security. Therefore, clinics can:
-
Restrict access using user roles
-
Apply row-level security
-
Control data refresh permissions
-
Protect sensitive financial information
This approach ensures compliance with healthcare data standards.
Conclusion: Why a Clinic Purchasing Dashboard in Power BI Is Essential
Click to Purchases Clinic Purchasing Dashboard in Power BI
A Clinic Purchasing Dashboard in Power BI transforms complex purchasing data into actionable insights. Instead of relying on static reports, clinics gain dynamic visibility into costs, vendors, departments, and trends.
Because the dashboard centralizes purchasing intelligence, clinics improve cost control, operational efficiency, and decision-making speed. Therefore, any clinic aiming for smarter procurement should consider adopting this solution.
Frequently Asked Questions About Clinic Purchasing Dashboard in Power BI
What is a Clinic Purchasing Dashboard in Power BI used for?
It helps clinics track purchasing costs, vendor performance, departmental spending, and trends in one interactive platform.
Can small clinics use this dashboard effectively?
Yes. Power BI scales well, so small clinics benefit as much as large healthcare organizations.
Does this dashboard replace ERP systems?
No. It complements ERP systems by providing better visualization and analytics.
How often should data refresh occur?
Most clinics refresh data daily or weekly, depending on transaction volume.
Can clinics customize KPIs in the dashboard?
Yes. Power BI allows full customization based on clinic requirements.
Is technical expertise required to use the dashboard?
Basic Power BI knowledge helps, but most users can interact easily through filters and slicers.
Does this dashboard support budgeting and forecasting?
Yes. Monthly trends and historical data support accurate budgeting and forecasting.
Visit our YouTube channel to learn step-by-step video tutorials