Managing clinic tenders requires accuracy, transparency, and continuous performance tracking. However, many clinics still depend on scattered spreadsheets and manual reports. As a result, decision-making slows down and risks increase. Therefore, a Clinic Tender KPI Dashboard in Excel becomes an essential tool for clinics that want control, clarity, and confidence.
In this detailed and SEO-friendly guide, you will learn everything about the Clinic Tender KPI Dashboard in Excel. Moreover, you will understand what it is, why it matters, how it works, its worksheet structure, advantages, best practices, and common questions. Additionally, this article explains how Excel transforms tender data into actionable insights without expensive BI tools.
Click to buy Clinic Tender KPI Dashboard in Excel
What Is a Clinic Tender KPI Dashboard in Excel?
A Clinic Tender KPI Dashboard in Excel is a structured and interactive Excel-based reporting tool designed to monitor, analyze, and track tender-related key performance indicators (KPIs) in clinics and healthcare organizations.
Clinics usually handle tenders for:
- Medical equipment
- Pharmaceuticals
- Consumables
- Maintenance services
- Technology and software vendors
Because these tenders involve budgets, compliance, and vendor performance, clinics need real-time visibility. Instead of managing multiple spreadsheets, this dashboard consolidates all tender KPIs into one centralized Excel workbook. Consequently, teams gain faster insights and stronger control.
Why Do Clinics Need a Tender KPI Dashboard?
Clinic tender management includes multiple stages, stakeholders, and strict compliance rules. However, manual tracking creates delays and errors. Therefore, clinics increasingly rely on KPI dashboards.
A Clinic Tender KPI Dashboard helps because:
- It centralizes all tender KPIs
- It improves transparency and accountability
- It highlights risks early
- It supports faster decisions
- It improves vendor and cost control
Moreover, Excel-based dashboards offer flexibility and affordability, which makes them ideal for clinics of all sizes.
How Does a Clinic Tender KPI Dashboard in Excel Work?
The dashboard works by connecting input sheets with calculation logic and visual dashboards. First, users enter actual, target, and previous-year data. Next, Excel formulas calculate variances, trends, and comparisons. Finally, the dashboard displays results using charts, cards, and indicators.
Because everything updates dynamically, users can analyze performance instantly by changing the selected month or KPI.
What Are the Key Features of the Clinic Tender KPI Dashboard in Excel?
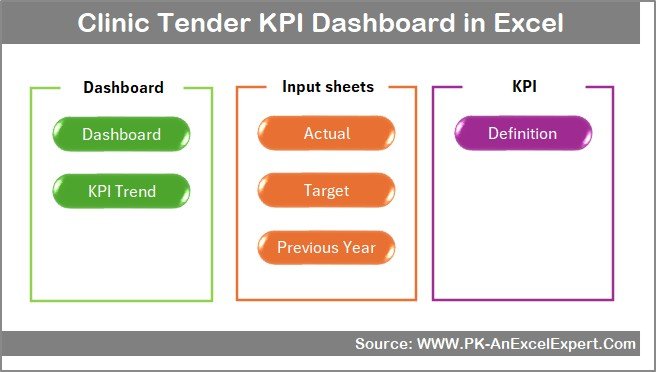
This Clinic Tender KPI Dashboard includes 7 structured worksheets. Each sheet plays a specific role and improves usability.
What Is the Summary Page in the Clinic Tender KPI Dashboard?
Summary Page (Index Sheet)
The Summary Page acts as the navigation hub of the dashboard.
Key highlights:
- Clean index layout
- 6 interactive buttons
- One-click navigation to all major sheets
- User-friendly structure for non-technical users
As a result, users move quickly between dashboard sections without scrolling or searching.
Click to buy Clinic Tender KPI Dashboard in Excel
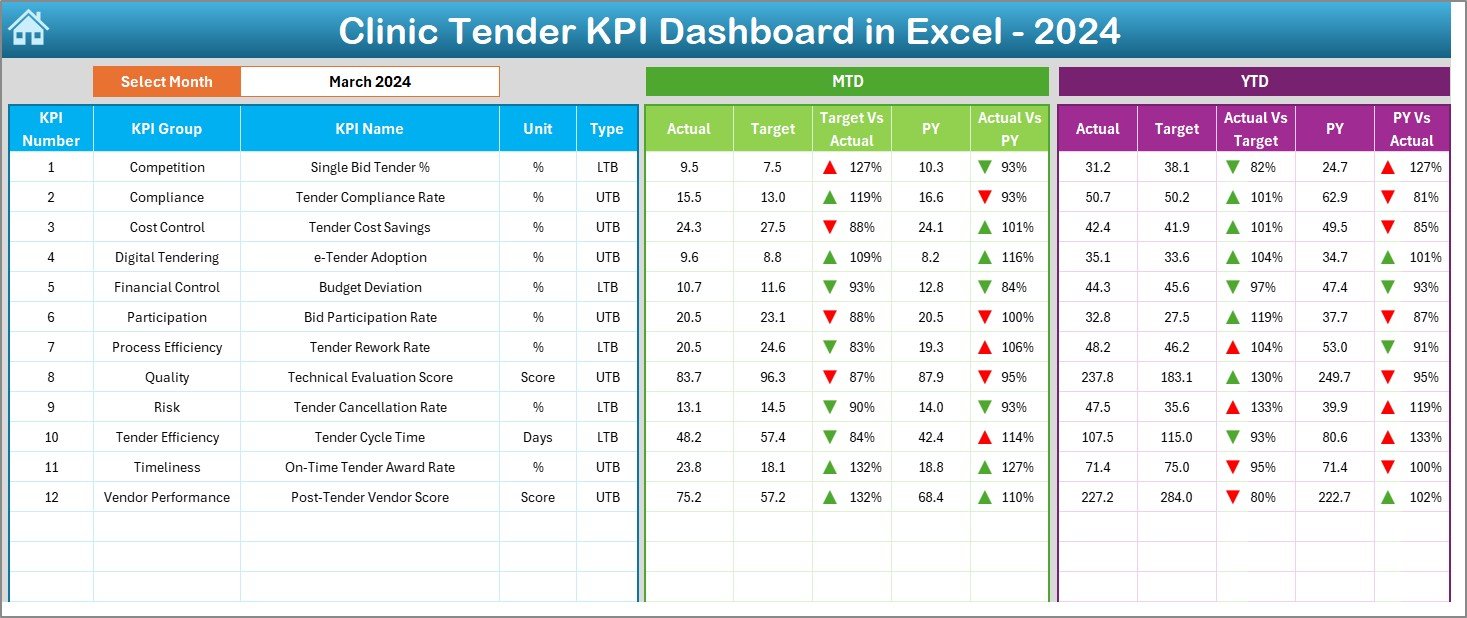
What Information Does the Dashboard Sheet Show?
Dashboard Sheet Tab
The Dashboard Sheet serves as the core reporting page.
Key functionalities:
- Month selection using a drop-down at cell D3
- Dynamic update of all KPIs based on selected month
- Clear comparison between performance metrics
Displayed metrics include:
- MTD (Month-to-Date) Actual
- MTD Target
- MTD Previous Year
- Target vs Actual variance
- Previous Year vs Actual variance
- YTD (Year-to-Date) Actual
- YTD Target
- YTD Previous Year
Additionally, conditional formatting arrows show:
- Positive performance
- Negative performance
Therefore, decision-makers instantly identify improvement areas.
Click to buy Clinic Tender KPI Dashboard in Excel
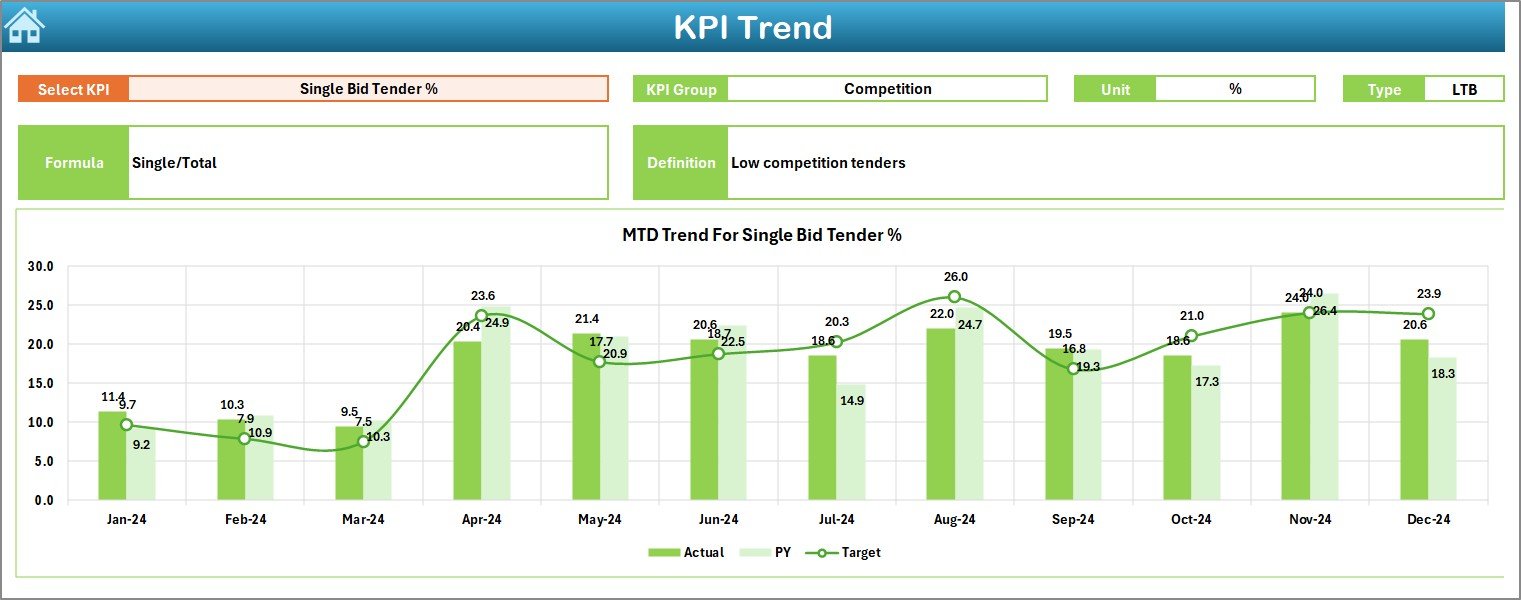
How Does the Trend Sheet Help in KPI Analysis?
Trend Sheet Tab
The Trend Sheet focuses on deep KPI-level analysis.
Features include:
- KPI selection drop-down at cell C3
- Display of KPI metadata:
KPI Group
Unit
KPI Type (LTB or UTB)
Formula
Definition
Moreover, the sheet shows:
- MTD trend chart (Actual, Target, PY)
- YTD trend chart (Actual, Target, PY)
Because of these visuals, users track performance movement over time instead of relying on static numbers.
Click to buy Clinic Tender KPI Dashboard in Excel
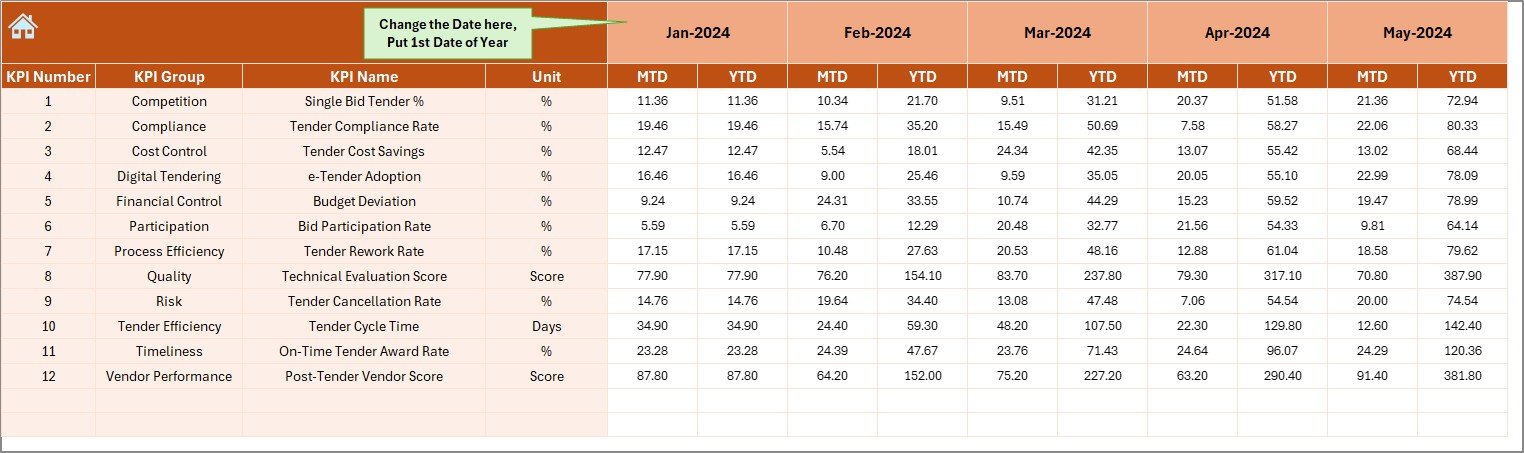
Where Do You Enter Actual KPI Numbers?
Actual Numbers Input Sheet
This sheet handles real performance data entry.
How it works:
- Select the first month of the year in cell E1
- Enter MTD and YTD actual values
- Monthly structure ensures consistency
As a result, data flows automatically to all charts and dashboards.
Click to buy Clinic Tender KPI Dashboard in Excel
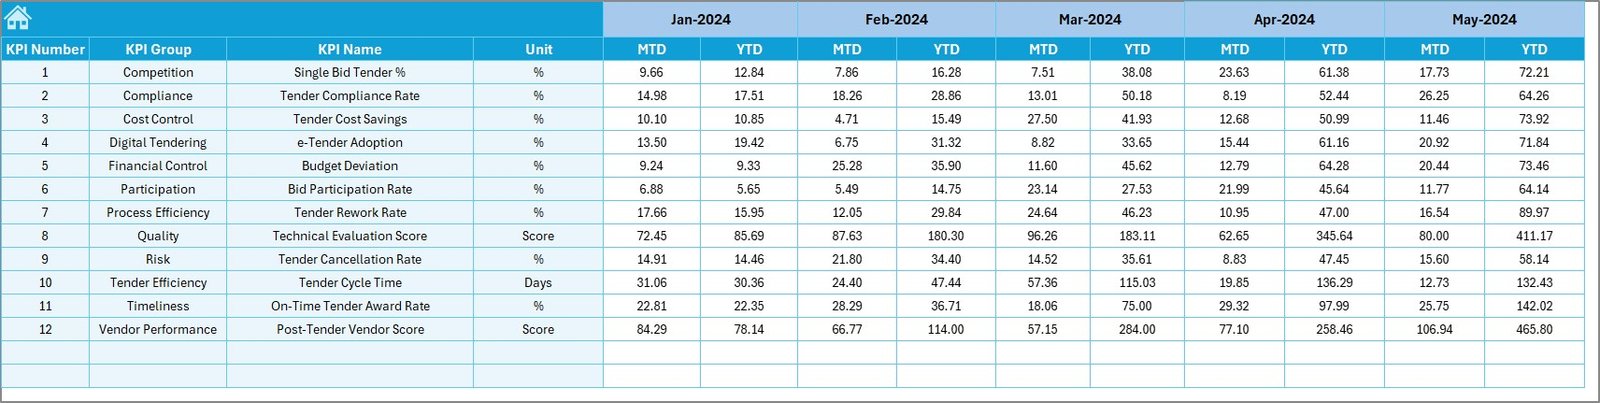
How Are Target Values Managed in the Dashboard?
Target Sheet Tab
The Target Sheet stores expected KPI values.
Users can:
- Enter monthly MTD targets
- Enter YTD targets
- Set realistic benchmarks for each KPI
Because targets drive variance analysis, this sheet plays a critical role in performance evaluation.
Click to buy Clinic Tender KPI Dashboard in Excel
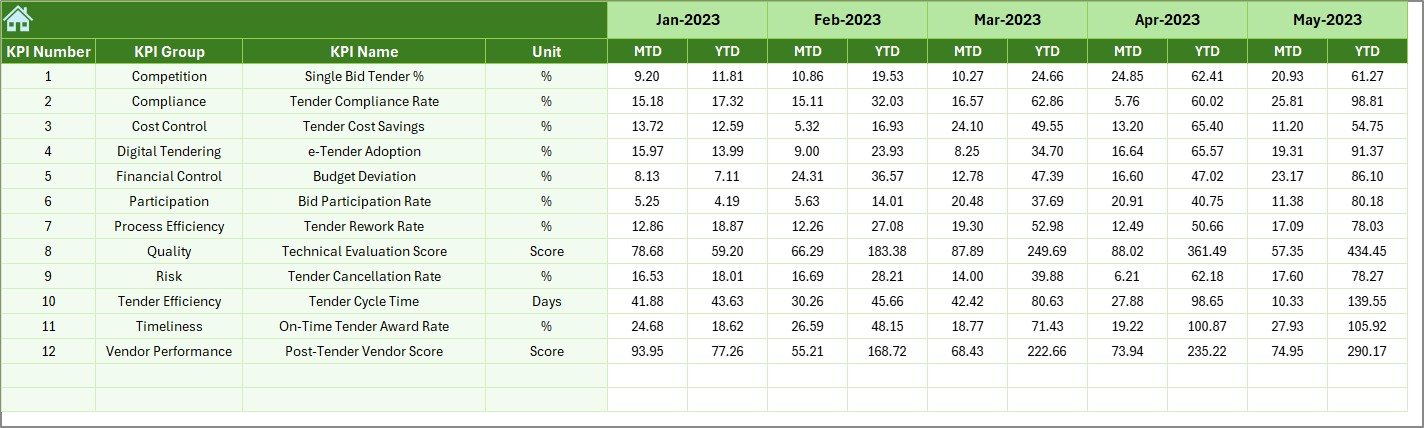
Why Is the Previous Year Sheet Important?
Previous Year Number Sheet Tab
Historical comparison improves strategic planning.
This sheet allows users to:
- Enter previous-year MTD values
- Enter previous-year YTD values
- Compare year-over-year performance
Consequently, clinics measure growth, decline, or consistency accurately.
Click to buy Clinic Tender KPI Dashboard in Excel
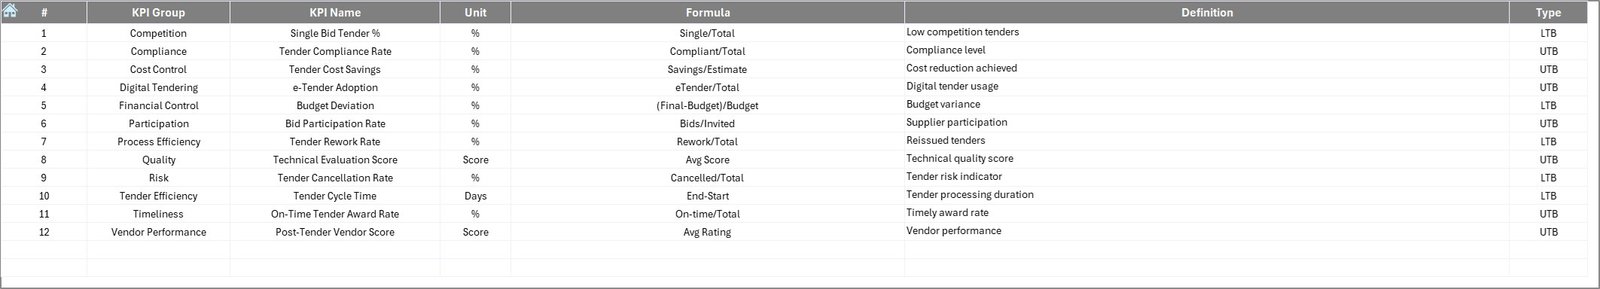
What Is the Role of the KPI Definition Sheet?
KPI Definition Sheet Tab
This sheet standardizes KPI understanding across teams.
It includes:
- KPI Name
- KPI Group
- Unit
- Formula
- KPI Definition
- KPI Type (Lower the Better or Upper the Better)
Therefore, everyone interprets KPIs the same way, which reduces confusion.
Click to buy Clinic Tender KPI Dashboard in Excel
Advantages of Clinic Tender KPI Dashboard in Excel
Using a Clinic Tender KPI Dashboard in Excel delivers several benefits.
Key Advantages
- Centralized KPI Monitoring
Track all tender KPIs in one Excel file. - Faster Decision-Making
R Target vs Actual Visibility
Identify gaps instantly using variance analysis. - Trend-Based Insights
Monitor KPI movement using MTD and YTD charts. - Cost Control Improvement
Detect overspending early in the tender cycle. - Year-over-Year Comparison
Measure progress using previous-year benchmarks. - Easy Customization
Add or modify KPIs without technical skills.
How Does This Dashboard Improve Clinic Tender Performance?
The dashboard improves performance by:
- Increasing data accuracy
- Highlighting risks early
- Supporting proactive decisions
- Improving accountability
- Strengthening vendor evaluation
Therefore, clinics gain control over both operational and financial outcomes.
Best Practices for the Clinic Tender KPI Dashboard in Excel
To maximize dashboard value, clinics should follow best practices.
Best Practices You Should Follow
- Define KPIs clearly before implementation
- Use consistent data entry formats
- Update actual data monthly
- Review dashboard trends regularly
- Align KPIs with clinic procurement goals
- Train users on dashboard navigation
- Avoid overloading the dashboard with too many KPIs
Because consistency drives accuracy, these practices ensure reliable insights.
How Can Clinics Customize This KPI Dashboard?
Clinics can easily customize the dashboard by:
- Adding new KPIs in the KPI Definition sheet
- Updating target benchmarks
- Modifying trend charts
- Adjusting KPI groups based on tender categories
Since Excel supports flexibility, customization requires minimal effort.
Who Can Use a Clinic Tender KPI Dashboard in Excel?
This dashboard suits multiple roles, such as:
- Clinic procurement managers
- Tender evaluation committees
- Finance teams
- Hospital administrators
- Compliance officers
- Healthcare consultants
Therefore, it supports both operational and strategic users.
Conclusion: Why Should Clinics Use a Tender KPI Dashboard in Excel?
A Clinic Tender KPI Dashboard in Excel delivers clarity, control, and confidence. Instead of struggling with scattered data, clinics gain a single source of truth. Moreover, the dashboard improves transparency, cost control, and performance tracking.
Because Excel remains familiar and affordable, this dashboard offers enterprise-level insights without complexity. Therefore, clinics that want smarter tender decisions should adopt this KPI dashboard today.
Frequently Asked Questions (FAQs)
What is a Clinic Tender KPI Dashboard in Excel?
A Clinic Tender KPI Dashboard in Excel tracks tender performance using KPIs such as actuals, targets, trends, and year-over-year comparisons in one interactive file.
Can small clinics use this dashboard?
Yes, small and medium clinics can easily use it because Excel requires no advanced tools or licenses.
How often should KPI data be updated?
Clinics should update KPI data monthly to maintain accurate MTD and YTD insights.
Can we add custom KPIs?
Yes, users can add or modify KPIs directly from the KPI Definition sheet.
Does this dashboard support trend analysis?
Yes, it includes MTD and YTD trend charts for actual, target, and previous-year values.
Is Excel suitable for tender KPI reporting?
Absolutely. Excel offers flexibility, affordability, and strong analytical features for tender KPI tracking.
Watch the step-by-step video tutorial:
Visit our YouTube channel to learn step-by-step video tutorials
Click to buy Clinic Tender KPI Dashboard in Excel