In today’s healthcare and pharmaceutical industry, clinical trials play a critical role in bringing new treatments to market. However, managing clinical trial data across multiple sites, patients, timelines, and compliance metrics becomes extremely complex.
Because of this complexity, many organizations still rely on manual spreadsheets and disconnected systems. As a result, they struggle to track KPIs, monitor performance, and ensure compliance.
Therefore, organizations now adopt intelligent dashboards to streamline operations. That’s where the Clinical Trials Management KPI Dashboard in Power BI becomes a powerful and essential solution.
In this detailed guide, you will learn everything about this dashboard. Moreover, you will understand its structure, features, advantages, best practices, and how it improves decision-making in clinical trials.
What is a Clinical Trials Management KPI Dashboard in Power BI?
A Clinical Trials Management KPI Dashboard in Power BI is an interactive reporting tool designed to monitor and analyze clinical trial performance using key performance indicators (KPIs).
It helps you track:
- Trial progress
- Patient enrollment
- Target vs actual performance
- Monthly and yearly trends
- Compliance metrics
- Operational efficiency
Instead of using multiple reports, you can view all clinical trial data in one centralized dashboard. As a result, you gain better visibility and control over your trial operations.
Why Do Clinical Trials Need KPI Dashboards?
Click to Buy Clinical Trials Management KPI Dashboard in Power BI
Clinical trials generate large volumes of data. However, without proper tracking, teams cannot measure performance effectively.
Therefore, a KPI dashboard helps you:
-
Monitor trial progress in real time
-
Track target achievements
-
Identify delays and risks early
-
Improve compliance and reporting
-
Enhance decision-making
Moreover, it reduces manual effort and improves accuracy.
Key Features of Clinical Trials Management KPI Dashboard in Power BI
This dashboard includes 3 interactive and powerful pages, each designed to deliver actionable insights.
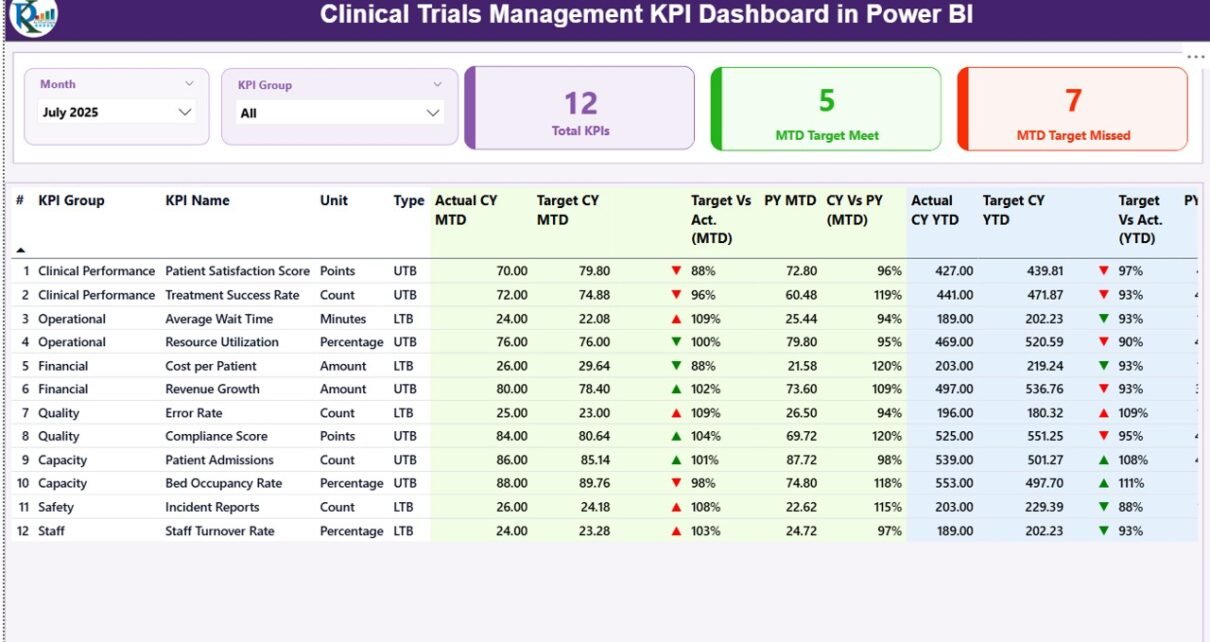
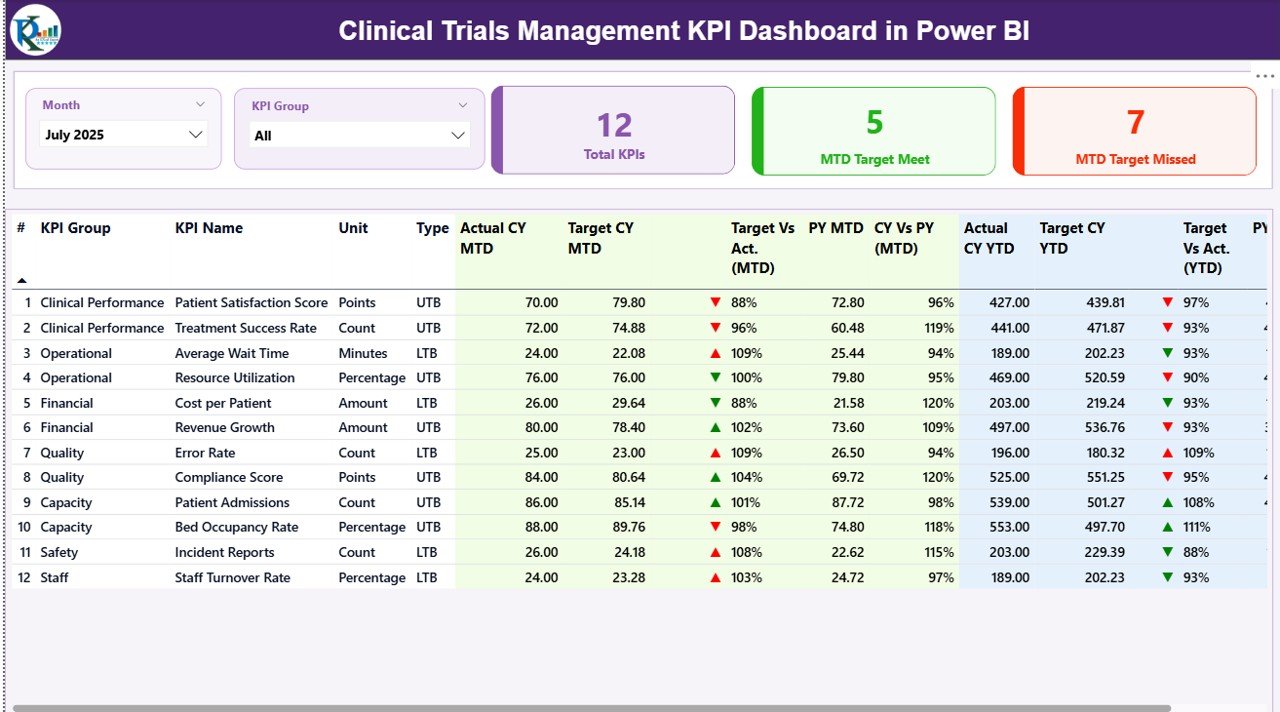
📌 1. Summary Page – Complete KPI Overview
The Summary Page works as the main control panel of the dashboard.
🔹 Top Section:
-
Month slicer
-
KPI Group slicer
📊 KPI Cards:
-
Total KPIs Count
-
MTD Target Met Count
-
MTD Target Missed Count
📋 Detailed KPI Table Includes:
-
KPI Number
-
KPI Group
-
KPI Name
-
Unit
-
KPI Type (LTB or UTB)
📈 MTD Performance Metrics:
-
Actual CY MTD
-
Target CY MTD
-
MTD Status Icons (▲ ▼ with red/green indicators)
-
Target vs Actual (MTD %)
-
Previous Year MTD
-
CY vs PY (MTD %)
📊 YTD Performance Metrics:
-
Actual CY YTD
-
Target CY YTD
-
YTD Status Icons
-
Target vs Actual (YTD %)
-
Previous Year YTD
-
CY vs PY (YTD %)
🎯 Why This Page Matters:
Because this page provides a full snapshot, users can quickly evaluate performance and identify gaps.
Click to Buy Clinical Trials Management KPI Dashboard in Power BI
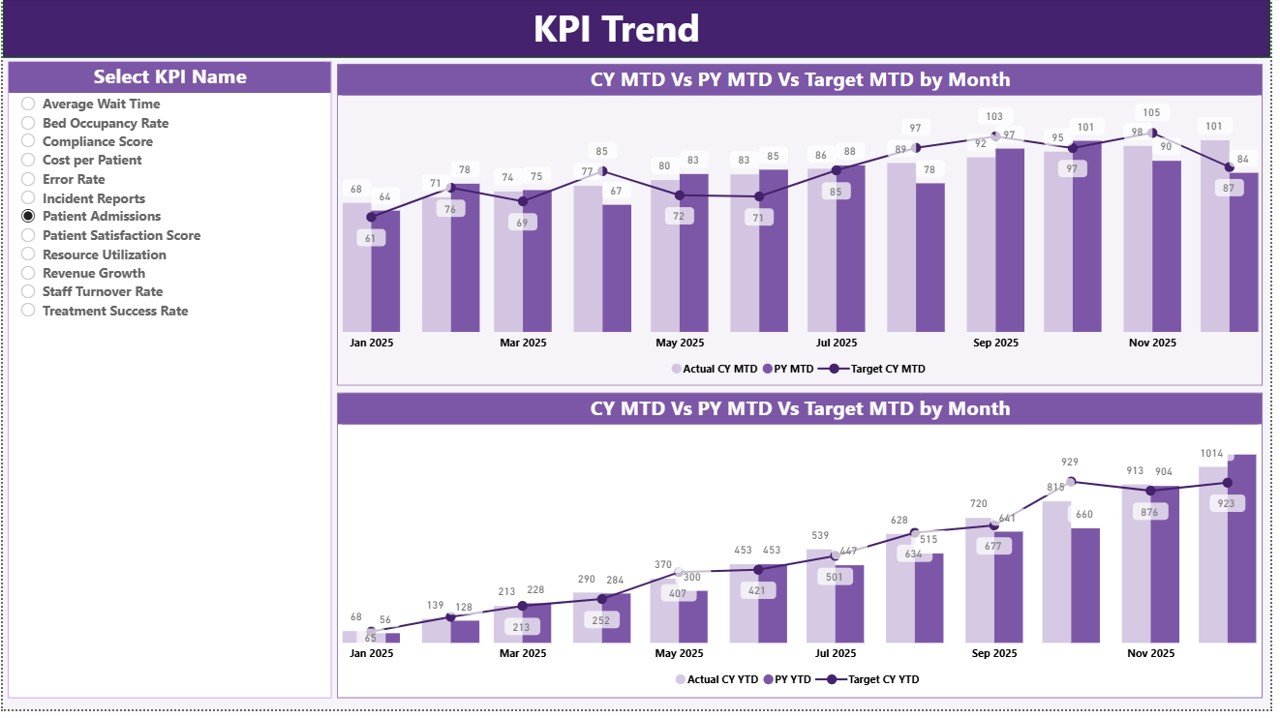
📈 2. KPI Trend Page – Analyze Performance Over Time
This page focuses on trend analysis and comparisons.
📊 Key Features:
-
Two combo charts for MTD and YTD
-
Comparison between:
-
Current Year Actual
-
Previous Year Actual
-
Target values
-
🎛️ Slicer:
-
KPI Name selection
🔍 Insights You Can Get:
-
KPI performance trends
-
Target achievement patterns
-
Year-over-year comparisons
🚀 Why It Matters:
Because trends reveal patterns, this page helps predict future outcomes and improve planning.
Click to Buy Clinical Trials Management KPI Dashboard in Power BI
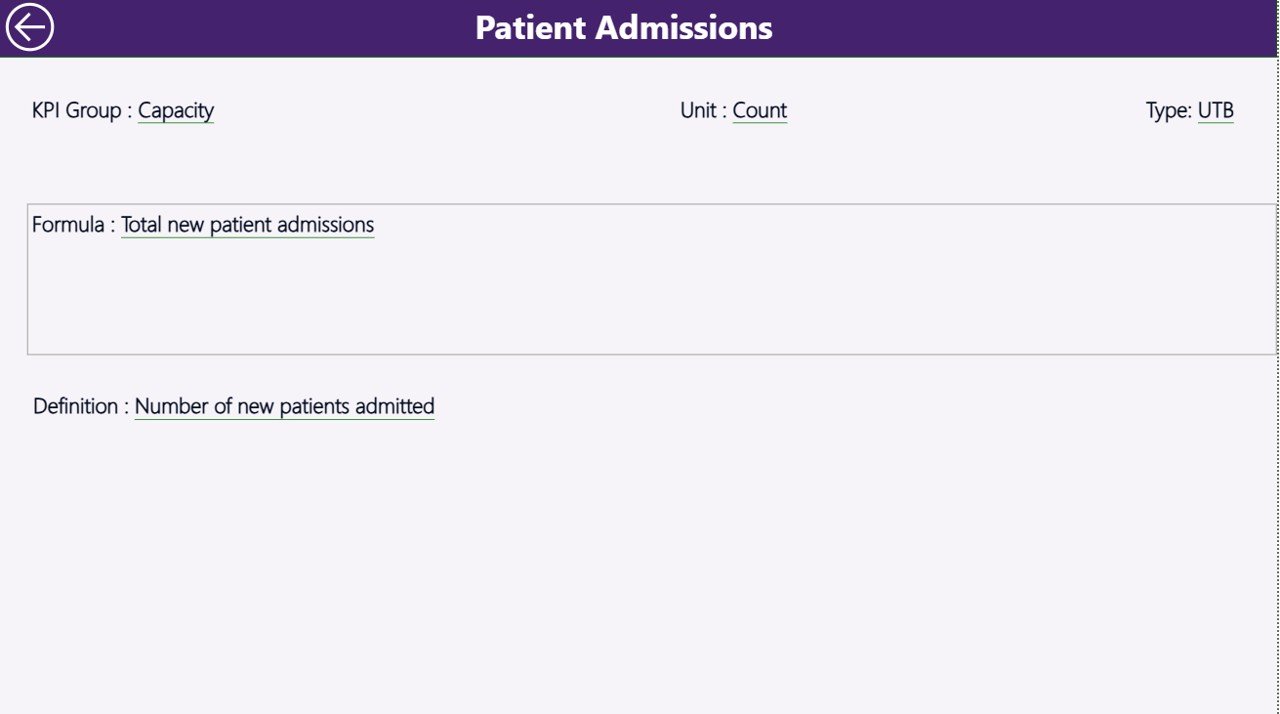
📘 3. KPI Definition Page – Drill-Through Details
This is a hidden drill-through page.
📊 Key Information:
-
KPI Formula
-
KPI Definition
-
KPI Type (LTB/UTB)
🔄 Navigation:
-
Drill-through from Summary Page
-
Back button to return
🎯 Why It Matters:
Because clarity is important, this page helps users understand how KPIs are calculated.
Click to Buy Clinical Trials Management KPI Dashboard in Power BI
Excel Data Structure Used in the Dashboard
This dashboard uses an Excel file as its data source.
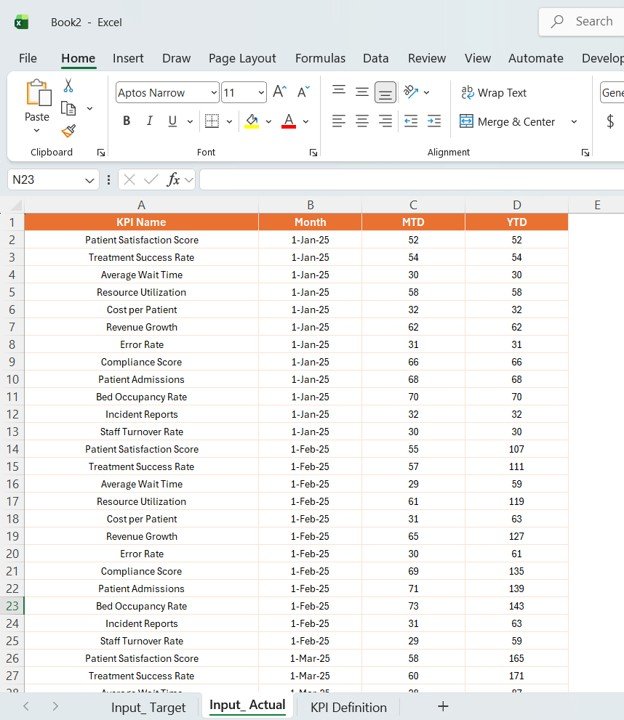
📊 1. Input_Actual Sheet
You need to enter:
-
KPI Name
-
Month (first date of month)
-
MTD values
-
YTD values
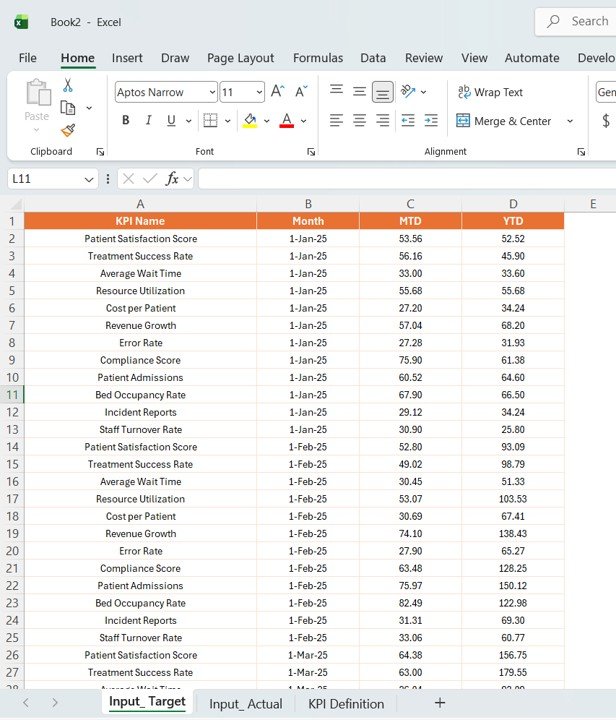
2. Input_Target Sheet
You need to input:
-
KPI Name
-
Month
-
Target MTD values
-
Target YTD values
Click to Buy Clinical Trials Management KPI Dashboard in Power BI
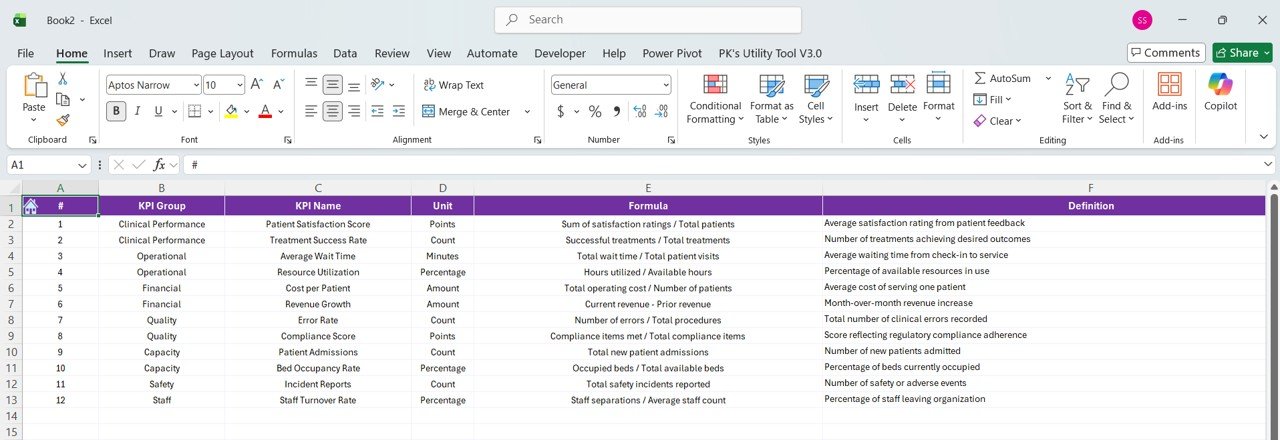
3. KPI Definition Sheet
You need to define:
- KPI Number
- KPI Group
- KPI Name
- Unit
- Formula
- Definition
- KPI Type (LTB or UTB)
Click to Buy Clinical Trials Management KPI Dashboard in Power BI
How Does This Dashboard Work?
The dashboard uses Power BI’s advanced capabilities.
🔧 Core Components:
- Data modeling
- DAX calculations
- Interactive visuals
- Filters and slicers
🔄 Workflow:
- Enter data into Excel
- Load data into Power BI
- Create relationships
- Build measures
- Design visuals
As a result, users can explore data dynamically.
Advantages of Clinical Trials Management KPI Dashboard
Click to Buy Clinical Trials Management KPI Dashboard in Power BI
This dashboard offers multiple benefits.
🚀 Key Advantages:
-
📊 Centralized KPI Monitoring
You can track all trial KPIs in one place. -
⚡ Real-Time Insights
You can monitor performance instantly. -
📉 Risk Identification
You can detect delays and issues early. -
📈 Improved Performance Tracking
You can compare targets vs actuals easily. -
🧠 Better Decision-Making
You can rely on accurate data. -
🔬 Enhanced Trial Efficiency
You can optimize clinical operations.
Opportunities for Improvement
You can enhance the dashboard further.
💡 Suggested Improvements:
-
Add patient enrollment tracking
-
Include site-level performance analysis
-
Integrate real-time clinical systems
-
Add predictive analytics
-
Include compliance tracking
As a result, you can make the dashboard more powerful.
Best Practices for the Clinical Trials KPI Dashboard
Click to Buy Clinical Trials Management KPI Dashboard in Power BI
To maximize value, follow these best practices.
✅ Best Practices:
-
📊 Maintain Data Accuracy
Always validate your data. -
🔄 Update Data Regularly
Keep information current. -
🎯 Focus on Critical KPIs
Avoid unnecessary metrics. -
📌 Use Clear Visuals
Keep charts simple. -
⚡ Optimize Dashboard Performance
Reduce heavy calculations. -
🔍 Enable Drill-Through Analysis
Allow deeper insights. -
🎨 Keep Design Consistent
Maintain uniform formatting.
Conclusion
The Clinical Trials Management KPI Dashboard in Power BI is a powerful solution for managing complex clinical data. It transforms raw data into actionable insights.
Moreover, it helps organizations track KPIs, improve efficiency, and make better decisions. As a result, clinical trials become faster, more accurate, and more successful.
If you want to optimize your clinical trial performance, this dashboard is a must-have tool.
Visit our YouTube channel to learn step-by-step video tutorials
Click to Buy Clinical Trials Management KPI Dashboard in Power BI