The comic book and publishing industry grows every year, and so does the need for clear insights, fast decision-making, and accurate performance tracking. Because competition increases each day, publishers, comic creators, and content teams need a simple and powerful way to monitor their business performance. This is where a Comic Books and Publishing KPI Dashboard in Power BI transforms the entire workflow.
In this article, you will learn everything about this dashboard—how it works, what it includes, how publishers benefit from it, and how you can use it to build smarter strategies. You will also explore best practices, features, and real-world use cases that help improve efficiency, sales performance, and audience engagement.
Click to Purchases Comic Books and Publishing KPI Dashboard in Power BI
What Is a Comic Books and Publishing KPI Dashboard in Power BI?
A Comic Books and Publishing KPI Dashboard in Power BI is a fully interactive reporting tool that helps you track your Key Performance Indicators (KPIs) for comic book production, publishing timelines, sales trends, marketing performance, and operational efficiency. It collects data from an Excel file and displays it in a clean, visual, and easy-to-understand format.
Because Power BI offers great visuals, smooth navigation, and dynamic filtering, teams can quickly analyze performance trends for both monthly (MTD) and yearly (YTD) values.
This dashboard makes it easy to:
-
Monitor story development progress
-
Track production timelines
-
Compare sales vs. targets
-
Analyze past and current performance
-
Improve publishing workflows
-
Enhance decision-making through data
With this dashboard, you get complete clarity on every key metric across your publishing business.
Click to Purchases Comic Books and Publishing KPI Dashboard in Power BI
Why Do You Need a Publishing KPI Dashboard?
The publishing industry handles several tasks at once—story creation, editing, artwork, printing, distribution, and marketing. Therefore, even a small delay or missed KPI affects the entire production cycle.
This dashboard helps you:
-
Track performance without manual work
-
Identify bottlenecks early
-
Compare targets vs. actuals
-
Improve production planning
-
Understand sales performance better
-
Make accurate forecasting decisions
Since Power BI displays everything visually, you gain instant insights without depending on multiple spreadsheets.
Key Features of the Comic Books and Publishing KPI Dashboard in Power BI
This Power BI dashboard includes three powerful pages, each designed for a unique purpose. Together, these pages give a complete 360-degree view of your publishing operations.
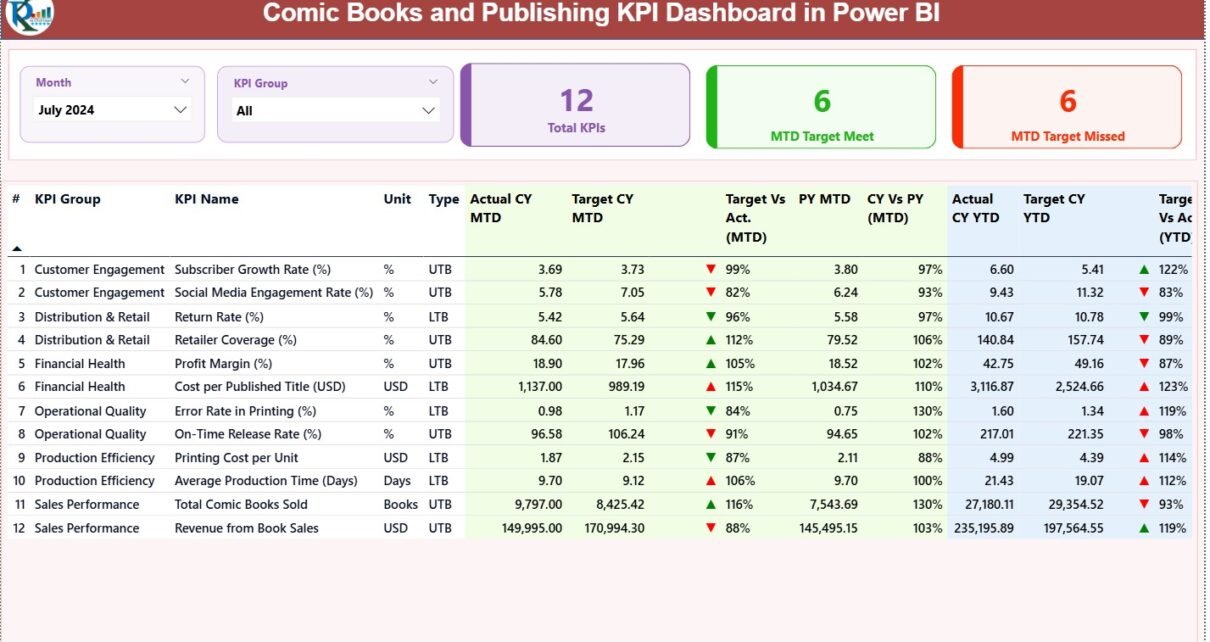
1. Summary Page – The Main Dashboard
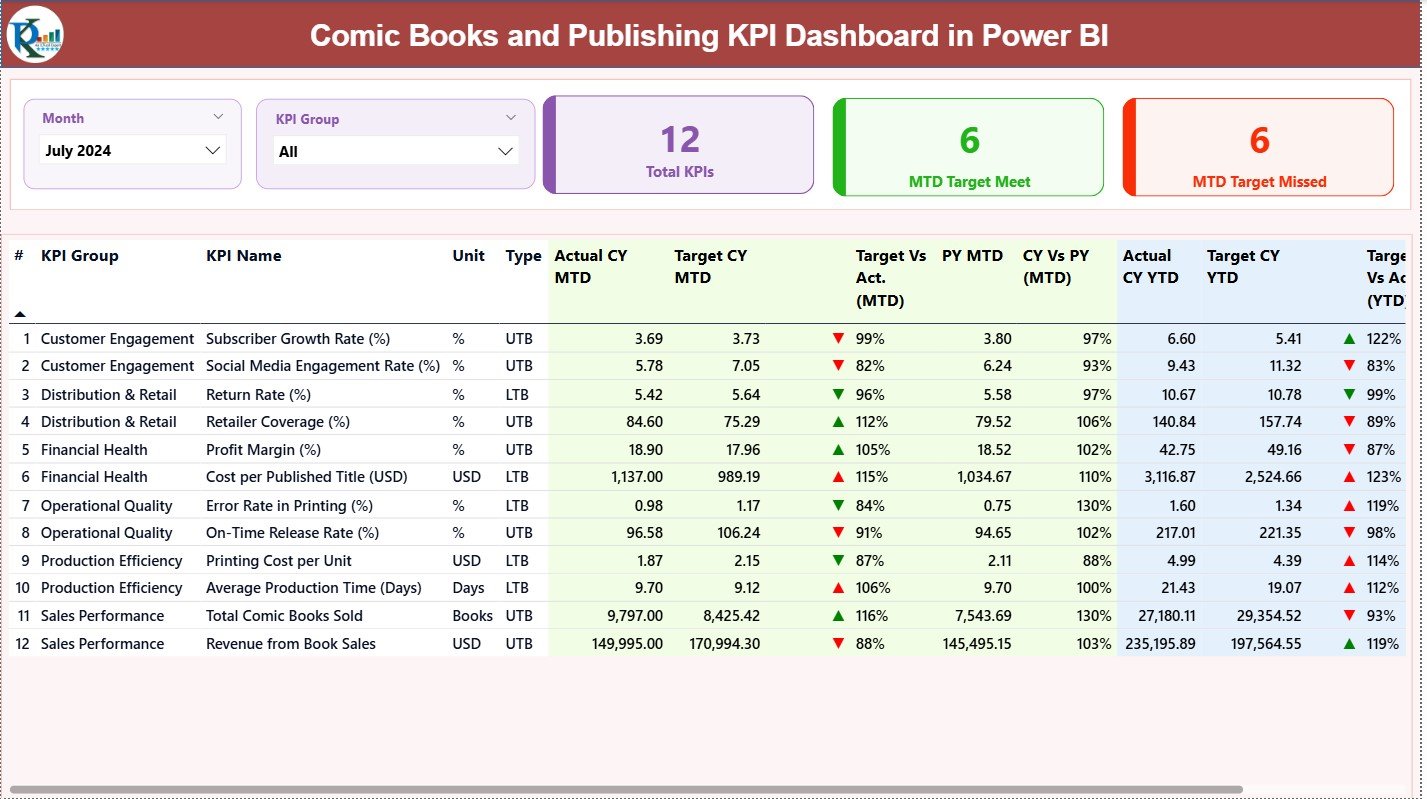
The Summary Page gives you a complete snapshot of your KPIs for the current month (MTD) and current year (YTD). It is the heart of your dashboard.
Top Section – Filters & KPI Cards
At the top, you will find:
-
Month Slicer – Select any month of the year
-
KPI Group Slicer – Filter metrics based on categories
After choosing filters, the dashboard updates instantly.
You will also see three KPI cards:
-
Total KPI Count
-
MTD Target Meet Count
-
MTD Target Missed Count
These cards help you understand overall performance in seconds.
Detailed KPI Table
Below the cards, you get a detailed view of each KPI. This table includes:
-
KPI Number: The unique ID of the KPI
-
KPI Group: Content, Sales, Operations, Marketing, etc.
-
KPI Name: The name of the metric
-
Unit: Pages, %, USD, Count, etc.
-
Type: LTB (Lower the Better) or UTB (Upper the Better)
You also get complete MTD and YTD insights:
Current Year (CY) MTD & YTD
-
Actual CY MTD
-
Target CY MTD
-
MTD icon (▲ or ▼ with green/red color)
-
Target Vs Actual (MTD %)
-
Actual CY YTD
-
Target CY YTD
-
YTD Icon
-
Target Vs Actual (YTD %)
Previous Year (PY) Comparison
-
PY MTD
-
CY vs PY MTD (%)
-
PY YTD
-
CY vs PY YTD (%)
Because of these values, you can instantly check:
-
Whether the KPI meets its monthly and yearly targets
-
How performance changes compared to last year
-
Whether any KPI needs immediate attention
2. KPI Trend Page – Visual Trend Analysis
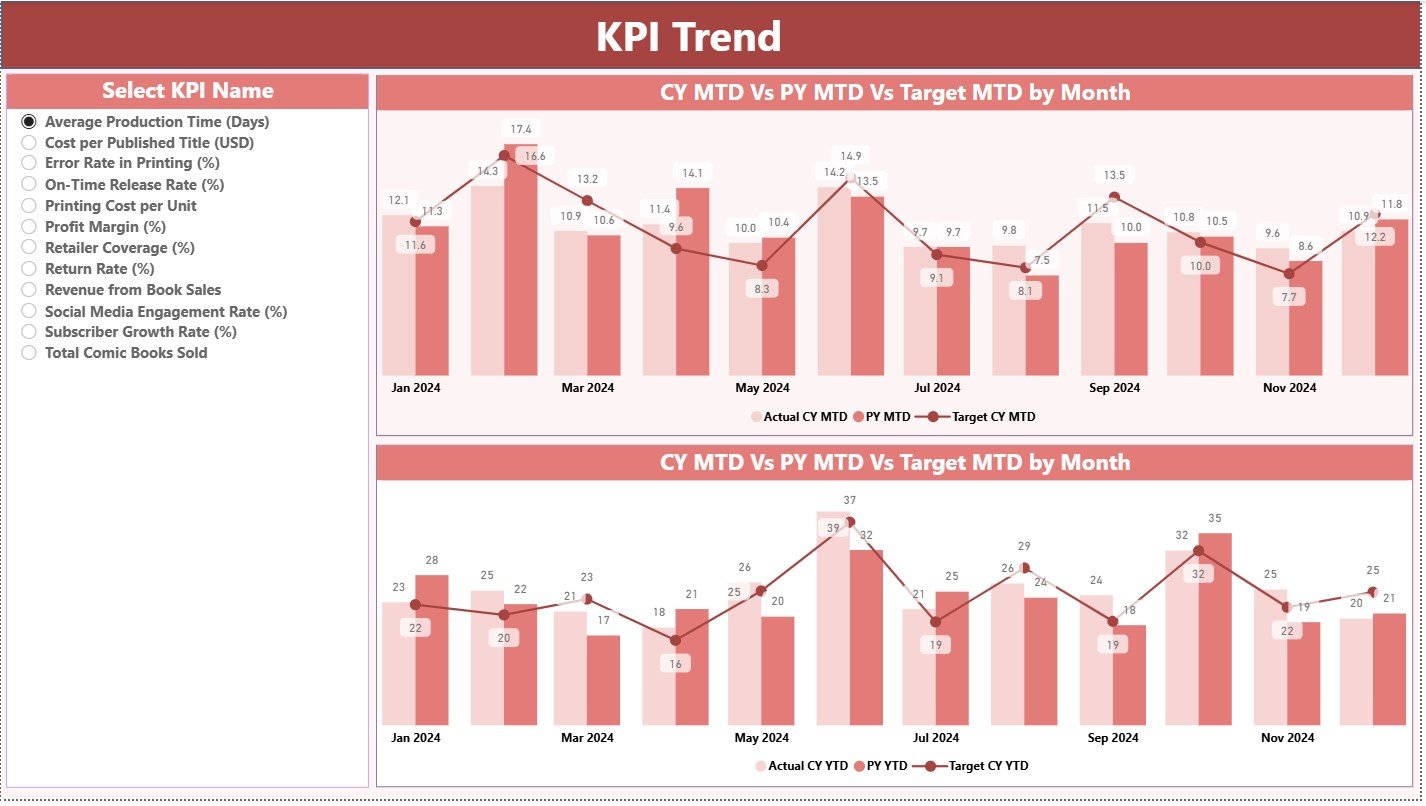
This page highlights the performance trends using two combo charts.
You can select any KPI through a slicer on the left and track:
✔ MTD Trends
Shows the Current Year MTD, Previous Year MTD, and Monthly Targets.
✔ YTD Trends
Tracks cumulative performance for both Current and Previous Years along with the target.
These visual insights help you:
-
Understand seasonal trends
-
Analyze performance patterns
-
Compare growth across years
-
Identify gaps in targets vs. actuals
Because both charts display lines and bars together, trend interpretation becomes easier and faster.
Click to Purchases Comic Books and Publishing KPI Dashboard in Power BI
3. KPI Definition Page – Drill-Through Reference Page
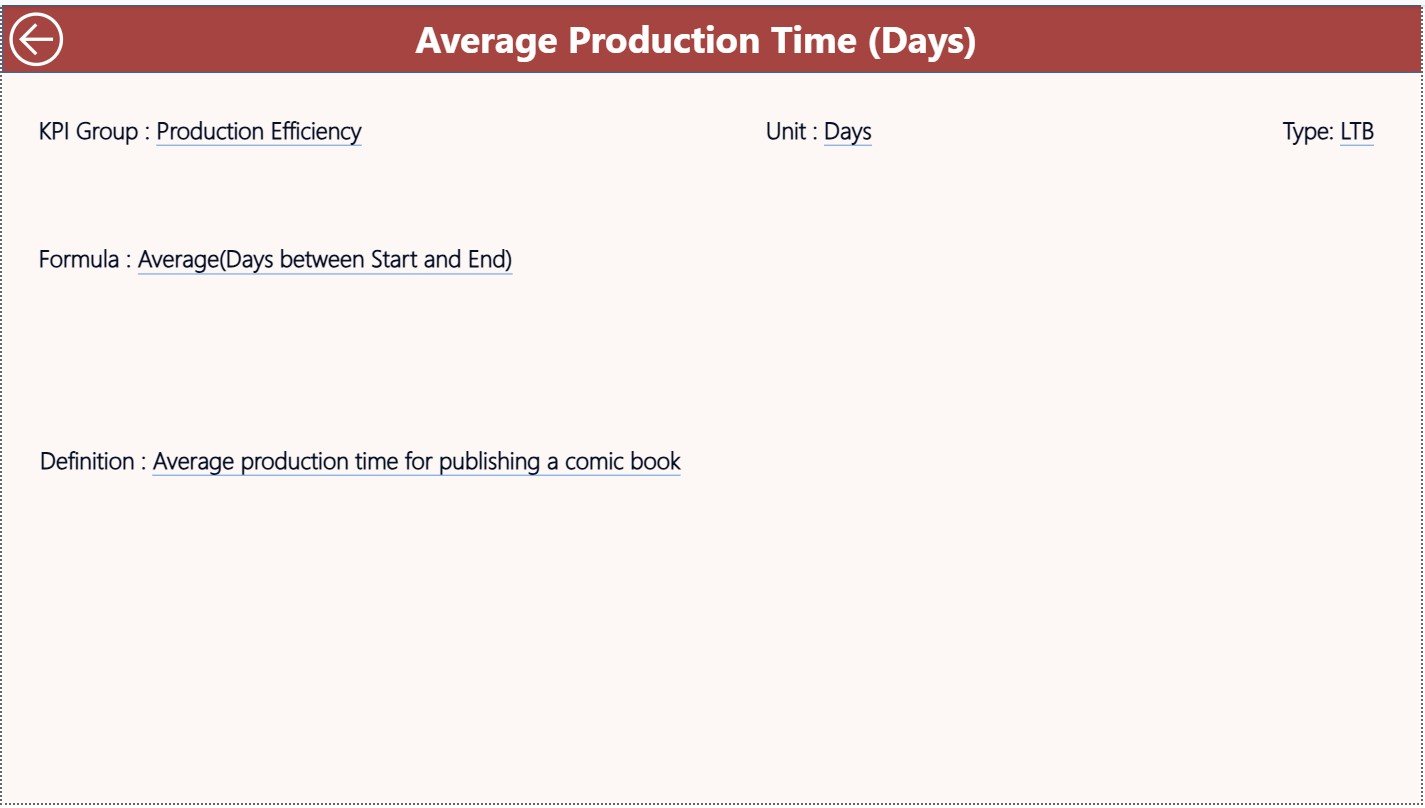
This page is hidden, and users access it through drill-through actions from the Summary Page.
It displays:
-
KPI Number
-
KPI Group
-
KPI Name
-
Unit
-
Formula
-
KPI Definition
-
Type (LTB / UTB)
This page acts like a reference library for all KPIs. Whenever you need clarity on a KPI, simply right-click and drill through to view details. You can return to the main dashboard using the back button at the top-left corner.
How the Excel Data Source Works
The dashboard uses an Excel file with three worksheets:
1. Input_Actual
Here you enter:
-
KPI Name
-
Month (use the first date of the month)
-
Actual MTD
-
Actual YTD
2. Input_Target
Here you fill:
-
KPI Name
-
Month (first date of month)
-
Target MTD
-
Target YTD
3. KPI Definition
This sheet includes:
-
KPI Number
-
KPI Group
-
KPI Name
-
Unit
-
Formula
-
Definition
-
KPI Type (LTB/UTB)
Because the dashboard reads directly from the Excel file, updating data is easy and effortless.
Click to Purchases Comic Books and Publishing KPI Dashboard in Power BI
What KPIs Can You Track in a Comic Books and Publishing Dashboard?
You can track many important KPIs, such as:
-
Story Completion Rate
-
Artwork Completion Rate
-
Pages Created (MTD/YTD)
-
Editing Cycle Time
-
Printing Lead Time
-
Distribution Time
-
Marketing Spend Efficiency
-
Sales Revenue
-
Customer Engagement Rate
-
Subscription Growth
-
Target vs. Actual Performance
These KPIs help improve every stage of publishing, from story creation to sales performance.
Advantages of Using a Comic Books and Publishing KPI Dashboard in Power BI
1. Better Visibility
You can track all key metrics on one screen without checking multiple spreadsheets.
2. Faster Decision-Making
Because data updates instantly, you take decisions quickly and confidently.
3. Improved Production Planning
Teams can monitor story progress, editing time, artwork load, and printing schedules.
4. Strong Sales Insight
You can compare sales targets vs. actuals and check YTD progress.
5. Easy Trend Tracking
Combo charts help identify seasonal growth, opportunities, and challenges.
6. Better Team Coordination
Writers, editors, artists, and marketing teams stay aligned through shared KPIs.
7. Historical Comparison
You can compare performance with the previous year to understand real growth.
Best Practices for Using the Publishing KPI Dashboard
1. Update Data Every Month
Always update the Excel file at the start or end of each month.
2. Use Consistent KPI Naming
Keep names clear so users understand each metric easily.
3. Review Target Settings
Set realistic monthly and yearly targets based on past data.
4. Focus on Both MTD and YTD
Always check short-term and long-term performance.
5. Use Drill-Through When Needed
Use the KPI definition page to understand the meaning of each KPI.
6. Share the Dashboard With Your Team
Let writers, editors, artists, and marketing teams view the dashboard.
7. Review Trends Before Planning
Use trend charts while planning new releases or campaigns.
Click to Purchases Comic Books and Publishing KPI Dashboard in Power BI
Who Should Use This Dashboard?
This dashboard is useful for:
-
Comic Book Publishers
-
Independent Creators
-
Story Writers
-
Editors
-
Designers & Artists
-
Marketing Teams
-
Distribution Managers
-
Sales Teams
-
Production Heads
Because it covers end-to-end KPIs, all stakeholders benefit from real-time insights.
How to Improve Publishing Performance Using KPIs
Here are some practical ways publishing teams can use this dashboard:
✔ Improve Story Workflow
Track story completion and editing cycles to reduce delays.
✔ Enhance Artwork Planning
Monitor artist workload and maintain a steady pace of illustration.
✔ Optimize Printing & Distribution
Use lead-time KPIs to avoid bottlenecks.
✔ Strengthen Marketing Efforts
Track campaign performance and spending effectiveness.
✔ Boost Sales Performance
Check revenue growth and compare targets across months and years.
Because these insights enhance planning, your publishing operations become smoother and more efficient.
Conclusion
The Comic Books and Publishing KPI Dashboard in Power BI is a powerful tool for publishers and comic creators who want clear insights, strong planning, and better performance tracking. Since it uses Excel as the data source, updating information is simple and quick. With detailed KPIs, trend charts, drill-through actions, and yearly comparisons, this dashboard supports smarter decisions and faster workflow improvements.
Whether you manage a small comic team or a large publishing house, this dashboard gives you the clarity you need in today’s fast-moving creative industry.
Click to Purchases Comic Books and Publishing KPI Dashboard in Power BI
Frequently Asked Questions (FAQs)
1. What is a Comic Books and Publishing KPI Dashboard?
It is a Power BI dashboard that tracks key metrics for story creation, artwork, publishing, marketing, and sales performance using interactive visuals.
2. What data source does the dashboard use?
It uses an Excel file with three worksheets: Input_Actual, Input_Target, and KPI Definition.
3. Can I customize the KPIs?
Yes, you can add, modify, or remove KPIs directly in the Excel file.
4. Can I drill through to see more KPI details?
Yes, you can drill through from the Summary Page to view the KPI definition and formula.
5. Do I need advanced Power BI skills to use this dashboard?
No. This dashboard is easy to use, even for beginners.
6. Can this dashboard track both MTD and YTD performance?
Yes, it tracks Monthly-To-Date and Year-To-Date performance with icons, percentages, and comparisons.
7. Who can use this dashboard?
Publishers, writers, editors, artists, marketers, and production managers can use this dashboard.
8. How often should I update the Excel data?
You should update it every month for the most accurate insights.
Click to Purchases Comic Books and Publishing KPI Dashboard in Power BI
Visit our YouTube channel to learn step-by-step video tutorials