In today’s highly regulated business environment, compliance is no longer optional. Instead, organizations must continuously track, monitor, and improve compliance performance across departments, processes, and regulations. However, many businesses still rely on scattered Excel files, emails, or manual reports. As a result, visibility drops, risks increase, and decision-making slows down.
That is exactly where a Compliance Monitoring KPI Dashboard in Excel becomes a game-changer.
A Compliance Monitoring KPI Dashboard in Excel helps organizations track critical compliance metrics in one centralized, visual, and interactive platform. Moreover, it enables management teams to identify risks early, measure performance accurately, and ensure regulatory adherence without complex software or high costs.
In this detailed guide, you will learn what a Compliance Monitoring KPI Dashboard in Excel is, how it works, its key features, advantages, best practices, and how organizations can use it effectively for better governance and control.
Click to buy Compliance Monitoring KPI Dashboard in Excel
What Is a Compliance Monitoring KPI Dashboard in Excel?
A Compliance Monitoring KPI Dashboard in Excel is a ready-to-use analytical template designed to monitor compliance-related key performance indicators using Microsoft Excel.
Instead of working with multiple disconnected files, this dashboard consolidates all compliance data into structured worksheets, dynamic visuals, and automated calculations. As a result, compliance officers, risk managers, auditors, and leadership teams can easily track performance at both monthly and yearly levels.
Furthermore, because it is built in Excel, it remains flexible, familiar, and easy to customize for different compliance frameworks, such as:
- Regulatory compliance
- Internal policy compliance
- Audit compliance
- Operational compliance
- Risk and governance monitoring
Why Is Compliance Monitoring Important for Organizations?
Compliance monitoring protects organizations from legal penalties, financial losses, and reputational damage. More importantly, it creates a culture of accountability and transparency.
Without proper monitoring:
- Compliance gaps remain unnoticed
- Risks escalate silently
- Audits become stressful
- Reporting becomes time-consuming
However, with a Compliance Monitoring KPI Dashboard in Excel:
- Compliance issues surface early
- Performance becomes measurable
- Trends become visible
- Management decisions improve
How Does a Compliance Monitoring KPI Dashboard in Excel Work?
The dashboard works by combining structured input sheets with automated calculations and interactive visuals. Users simply enter actual, target, and previous year values. After that, the dashboard instantly reflects performance using KPIs, trends, and indicators.
Because the entire system runs inside Excel, users can easily:
- Update data monthly
- Add new KPIs
- Customize metrics
- Share reports securely
What Are the Key Features of the Compliance Monitoring KPI Dashboard in Excel?
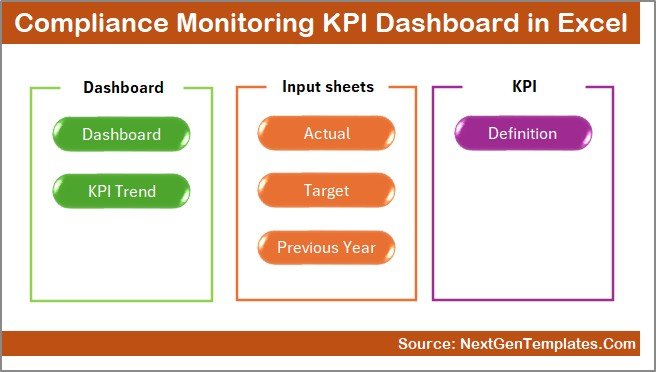
This Compliance Monitoring KPI Dashboard in Excel consists of 7 well-structured worksheets, each designed for a specific purpose.
Let’s explore them one by one.
Summary Page – How Does the Index Page Improve Navigation?
The Summary Page acts as an index and navigation hub for the entire dashboard.
Key Highlights of the Summary Page:
- Provides 6 navigation buttons
- Allows instant access to key worksheets
- Improves usability and user experience
- Saves time by eliminating manual scrolling
As a result, even non-technical users can navigate the dashboard effortlessly.
Click to buy Compliance Monitoring KPI Dashboard in Excel
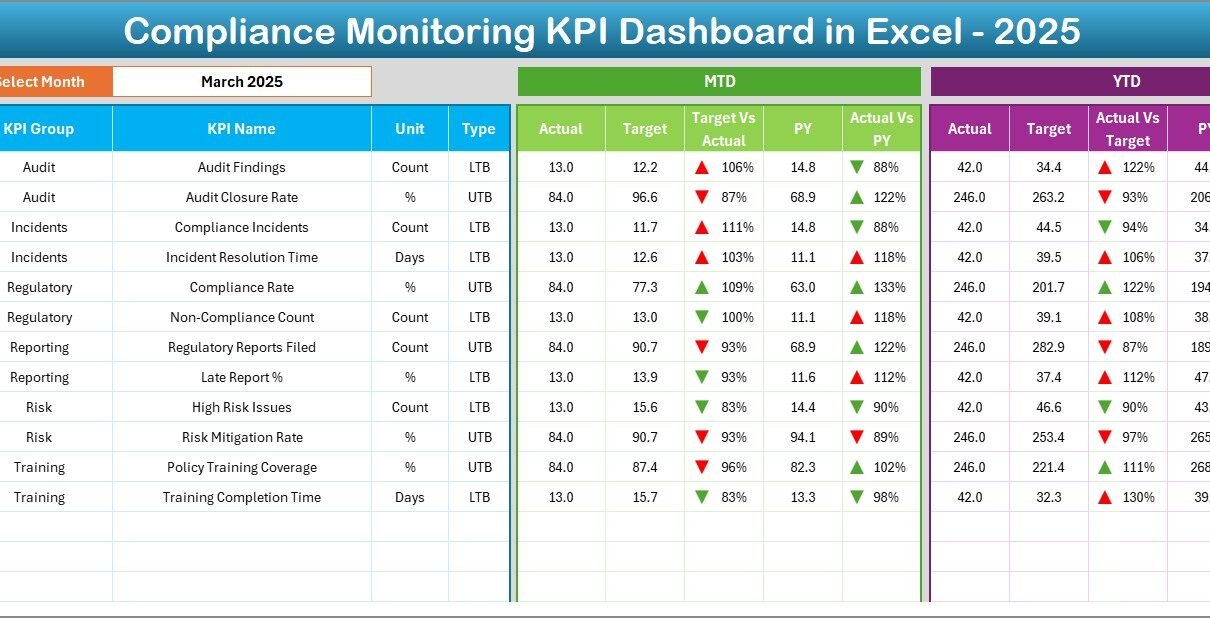
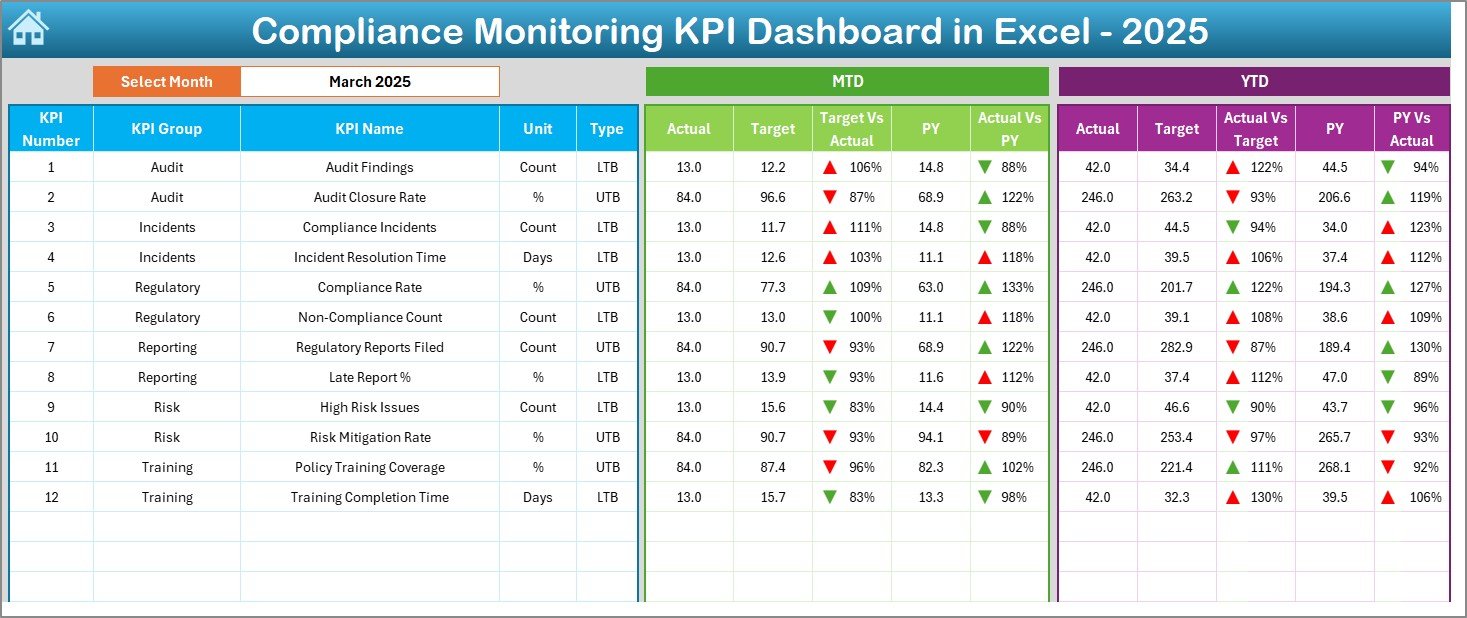
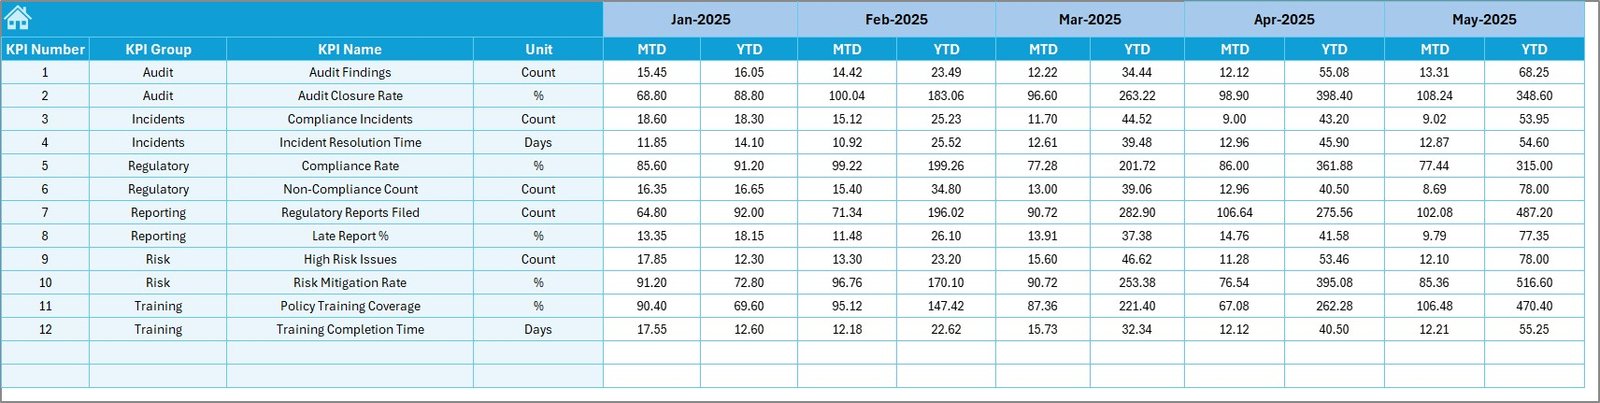
Dashboard Sheet – How Does the Main Dashboard Display KPI Performance?
The Dashboard Sheet is the heart of the Compliance Monitoring KPI Dashboard in Excel.
Here, users can view all KPI performance metrics in one place.
Key Functionalities of the Dashboard Sheet:
- Month selection using a drop-down in cell D3
- Automatic update of all KPI values based on selected month
- Displays both MTD (Month-to-Date) and YTD (Year-to-Date) performance
KPIs Displayed on the Dashboard:
- MTD Actual
- MTD Target
- MTD Previous Year
- Target vs Actual comparison
- Previous Year vs Actual comparison
The same structure applies to YTD values as well.
Visual Enhancements:
- Conditional formatting with up and down arrows
- Clear performance indicators
- Easy comparison across time periods
Therefore, decision-makers can quickly identify compliance gaps and achievements.
Click to buy Compliance Monitoring KPI Dashboard in Excel
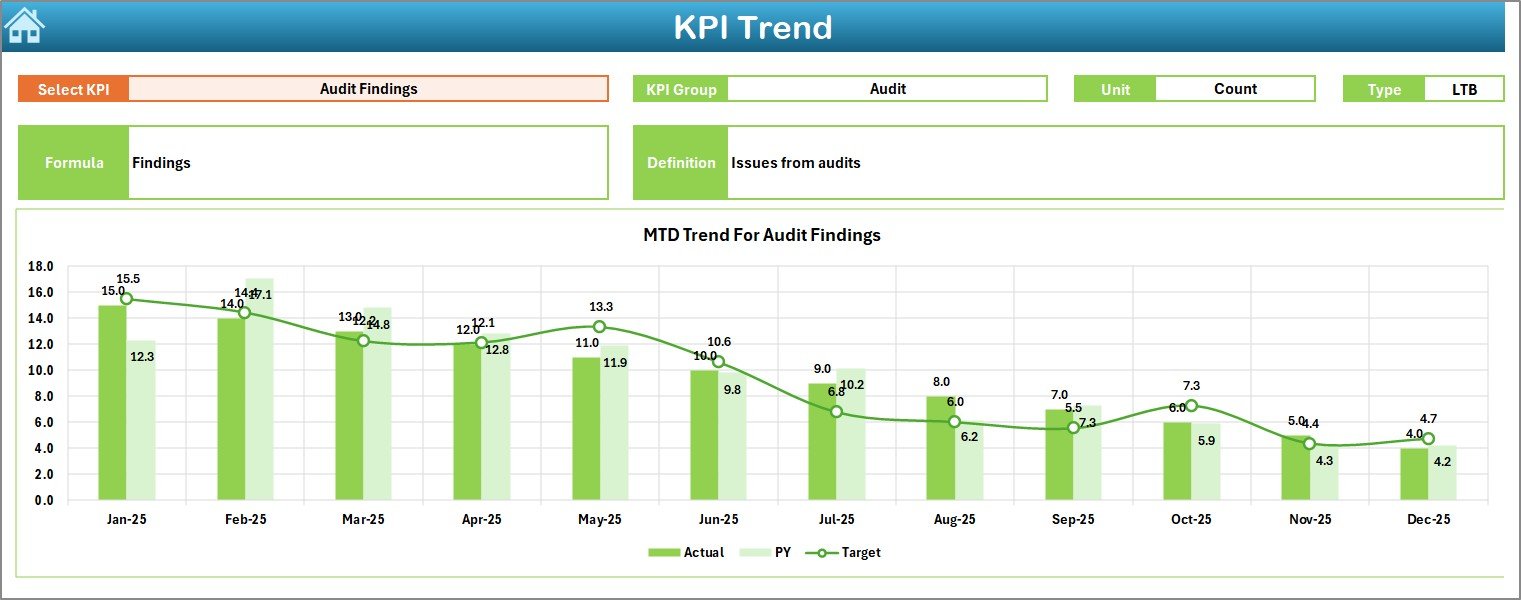
Trend Sheet – How Can You Analyze KPI Trends Over Time?
The Trend Sheet provides deep insights into individual KPI behavior over time.
How the Trend Sheet Works:
- Select the KPI name from a drop-down in cell C3
- Automatically displays:
KPI Group
Unit of Measurement
KPI Type (Lower the Better or Upper the Better)
KPI Formula
KPI Definition
Trend Analysis Features:
- MTD trend chart for:
Actual
Target
Previous Year
YTD trend chart for:
Actual
Target
Previous Year
Because of this structure, users can easily spot performance fluctuations, seasonal patterns, and improvement areas.
Click to buy Compliance Monitoring KPI Dashboard in Excel
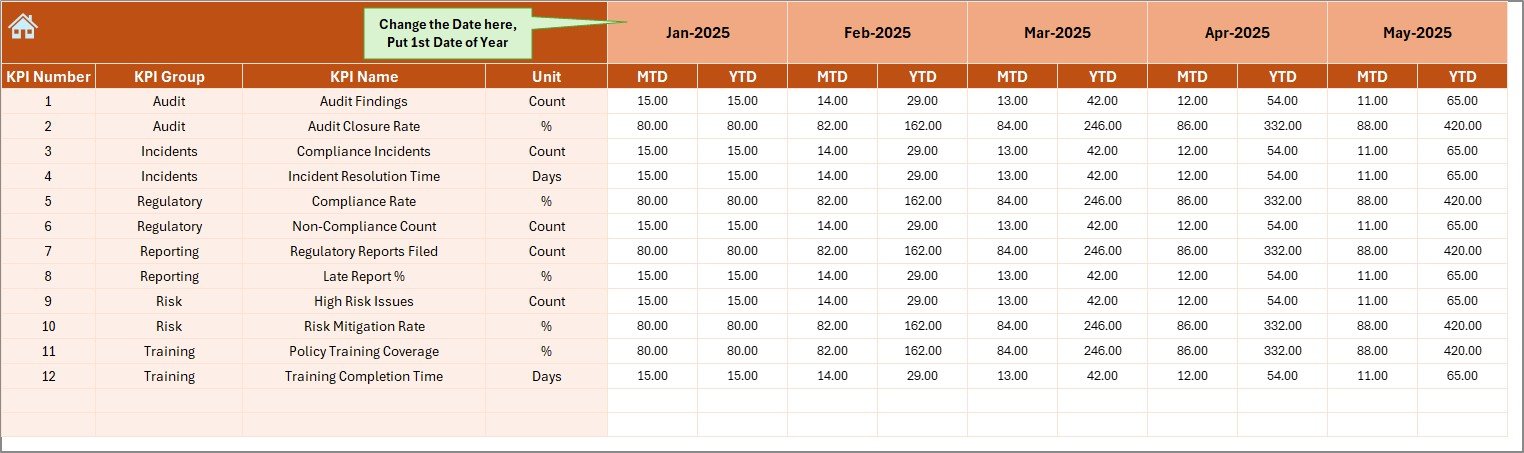
Actual Numbers Input Sheet – How Do You Enter Compliance Data?
The Actual Numbers Input Sheet serves as the primary data entry point for actual compliance performance.
Key Inputs:
- Enter MTD and YTD actual values
- Select the starting month of the year in cell E1
- Update monthly data easily without breaking formulas
This sheet ensures data consistency while keeping input simple and structured.
Click to buy Compliance Monitoring KPI Dashboard in Excel
Target Sheet – How Are Compliance Targets Managed?
The Target Sheet allows organizations to define compliance goals clearly.
What You Can Do in This Sheet:
- Enter monthly MTD targets for each KPI
- Enter YTD targets for long-term monitoring
- Align targets with regulatory or internal standards
By doing this, organizations ensure that compliance goals remain measurable and realistic.
Click to buy Compliance Monitoring KPI Dashboard in Excel
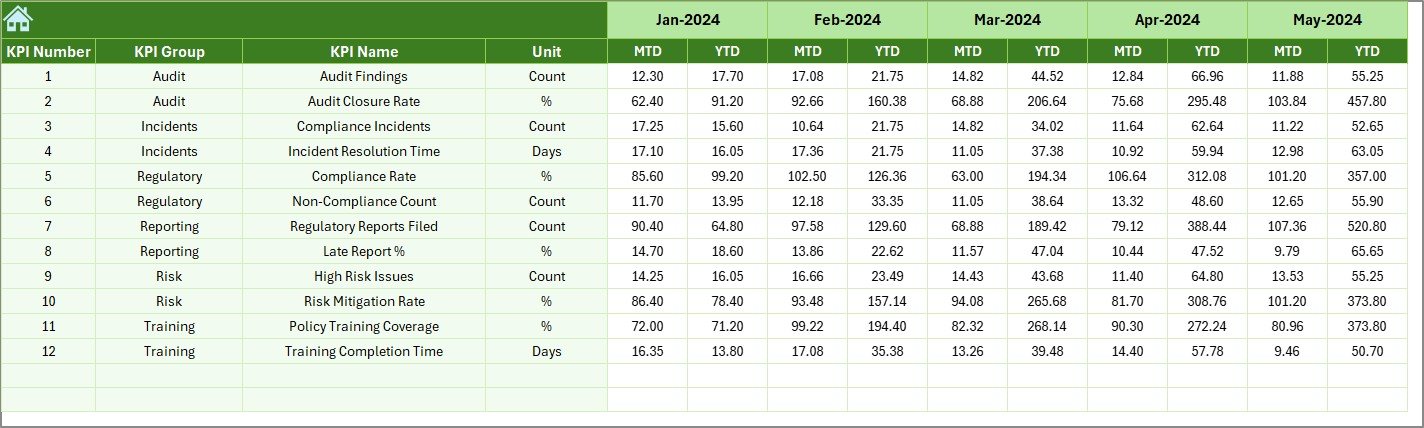
Previous Year Numbers Sheet – Why Is Year-Over-Year Comparison Important?
The Previous Year Numbers Sheet stores historical compliance data.
Benefits of This Sheet:
- Enables year-over-year analysis
- Helps measure improvement or decline
- Supports audit and reporting needs
Moreover, comparing current performance with past data helps organizations understand long-term compliance trends.
Click to buy Compliance Monitoring KPI Dashboard in Excel
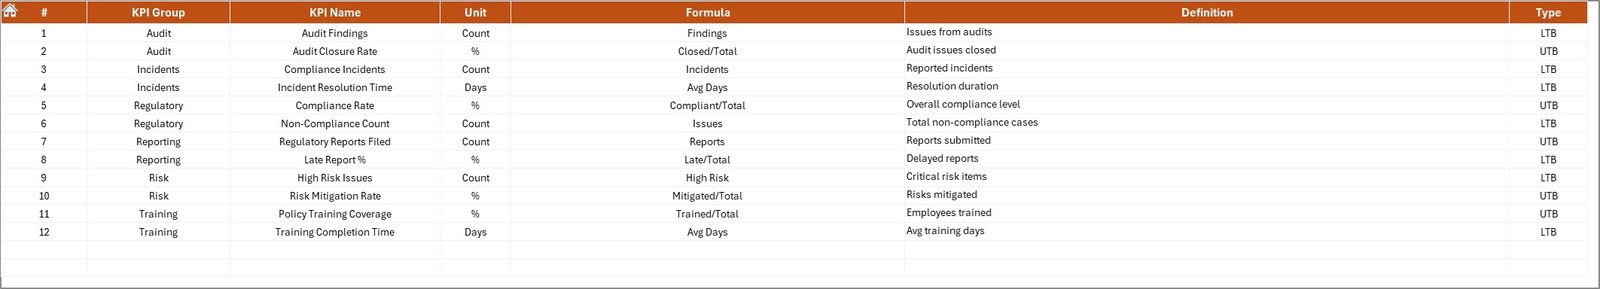
KPI Definition Sheet – How Does It Improve KPI Clarity?
The KPI Definition Sheet acts as a reference guide for all compliance KPIs.
Information Captured in This Sheet:
- KPI Name
- KPI Group
- Unit of Measurement
- KPI Formula
- KPI Definition
As a result, all stakeholders interpret KPIs consistently, which reduces confusion and reporting errors.
Click to buy Compliance Monitoring KPI Dashboard in Excel
What Types of KPIs Can Be Tracked Using This Dashboard?
A Compliance Monitoring KPI Dashboard in Excel can track various compliance-related metrics, such as:
- Audit completion rate
- Policy adherence rate
- Regulatory breach count
- Risk assessment completion
- Incident resolution time
- Training compliance percentage
- Documentation accuracy rate
Because the dashboard is flexible, organizations can easily add or modify KPIs as needed.
Advantages of Compliance Monitoring KPI Dashboard in Excel
Using a Compliance Monitoring KPI Dashboard in Excel offers several strong advantages.
Key Advantages:
- Centralized compliance monitoring
- Faster decision-making
- Improved visibility into risks
- Easy trend and variance analysis
- No additional software required
- Fully customizable structure
- Secure and controlled access
Most importantly, it helps organizations stay compliant without complexity.
Best Practices for the Compliance Monitoring KPI Dashboard in Excel
To get maximum value from the dashboard, organizations should follow proven best practices.
Recommended Best Practices:
- Define KPIs clearly before implementation
- Use consistent units and formulas
- Update data on a fixed schedule
- Review trends regularly, not just numbers
- Align targets with regulatory requirements
- Maintain accurate historical data
- Train users on proper data entry
By following these practices, the dashboard remains reliable and effective.
Who Should Use a Compliance Monitoring KPI Dashboard in Excel?
This dashboard suits a wide range of users, including:
- Compliance officers
- Risk management teams
- Internal auditors
- Legal departments
- Operations managers
- Senior leadership teams
Because it uses Excel, both technical and non-technical users can work with it comfortably.
How Does This Dashboard Improve Audit Readiness?
Audit preparation often consumes significant time and effort. However, this dashboard simplifies the process.
Audit Benefits:
- Provides structured compliance data
- Maintains historical records
- Highlights gaps before audits
- Supports evidence-based reporting
As a result, audits become smoother and less stressful.
Can the Compliance Monitoring KPI Dashboard in Excel Be Customized?
Yes, customization is one of its biggest strengths.
Organizations can:
- Add new KPIs
- Modify existing formulas
- Adjust targets
- Change visuals
- Adapt it to specific regulations
Therefore, the dashboard grows with your compliance needs.
Conclusion: Why Should You Use a Compliance Monitoring KPI Dashboard in Excel?
A Compliance Monitoring KPI Dashboard in Excel offers a powerful yet simple solution for tracking compliance performance. It centralizes data, enhances visibility, supports decision-making, and improves accountability.
Instead of juggling multiple files or investing in expensive tools, organizations can rely on this structured Excel dashboard to stay compliant, reduce risks, and maintain control.
In short, it transforms compliance monitoring from a reactive task into a proactive strategy.
Frequently Asked Questions (FAQs)
What is a Compliance Monitoring KPI Dashboard in Excel?
It is an Excel-based dashboard that tracks compliance KPIs using structured data, visuals, and automated calculations.
Who can use this dashboard?
Compliance officers, auditors, managers, and leadership teams can use it effectively.
Can I add new KPIs to the dashboard?
Yes, the dashboard is fully customizable and allows you to add or modify KPIs easily.
Does this dashboard support trend analysis?
Yes, it includes MTD and YTD trend charts for Actual, Target, and Previous Year values.
Is Excel sufficient for compliance monitoring?
Yes, when designed properly, Excel provides flexibility, control, and powerful analysis capabilities.
Visit our YouTube channel to learn step-by-step video tutorials
Watch the step-by-step video tutorial:
Click to buy Compliance Monitoring KPI Dashboard in Excel