Every organization—whether in finance, healthcare, IT, or manufacturing—must adhere to internal and external compliance standards. However, managing compliance data manually often leads to inconsistencies, missed deadlines, and overlooked gaps.
That’s where a Compliance Report in Excel becomes an essential tool.
This ready-to-use Excel-based report helps compliance officers, auditors, and managers track the status of various checks, analyze compliance trends, and ensure all business areas follow the required policies.
In this comprehensive article, we will explore everything you need to know about a Compliance Report in Excel—its structure, key features, advantages, and best practices to get the most out of it.
Click to Purchases Compliance Report in Excel
What Is a Compliance Report in Excel?
A Compliance Report in Excel is a structured reporting tool that helps you monitor compliance performance across different departments, regions, or business units.
It uses data visualization, slicers, and automated formulas to summarize compliance checks, pending reviews, and audit performance. The report gives users a clear picture of compliance status and risk exposure—without the need for complex software.
Instead of manually combining multiple spreadsheets, the Compliance Report consolidates all key data points in one dashboard, allowing for quick analysis and better decision-making.
Why Use a Compliance Report in Excel?
Organizations deal with hundreds of compliance checkpoints—covering internal audits, IT security, data privacy, financial standards, or regulatory requirements.
Tracking these manually is time-consuming and error-prone. The Compliance Report in Excel automates and visualizes this information, helping management teams stay informed and compliant at all times.
With Excel’s built-in formulas, pivot tables, and charts, you can easily:
-
Monitor compliance trends by month or department
-
Identify non-compliant areas instantly
-
Track completion and pending reviews
-
Present insights visually in team meetings
Key Features of the Compliance Report in Excel
This ready-to-use Compliance Report template is built with 3 major pages and one supporting sheet, each designed for specific analysis needs.
Let’s explore each page in detail 👇
Click to Purchases Compliance Report in Excel
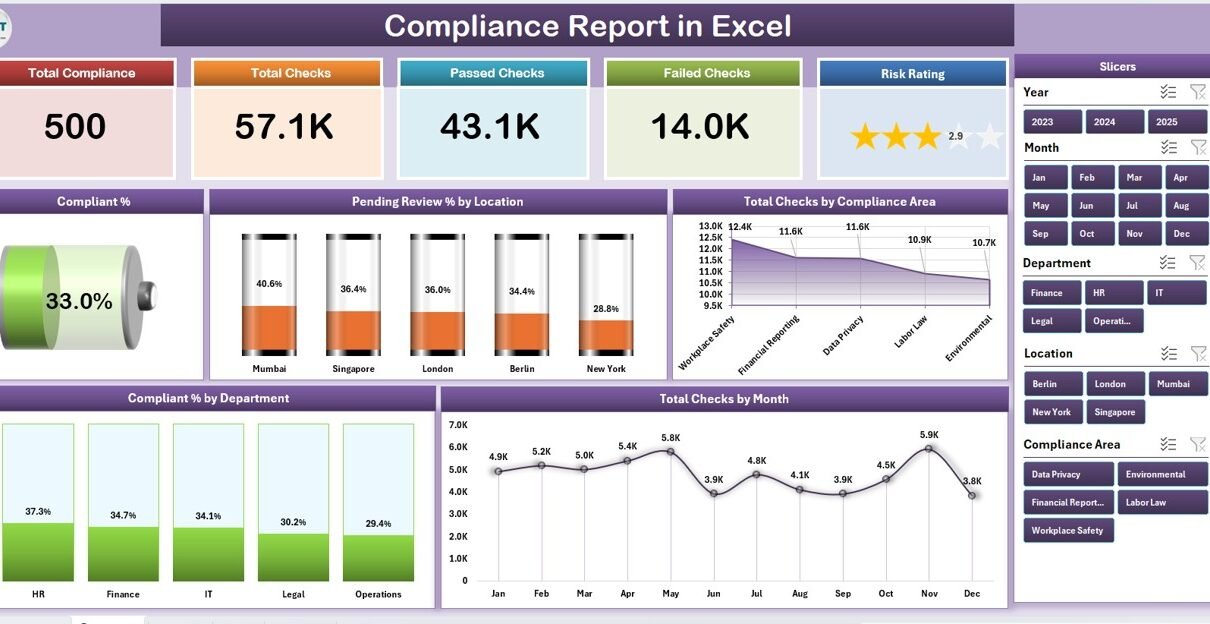
1. Summary Page
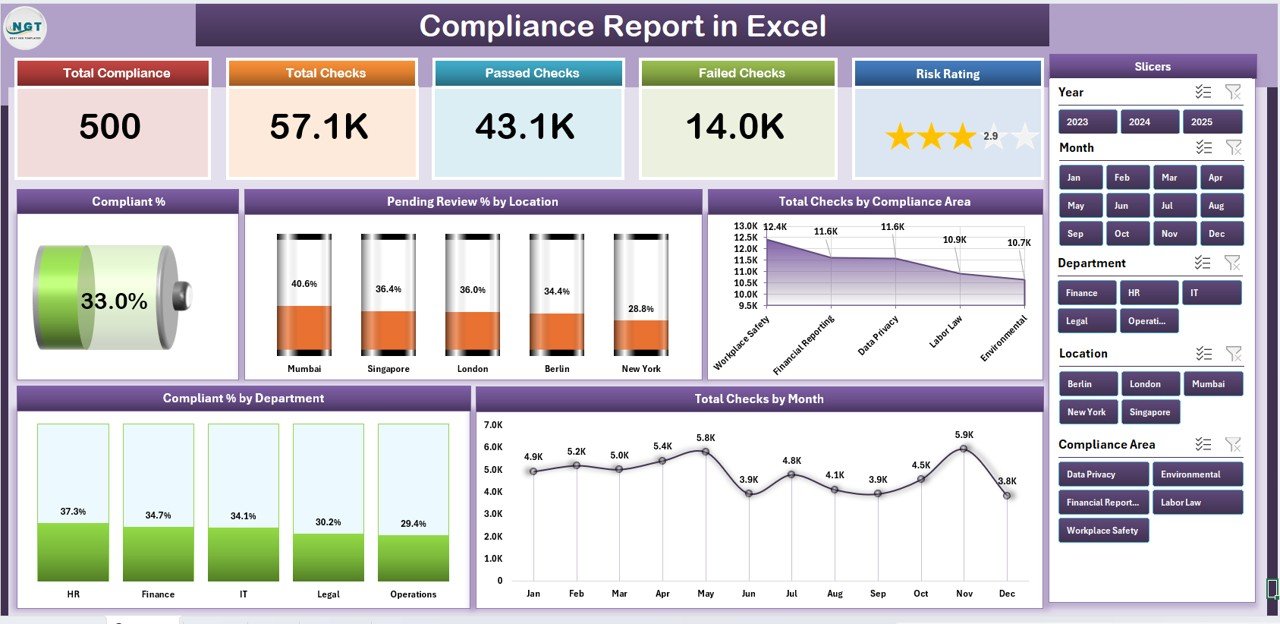
This is the main dashboard page and serves as the first point of reference for decision-makers.
Main Highlights:
-
🧾 Top 5 KPI Cards: Displays metrics like total checks, compliant percentage, pending reviews, and other summary indicators.
-
📊 Interactive Slicer (Right-Side): Helps filter results by location, department, or compliance area.
📈 Visual Charts: Includes five key charts that display overall performance:
- Compliant %
- Pending Review % by Location
- Total Checks by Compliance Area
- Compliant % by Department
- Total Checks by Month
This page provides a bird’s-eye view of the compliance status for the entire organization.
2. Report Page
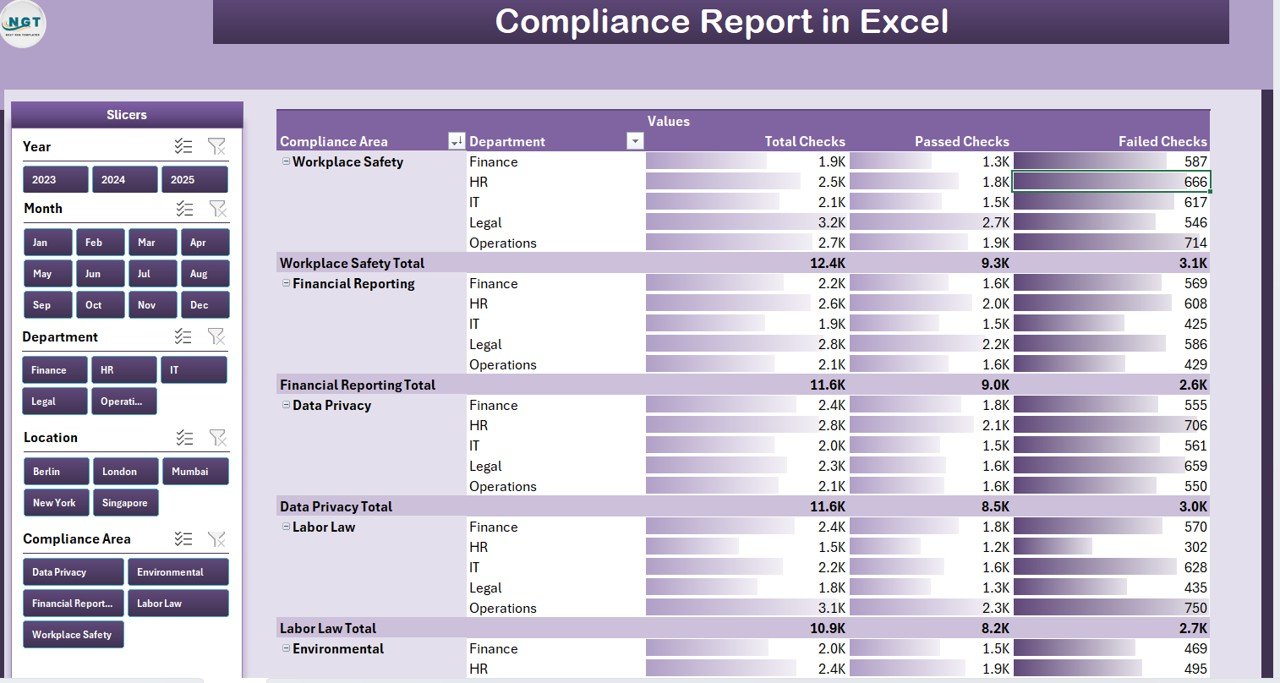
This is the detailed analysis page where users can explore data in depth.
Features include:
-
🧩 Left-Side Slicer: Enables filtering by time period, department, or compliance area.
-
📋 Information Table: Displays itemized records with columns such as Check ID, Department, Compliance Status, Reviewer, and Review Date.
-
🔍 Drill-Down Capability: Allows users to analyze specific issues or pending cases easily.
This page helps managers pinpoint non-compliant areas and track review progress in real time.
3. Data Sheet
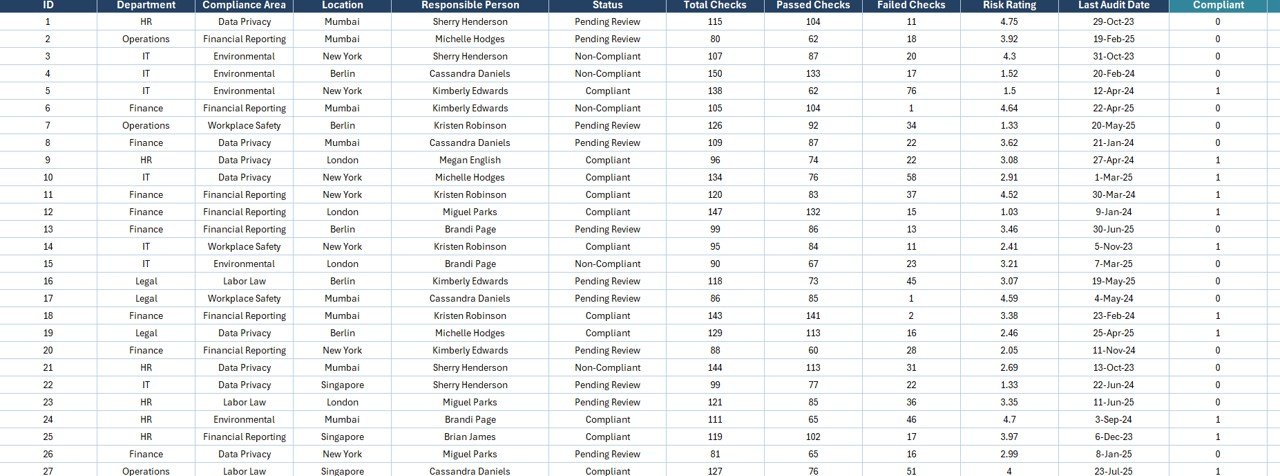
This is the engine of the report. It contains the raw data that powers all calculations and charts.
It typically includes:
-
Compliance ID or Code
-
Department Name
-
Compliance Area
-
Status (Compliant, Non-Compliant, Pending Review)
-
Reviewer Name
-
Review Date
-
Comments or Remarks
The data is structured in a pivot-friendly format to ensure smooth updates and accurate results.
4. Support Sheet
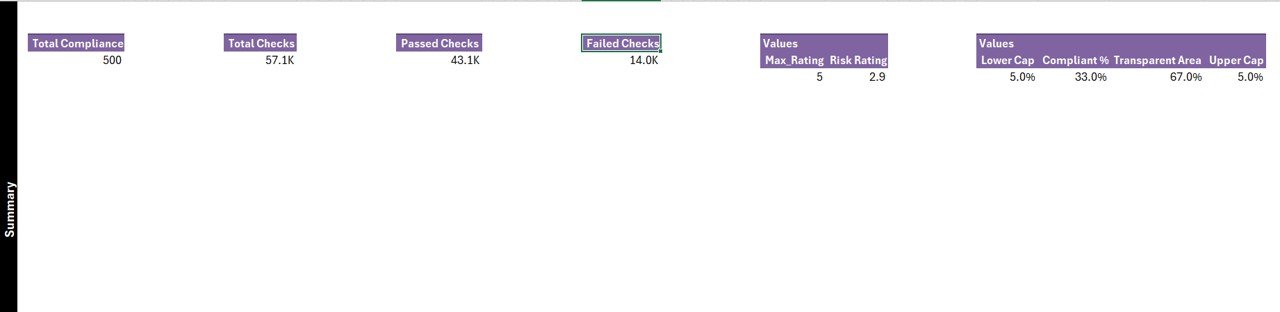
The Support Sheet contains predefined lists, lookup values, and configurations used in slicers and dropdowns.
Examples include:
-
Department lists
-
Compliance areas
-
Status categories (Compliant / Pending / Non-Compliant)
This helps maintain consistency and avoid data entry errors across the report.
How to Use the Compliance Report in Excel
Follow these simple steps to make the most out of this tool:
-
Input or Import Data:
Enter your compliance records in the Data Sheet. Ensure columns match the provided structure. -
Refresh Pivot Tables:
Once data is updated, refresh all pivot tables and charts to see the latest metrics. -
Use Slicers for Filtering:
Apply slicers on the Summary or Report Page to filter results by department, location, or compliance area. -
Analyze KPIs and Charts:
Check the compliance percentage, review pending cases, and identify improvement areas. -
Share or Present:
The visual charts and summary cards make this report presentation-ready for management reviews.
Advantages of Using a Compliance Report in Excel
A well-designed Compliance Report not only saves time but also improves decision-making.
Here are the top benefits:
✅ 1. Real-Time Insights
Get instant visibility into compliance status across all departments and regions.
✅ 2. Improved Accuracy
Automated formulas and pivot tables reduce manual calculation errors.
✅ 3. Easy Customization
You can easily modify charts, filters, and fields as per your organizational structure.
✅ 4. Better Communication
Visual reports make it easier to share compliance performance with leadership teams.
✅ 5. Cost-Effective Solution
Unlike expensive compliance software, Excel-based templates are affordable and flexible.
✅ 6. Centralized Data Management
All compliance data resides in one structured file, eliminating scattered spreadsheets.
How the Compliance Report Supports Decision-Making
This Excel tool helps leaders make data-driven decisions by:
-
Identifying high-risk areas that require immediate attention
-
Analyzing trends to forecast future compliance performance
-
Comparing department-level or regional performance
-
Prioritizing reviews and audits based on compliance scores
By visualizing compliance in one dashboard, decision-makers can proactively implement corrective actions and maintain accountability.
Best Practices for the Compliance Report in Excel
Click to Purchases Compliance Report in Excel
To ensure accuracy and usability, follow these best practices while using your compliance report:
🧩 1. Keep Data Updated Regularly
Refresh and review compliance records frequently to ensure reports reflect the latest status.
📈 2. Maintain Data Consistency
Use the Support Sheet for all dropdown lists and avoid free-text entries.
🕒 3. Automate Where Possible
Use Excel formulas, macros, or pivot refresh automation to save time.
🎯 4. Visualize the Right KPIs
Don’t overload your dashboard—focus on the metrics that matter most (e.g., Compliant %, Pending %, Total Checks).
🧠 5. Validate Before Reporting
Always cross-check the numbers before sharing the report with management or auditors.
💡 6. Secure Sensitive Data
Since compliance data may contain confidential information, apply Excel protection or restrict access to authorized users only.
Who Can Use the Compliance Report in Excel?
This report is ideal for:
-
Compliance Managers – to monitor adherence to regulations.
-
Auditors – to review and validate internal controls.
-
IT Teams – to track cybersecurity compliance.
-
HR Departments – to ensure policy compliance and training completion.
-
Operations Teams – to maintain quality and safety standards.
Essentially, any department that deals with compliance checks can use this report effectively.
How to Customize the Report for Your Organization
You can easily tailor the report based on your internal requirements:
-
Add new compliance areas (e.g., Financial, Environmental, IT).
-
Include additional KPIs such as “Overdue Checks” or “High-Risk Violations.”
-
Change chart types to highlight specific patterns (e.g., line charts for trends, bar charts for department performance).
-
Add slicers for regions or compliance officers.
Excel’s flexibility allows you to design a compliance system that aligns perfectly with your organizational workflow.
Tips for Effective Compliance Management
Along with using the Excel report, follow these strategies to maintain a strong compliance culture:
-
Conduct periodic internal audits
-
Set clear compliance ownership for each department
-
Provide staff training and awareness sessions
-
Automate reminders for upcoming checks or deadlines
-
Regularly update compliance policies as regulations evolve
A proactive approach ensures not only accurate reporting but also long-term compliance sustainability.
Conclusion
A Compliance Report in Excel offers a simple yet powerful way to track, analyze, and improve compliance performance. It turns complex regulatory data into visual insights—helping businesses stay compliant, transparent, and efficient.
With structured pages like the Summary, Report, and Data Sheet, this tool empowers teams to monitor compliance health at every level. Whether you’re an auditor, compliance officer, or operations head, this Excel-based report helps you make informed, data-driven decisions—without relying on expensive tools.
Frequently Asked Questions (FAQs)
1. What is the purpose of a Compliance Report in Excel?
The purpose is to track and visualize compliance status across departments or business units. It helps identify gaps, pending reviews, and areas that need attention.
2. Can I use this report for different types of compliance checks?
Yes, the template is fully customizable. You can use it for IT compliance, HR compliance, data security checks, or any internal audit process.
3. How often should I update the data sheet?
Ideally, update the data sheet after every compliance review or monthly, depending on your audit frequency.
4. Can multiple users access this report?
Yes, you can share it as a shared Excel file or on cloud platforms like OneDrive or SharePoint, ensuring real-time collaboration.
5. What are the main benefits of using Excel for compliance reporting?
Excel provides flexibility, affordability, and powerful data visualization without needing specialized software.
6. Is the Compliance Report secure?
Yes, you can protect sheets with passwords, hide formulas, and limit editing access to safeguard sensitive compliance information.
Visit our YouTube channel to learn step-by-step video tutorials