The construction and real estate industry works in one of the most regulated environments. Every project, whether residential, commercial, or industrial, must follow strict compliance standards. Managing these regulations is not simple, as companies must monitor safety, labor laws, environmental policies, and financial regulations simultaneously.
A Construction and Real Estate Regulatory Adherence KPI Dashboard in Excel helps businesses stay compliant by tracking all critical key performance indicators (KPIs) in one place. Instead of juggling multiple spreadsheets or relying on manual reporting, this dashboard provides a structured and interactive platform to analyze regulatory adherence.
In this article, we will explore the features, benefits, best practices, and frequently asked questions about this dashboard. We will also explain how it can improve compliance tracking and decision-making for construction and real estate businesses.
Click to Purchases Construction and Real Estate Regulatory Adherence KPI Dashboard in Excel
What is a Regulatory Adherence KPI Dashboard?
A Regulatory Adherence KPI Dashboard is a performance monitoring tool that captures, analyzes, and visualizes compliance-related KPIs. In construction and real estate, this means tracking adherence to building codes, safety regulations, project approvals, environmental standards, and other compliance requirements.
The dashboard helps organizations:
-
Track month-to-date (MTD) and year-to-date (YTD) compliance metrics.
-
Compare actual performance against targets and previous year data.
-
Monitor compliance trends for better planning.
-
Identify areas of non-compliance before they escalate into legal or financial risks.
Key Features of the Construction and Real Estate Regulatory Adherence KPI Dashboard
This Excel-based dashboard includes 7 powerful worksheets, each designed to make compliance management efficient and accurate. Let us explore them in detail.
Home Sheet – Easy Navigation

The Home sheet acts as the index page. It provides quick access to all the main dashboard tabs. Users can simply click on any of the six navigation buttons to move to a desired sheet. This saves time and ensures smooth navigation across the workbook.
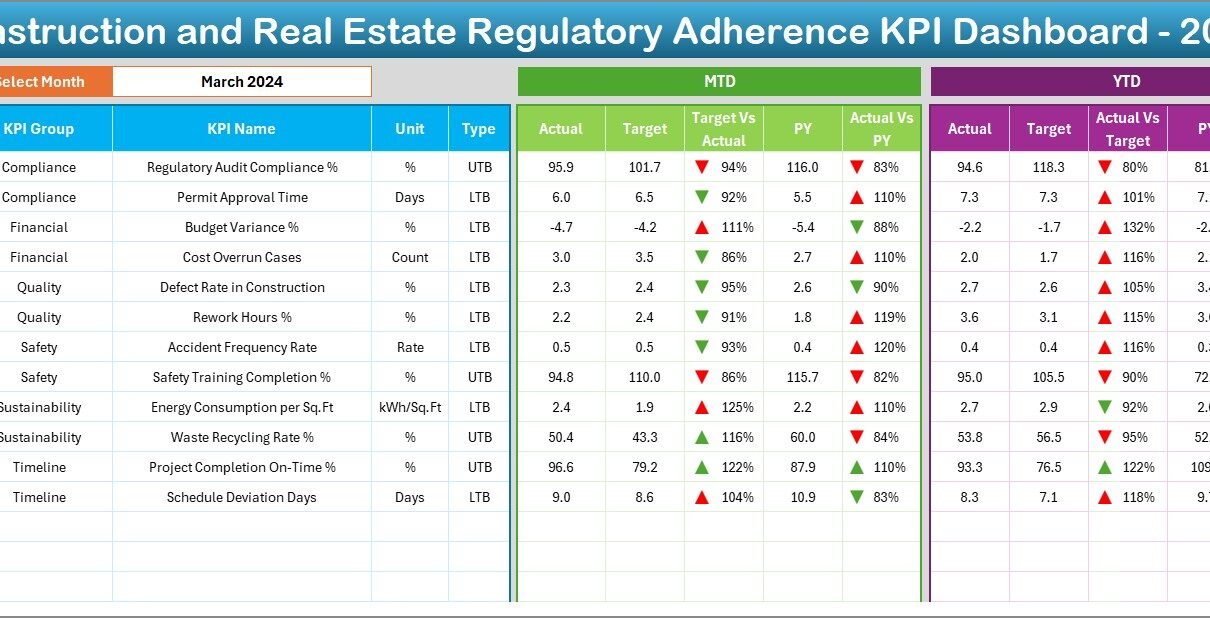
Dashboard Sheet – Main Compliance Overview

This is the central sheet of the dashboard. It consolidates all KPI data for quick decision-making.
-
You can select the reporting month from a drop-down in cell D3.
-
Once you select a month, the dashboard automatically updates MTD and YTD compliance numbers.
-
The dashboard compares Actual vs Target and Actual vs Previous Year using conditional formatting.
-
Green upward arrows show positive performance, while red downward arrows highlight compliance gaps.
This sheet allows compliance managers to see the big picture instantly.
KPI Trend Sheet – Performance Over Time

The KPI Trend sheet helps track compliance progress for each KPI.
-
Select any KPI from the drop-down menu (cell C3).
-
The sheet displays KPI Group, Unit, KPI Type (UTB – Upper the Better / LTB – Lower the Better), formula, and definition.
-
MTD and YTD trend charts provide a visual comparison of Actual, Target, and Previous Year performance.
This sheet is especially helpful for identifying whether compliance is improving or declining.
Click to Purchases Construction and Real Estate Regulatory Adherence KPI Dashboard in Excel
Actual Numbers Input Sheet – Data Entry for Current Year

This sheet is designed for entering the actual compliance numbers.
-
Enter both MTD and YTD figures for each month.
-
You can adjust the reporting year by updating the month in cell E1.
-
Once data is entered, all related sheets update automatically.
It reduces errors and keeps data entry structured.
Target Sheet – Compliance Benchmarks

The Target Sheet is where compliance managers set monthly and yearly targets for each KPI.
-
Both MTD and YTD targets can be defined.
-
These benchmarks provide a baseline for performance comparisons.
Setting targets ensures that compliance expectations remain clear and measurable.
Previous Year Number Sheet – Historical Data

This sheet stores previous year’s compliance data. It allows you to compare current performance with historical records.
-
Enter monthly data for the last financial or calendar year.
-
Helps identify recurring compliance issues or seasonal challenges.
Historical comparisons are crucial for long-term strategy and regulatory improvement.
KPI Definition Sheet – Compliance Dictionary

This sheet provides a reference guide for all KPIs.
-
Includes KPI Name, Group, Unit, Formula, and Definition.
-
Ensures that all users understand each KPI consistently.
-
Helps avoid misinterpretation across departments.
Why Do Construction and Real Estate Businesses Need This Dashboard?
Regulatory adherence is a non-negotiable priority in construction and real estate. Non-compliance can result in heavy penalties, project delays, or even legal action. This dashboard helps businesses:
-
Centralize compliance monitoring in one platform.
-
Ensure transparency by showing clear Actual vs Target comparisons.
-
Detect non-compliance early, reducing financial and reputational risks.
-
Streamline audits by maintaining a structured compliance record.
-
Support decision-making with real-time insights.
Advantages of the Construction and Real Estate Regulatory Adherence KPI Dashboard
Using this Excel-based KPI dashboard brings several benefits:
✅ Cost-Effective Solution – Built in Excel, no expensive software is required.
✅ Easy to Customize – Users can add or remove KPIs as per business needs.
✅ Improved Compliance Monitoring – Real-time performance tracking ensures regulations are never overlooked.
✅ Data-Driven Decisions – Visuals, charts, and comparisons guide better decisions.
✅ Audit-Ready Documentation – Organized sheets serve as compliance evidence for external audits.
✅ User-Friendly Interface – Drop-downs, slicers, and buttons simplify navigation.
Opportunities for Improvement in Regulatory Adherence Dashboards
Click to Purchases Construction and Real Estate Regulatory Adherence KPI Dashboard in Excel
Even though this dashboard is powerful, businesses can enhance it further by:
🔹 Integrating with real-time data sources (ERP, construction management software).
🔹 Adding automation through VBA for faster updates.
🔹 Including risk scoring to prioritize high-risk compliance issues.
🔹 Linking compliance KPIs to financial impact for ROI tracking.
🔹 Expanding KPI library to cover sustainability and ESG regulations.
Best Practices for Using the Dashboard
To get the maximum benefit from the Regulatory Adherence KPI Dashboard, businesses should follow these best practices:
-
✔ Define clear KPIs – Select KPIs that directly impact compliance and project success.
-
✔ Update data regularly – Enter MTD and YTD data consistently to maintain accuracy.
-
✔ Set realistic targets – Base targets on industry standards and past performance.
-
✔ Train staff – Ensure all users understand how to use the dashboard.
-
✔ Review trends monthly – Use the trend sheet to detect recurring issues early.
-
✔ Align compliance with business goals – Link KPIs to safety, quality, and financial performance.
Conclusion
The Construction and Real Estate Regulatory Adherence KPI Dashboard in Excel is an essential tool for compliance management. It allows businesses to track KPIs, analyze performance, and identify areas for improvement. By combining structured data entry, automated calculations, and visual dashboards, it simplifies the complex process of regulatory adherence.
When used effectively, this dashboard ensures that companies stay compliant, avoid costly penalties, and build a reputation for reliability in the industry.
Frequently Asked Questions (FAQs)
1. What KPIs should I track in regulatory adherence for construction and real estate?
Some common KPIs include Safety Compliance Rate, Environmental Regulation Adherence, Project Approval Timeliness, Labor Law Compliance, and Audit Pass Percentage.
2. Can I customize the dashboard to fit my company’s needs?
Yes. The dashboard is built in Excel, which means you can add, remove, or modify KPIs based on your specific compliance requirements.
3. How often should I update the data in the dashboard?
Ideally, you should update monthly to ensure accuracy. Some companies prefer weekly updates for critical KPIs like safety compliance.
4. Is this dashboard suitable for small construction firms?
Absolutely. Since it is Excel-based, it is cost-effective and user-friendly, making it suitable for both small and large firms.
5. Can this dashboard replace compliance management software?
For many businesses, yes. However, larger enterprises may prefer integrating this Excel dashboard with existing ERP or compliance software for real-time monitoring.
Visit our YouTube channel to learn step-by-step video tutorials