Managing risks in construction and real estate projects is no small task. From financial uncertainties to operational inefficiencies, every stage of a project can bring unexpected challenges. To stay ahead, businesses must track and analyze key performance indicators (KPIs) that reflect potential risks and performance gaps.
A Construction and Real Estate Risk Management KPI Dashboard in Excel offers a centralized, visual, and interactive way to monitor risk-related metrics. This tool can help project managers, investors, and stakeholders make faster, data-driven decisions while minimizing risks.
In this article, we will explore the complete features of the dashboard, its advantages, best practices for using it effectively, and common questions that professionals often ask.
Click to Purchases Construction and Real Estate Risk Management KPI Dashboard in Excel
What Is a Construction and Real Estate Risk Management KPI Dashboard in Excel?
A Construction and Real Estate Risk Management KPI Dashboard is a ready-to-use Excel template designed to track and evaluate KPIs related to risk factors in projects. These KPIs might include safety incidents, cost overruns, schedule delays, legal issues, and more.
With Excel’s flexibility, the dashboard allows users to monitor Month-to-Date (MTD) and Year-to-Date (YTD) performance, compare results with targets, and analyze trends from previous years. The dashboard integrates multiple worksheets, each designed for a specific function, ensuring all stakeholders can access accurate, up-to-date information.
Key Features of the Construction and Real Estate Risk Management KPI Dashboard
The dashboard is organized into seven functional worksheets, each serving a unique purpose:
Home Sheet
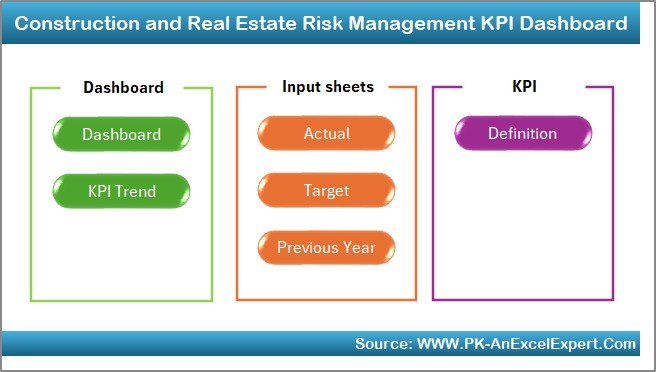
The Home Sheet acts as an index or navigation page.
-
It contains six clickable buttons that take you directly to other important sheets.
-
This helps you move quickly between views without scrolling or searching manually.
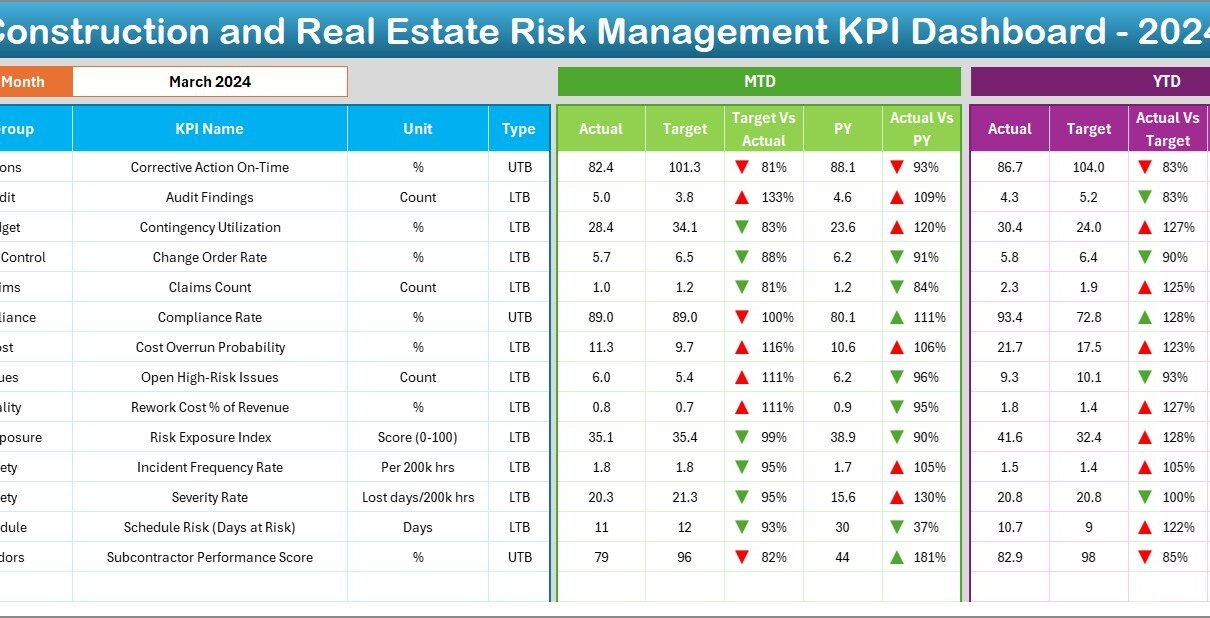
Dashboard Sheet Tab
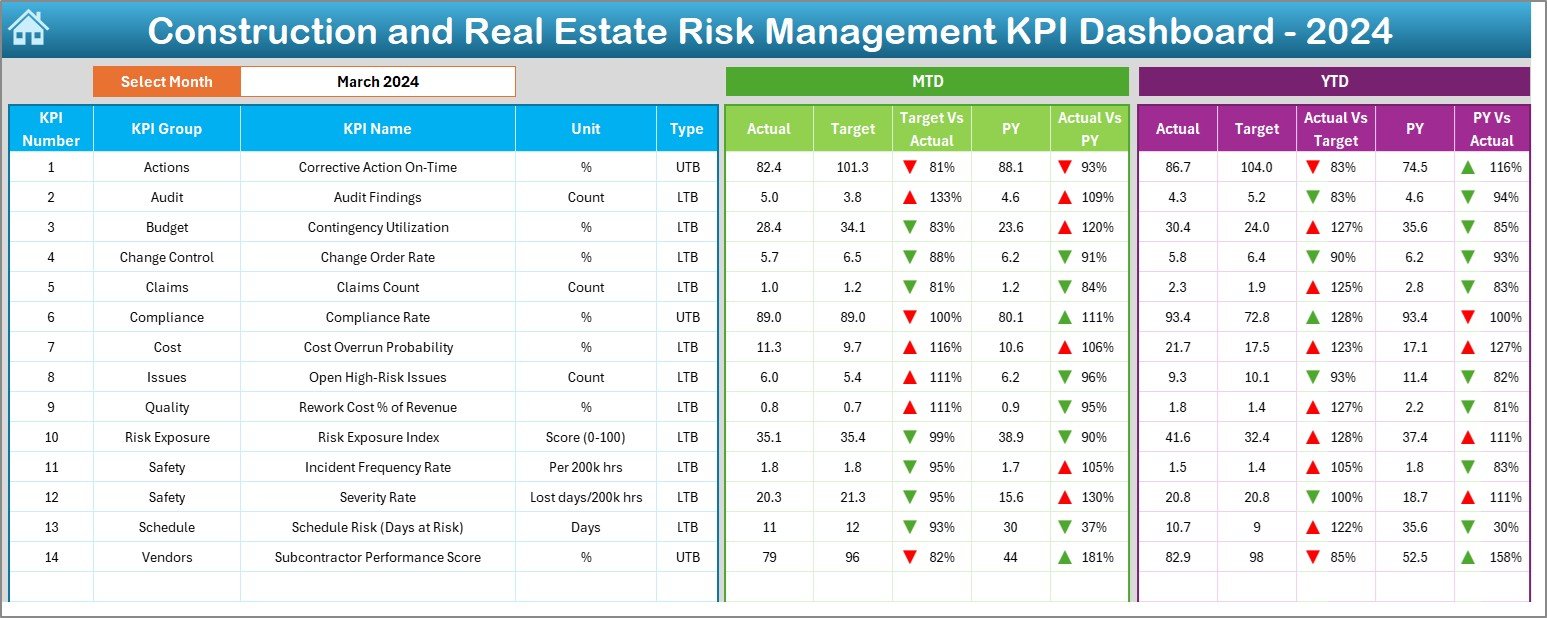
The Dashboard is the heart of the template.
-
In cell D3, you can select the desired month from a drop-down list.
-
Once the month is selected, all dashboard metrics update automatically.
-
Displays MTD Actual, Target, and Previous Year data with Target vs Actual and PY vs Actual comparisons.
-
Includes conditional formatting with up/down arrows for instant visual interpretation.
-
Shows YTD Actual, Target, and Previous Year figures for long-term performance tracking.
Click to Purchases Construction and Real Estate Risk Management KPI Dashboard in Excel
KPI Trend Sheet Tab
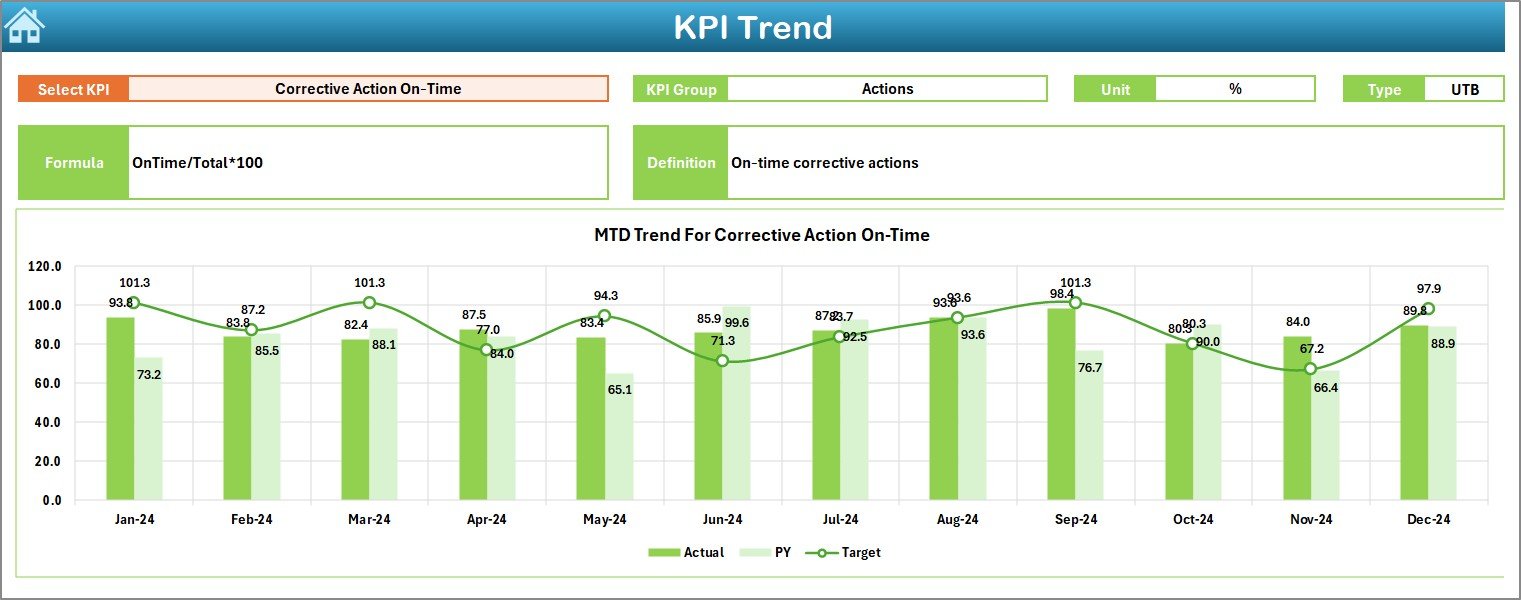
This sheet allows you to analyze KPI trends over time.
-
Select the KPI from a drop-down in C3.
-
View KPI Group, Unit, Type (Lower the Better or Upper the Better), Formula, and Definition.
-
Includes MTD and YTD trend charts for Actual, Target, and PY values.
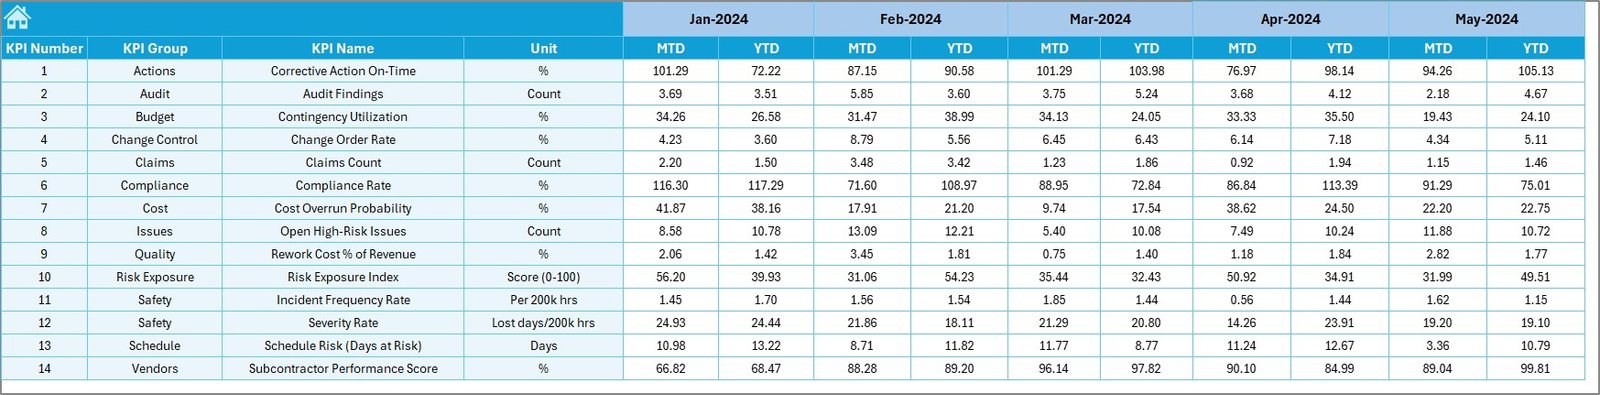
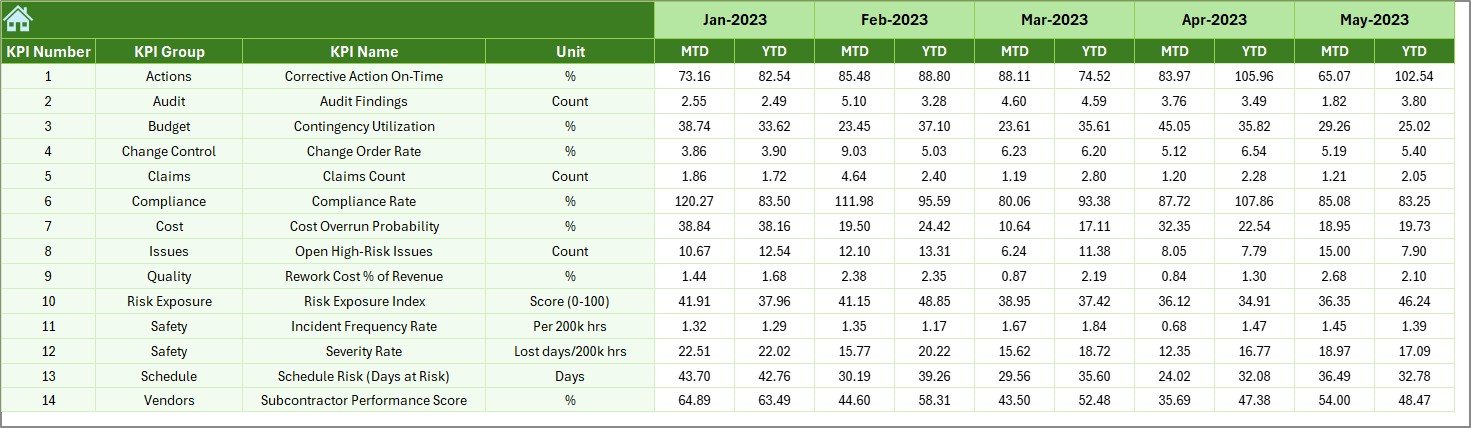
Actual Numbers Input Sheet
This is the data entry area for actual performance figures.
-
Input both MTD and YTD values.
-
Month selection is available in E1, where you specify the first month of the year.
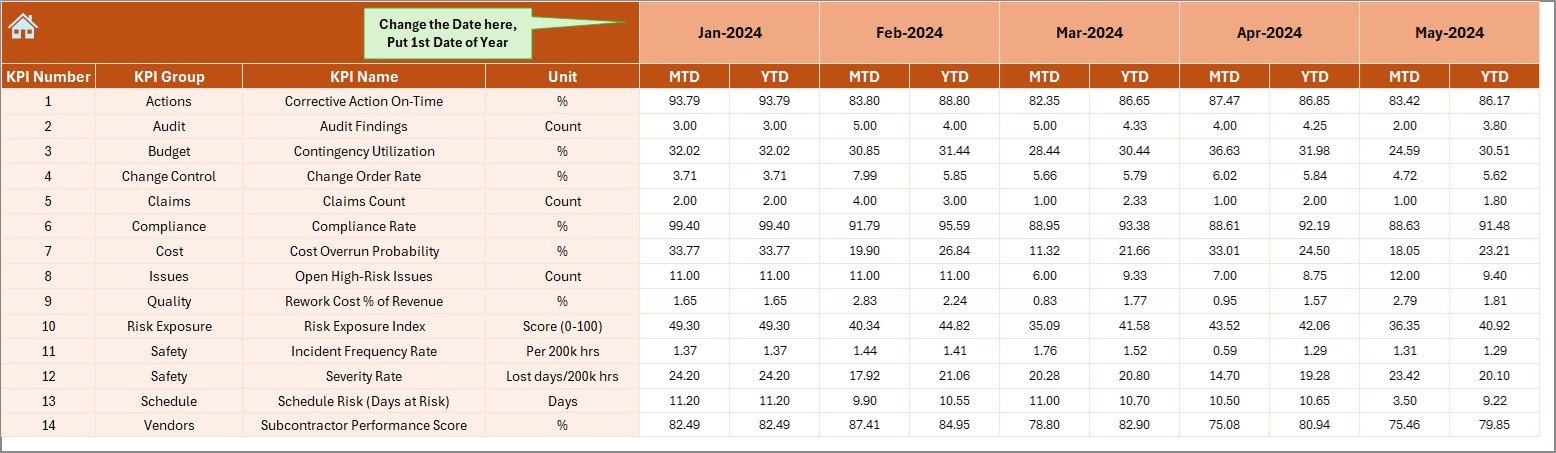
Target Sheet Tab
Here you define monthly and yearly targets for each KPI.
-
Enter both MTD and YTD target values.
Previous Year Numbers Sheet Tab
Stores historical KPI data from the previous year.
-
The structure is identical to the current year’s input for easy comparison.
KPI Definition Sheet Tab
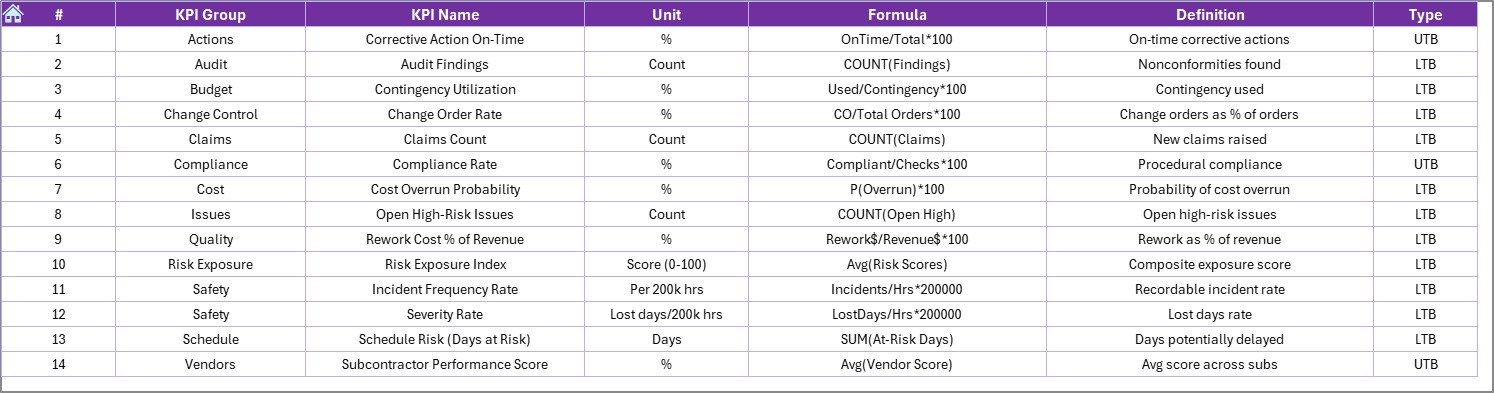
Acts as a reference database for KPIs.
-
Store KPI Name, Group, Unit, Formula, and Definition.
-
Helps ensure consistency and clarity across the team.
Why Is This Dashboard Important for Construction and Real Estate?
Construction and real estate projects are high-value, high-risk endeavors. Common challenges include:
-
Budget Overruns due to poor cost control.
-
Schedule Delays caused by supply chain disruptions or labor shortages.
-
Compliance Issues from failing to meet safety or environmental regulations.
-
Quality Risks that can lead to rework, increasing costs and timelines.
This dashboard consolidates all critical risk metrics in one place, helping teams quickly identify issues and take corrective actions.
Click to Purchases Construction and Real Estate Risk Management KPI Dashboard in Excel
Advantages of the Construction and Real Estate Risk Management KPI Dashboard
Using this Excel-based tool provides several benefits:
-
Centralized Data Monitoring – All KPIs are stored and visualized in one place.
-
Quick Decision-Making – Color coding, trend charts, and up/down arrows make data interpretation faster.
-
Customizable – You can add or remove KPIs, modify targets, and adapt formulas to fit project needs.
-
Cost-Effective – No need for expensive software; Excel offers a robust, affordable solution.
-
Historical Comparison – Compare current performance with past data to detect recurring risk patterns.
-
Enhanced Transparency – Keeps all stakeholders informed with clear, updated visuals.
-
Supports Proactive Risk Management – Helps address potential problems before they escalate.
Opportunities for Improvement in the Dashboard
While the dashboard is highly functional, it can be enhanced further:
-
Integration with Power BI – For more advanced visualizations and real-time data sync.
-
Automated Data Entry – Using forms or linked databases to reduce manual effort.
-
Mobile-Friendly Views – Designing Excel layouts for better mobile usability.
-
Additional KPI Categories – Adding sustainability, client satisfaction, or environmental risk KPIs.
-
Automated Alerts – Conditional rules that send email notifications when certain KPIs exceed thresholds.
Best Practices for Using the Construction and Real Estate Risk Management KPI Dashboard
To get the best results, follow these practices:
-
Define KPIs Clearly – Ensure everyone understands the KPI definitions, units, and targets.
-
Update Data Regularly – Enter actuals and targets consistently to keep insights accurate.
-
Use Consistent Units – Avoid confusion by standardizing measurement units.
-
Leverage Conditional Formatting – Highlight urgent risks for immediate attention.
-
Review Trends Monthly – Identify patterns and act before issues worsen.
-
Collaborate with Stakeholders – Share dashboard reports with relevant teams for feedback.
-
Maintain Historical Data – Past performance helps forecast future risks.
How to Implement the Dashboard in Your Organization
-
Download and Open the Excel template.
-
Enter KPI Definitions in the KPI Definition sheet.
-
Set Targets in the Target Sheet tab.
-
Add Previous Year Data for accurate comparisons.
-
Update Monthly Actuals in the Actual Numbers Input sheet.
-
View Insights in the Dashboard and KPI Trend sheets.
-
Share Reports with stakeholders via PDF export or screen sharing.
Real-World Use Cases of the Dashboard
-
Construction Firms tracking project safety, cost variance, and delay risks.
-
Real Estate Developers monitoring sales performance, legal compliance, and project delivery timelines.
-
Property Management Companies evaluating maintenance backlog and tenant satisfaction.
-
Investors assessing the financial risk profile of ongoing developments.
Conclusion
The Construction and Real Estate Risk Management KPI Dashboard in Excel is more than just a spreadsheet—it is a strategic tool for project success. By tracking key risk metrics in real-time, businesses can minimize losses, improve efficiency, and strengthen decision-making. Its affordability, customization, and ease of use make it an ideal solution for companies of all sizes.
Frequently Asked Questions (FAQs)
1. What types of risks can this dashboard track?
It can track financial risks, schedule delays, safety incidents, quality issues, compliance risks, and more, depending on the KPIs you define.
2. Can I customize the KPIs in the dashboard?
Yes. You can add, edit, or remove KPIs in the KPI Definition sheet to fit your project’s unique needs.
3. Does this dashboard work in Google Sheets?
While it is designed for Excel, you can upload it to Google Sheets. However, some features like advanced conditional formatting may not work the same way.
4. How often should I update the data?
For optimal results, update the data monthly. For critical projects, weekly updates may be more effective.
5. Can I use this dashboard for multiple projects?
Yes. You can create separate files for each project or modify the template to track multiple projects in one file.
Visit our YouTube channel to learn step-by-step video tutorials