Sustainability matters more than ever in the construction and real estate industry, and businesses want to track, improve, and report their environmental performance. That is why a Sustainability KPI Dashboard in Excel plays a critical role. In this detailed guide, you will learn what this dashboard includes, how it works, and how it helps organizations monitor and improve their sustainability practices.
What is a Construction and Real Estate Sustainability KPI Dashboard?
A Construction and Real Estate Sustainability KPI Dashboard is an Excel-based tool that allows builders, developers, and property managers to track their sustainability Key Performance Indicators (KPIs) in a visual and structured way. It combines data input sheets, charts, and KPI definitions in one place so you can manage performance effectively over time.
It monitors important metrics like energy usage, waste generation, recycling rate, water consumption, and carbon emissions. With an easy-to-use layout and drop-downs, it helps decision-makers understand gaps and introduce corrective actions quickly.
Click to Purchases Construction and Real Estate Sustainability KPI Dashboard in Excel
Why Do You Need a Sustainability KPI Dashboard in Excel?
Businesses in construction and real estate often work on multiple projects with strict sustainability requirements. Regulations keep changing and clients demand responsible practices. Without a clear tracking system:
-
Sustainability performance becomes hard to measure.
-
Reporting gets chaotic and inaccurate.
-
Teams lose focus due to scattered information.
A dashboard centralizes all of this and provides a clean structure, saving time, improving focus, and supporting smarter decisions on sustainability initiatives.
Key Features of the Dashboard
Let’s explore the essential features of this Excel-based dashboard:
Home Sheet (Quick Navigation Hub)
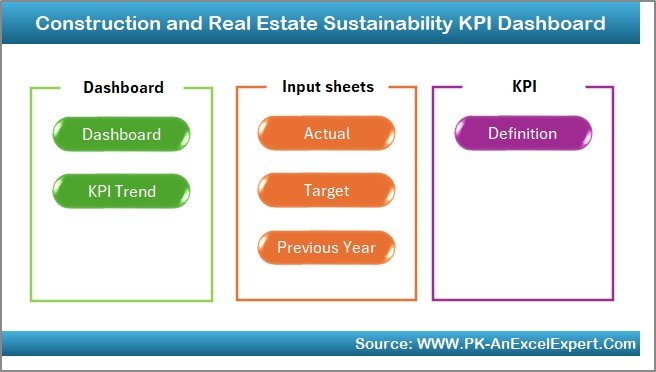
-
Includes buttons that let you jump to any sheet instantly.
-
Helps first-time users navigate the dashboard easily.
-
Gives a clean starting point and better user experience.
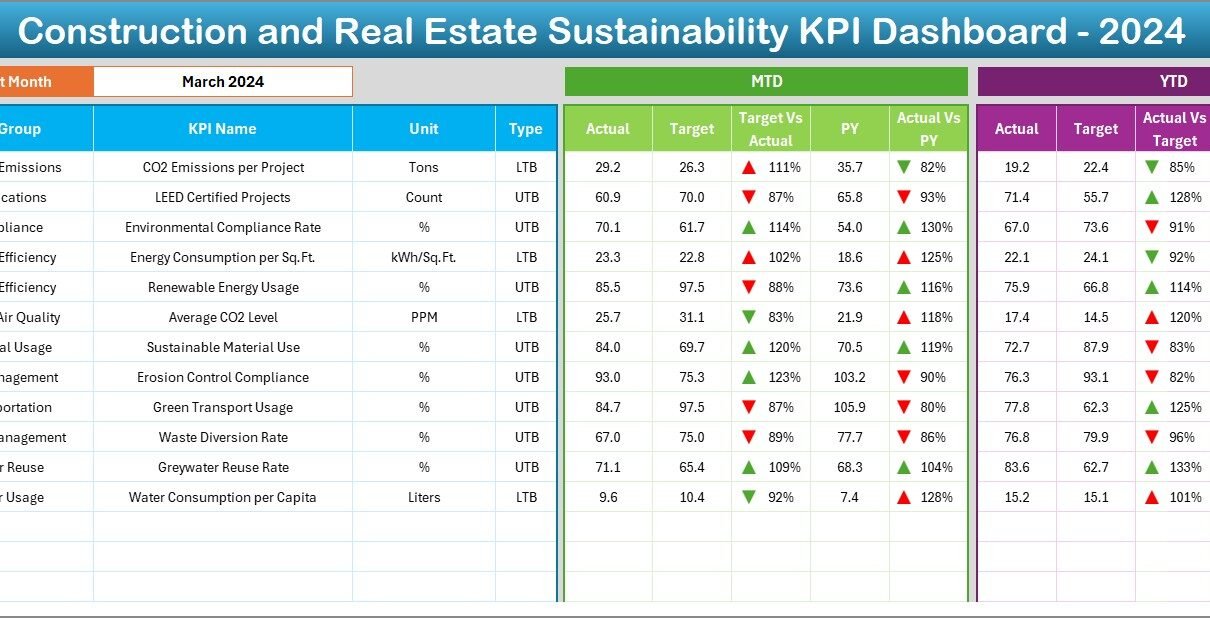
Dashboard Sheet (Performance Overview)
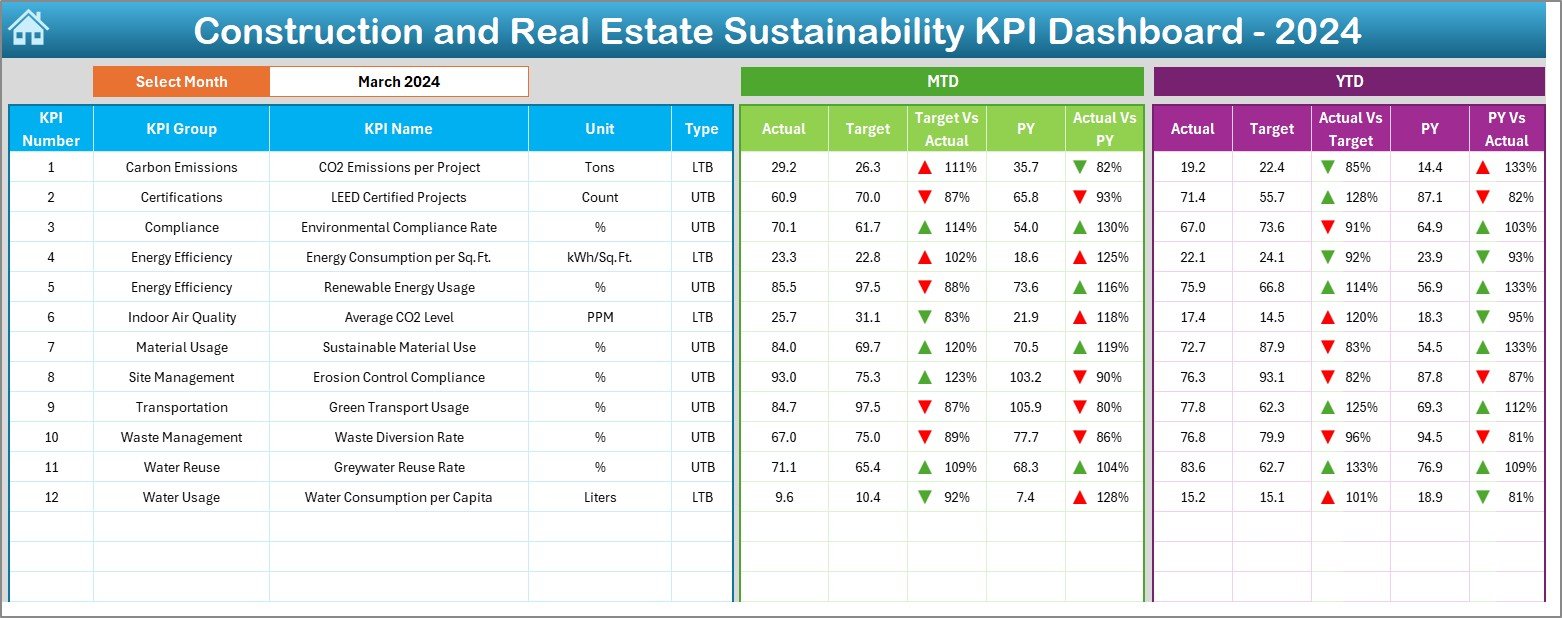
-
Main sheet showing all KPIs in one place.
-
Allows the user to select any month using a drop-down (D3).
-
Automatically refreshes all KPI values for that month.
-
Shows MTD vs Target vs Previous Year, as well as YTD comparisons.
-
Arrow-based conditional formatting helps users spot positive and negative trends.
KPI Trend Sheet (Deep Dive View)
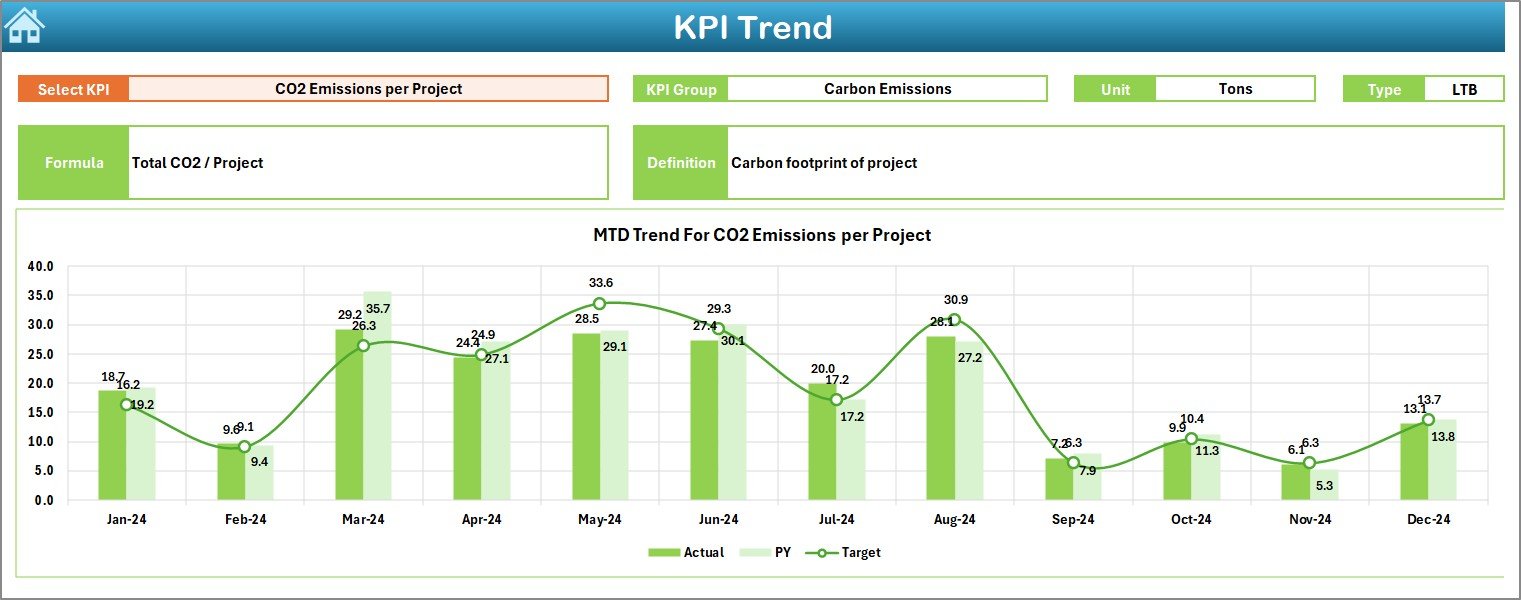
-
Select any KPI from the drop-down at cell C3.
-
See the KPI Group, Unit, Formula, Definition, and Type (LTB or UTB).
-
View MTD and YTD trend charts for the selected KPI across 12 months.
-
Helps identify seasonal patterns and recurring weaknesses.
Actual Numbers Input Sheet
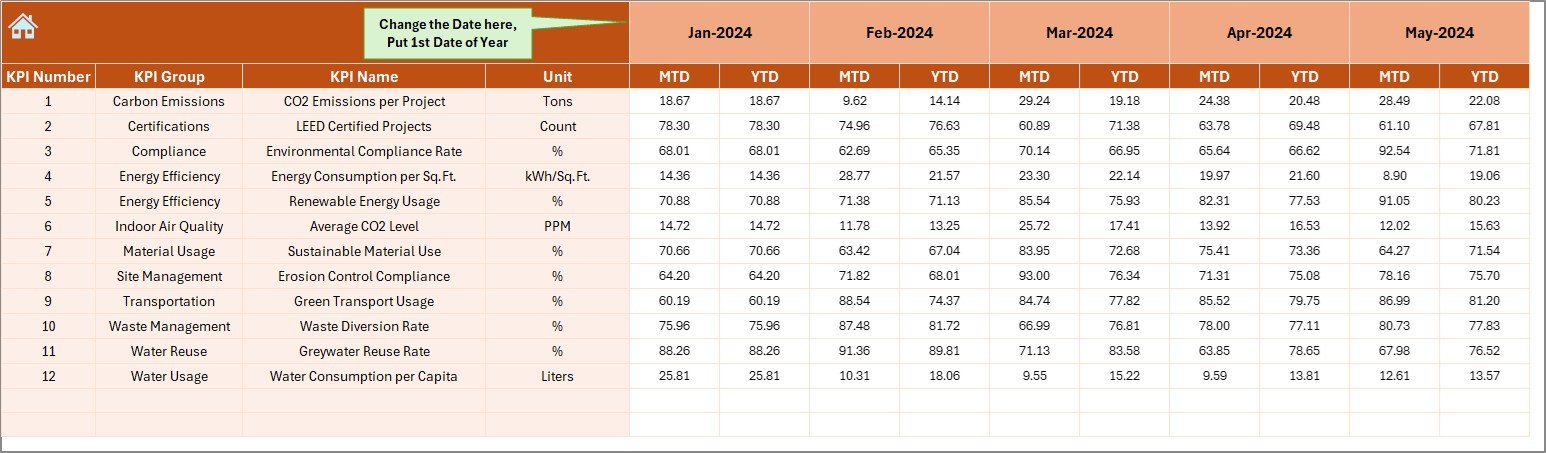
-
Users enter monthly Actual MTD and YTD values here.
-
Cell E1 allows users to change the starting month of the year.
-
This flexibility makes the template suitable for calendar and fiscal years.
Target Sheet
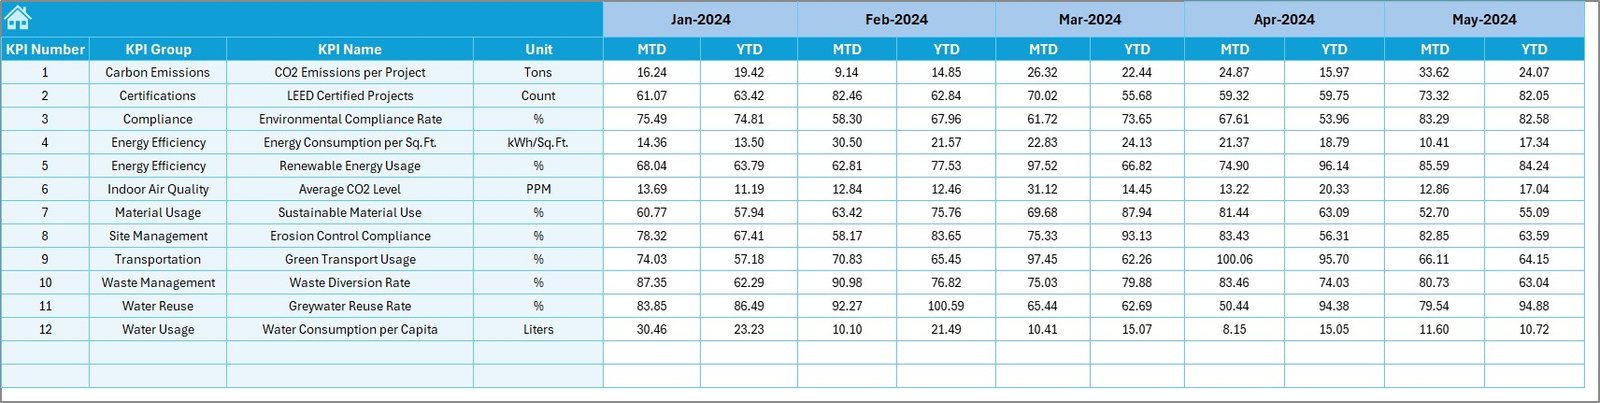
-
Used to enter Target values for each KPI on a monthly basis.
-
Includes both MTD and YTD targets to match the trend analysis.
Previous Year Numbers Sheet
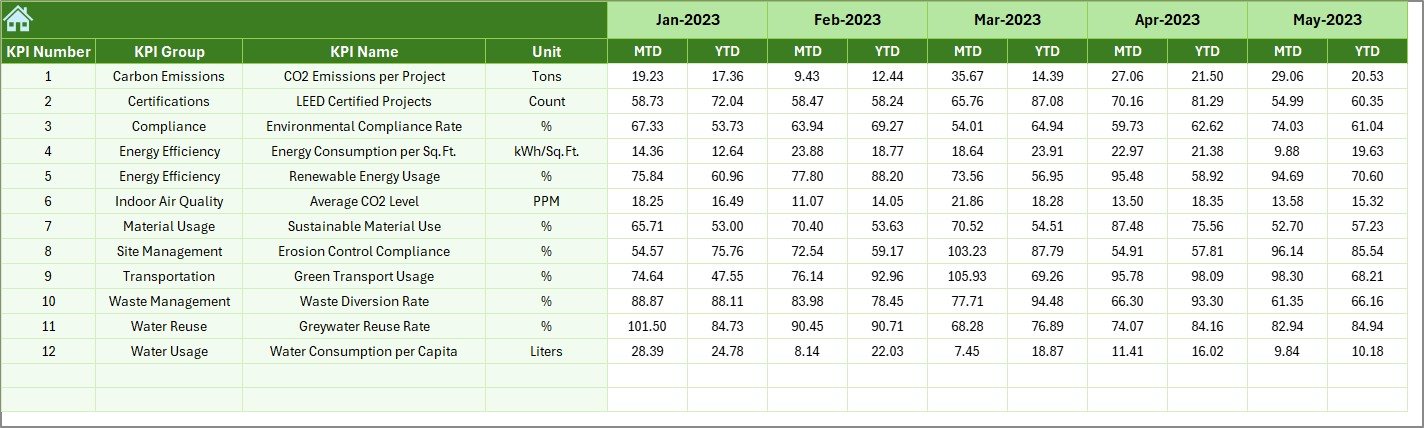
-
Used to enter historical data from the previous year.
-
Makes it easy to compare current results with past performance.
-
Enables straight PY vs Actual comparison in visual charts.
Click to Purchases Construction and Real Estate Sustainability KPI Dashboard in Excel
KPI Definition Sheet
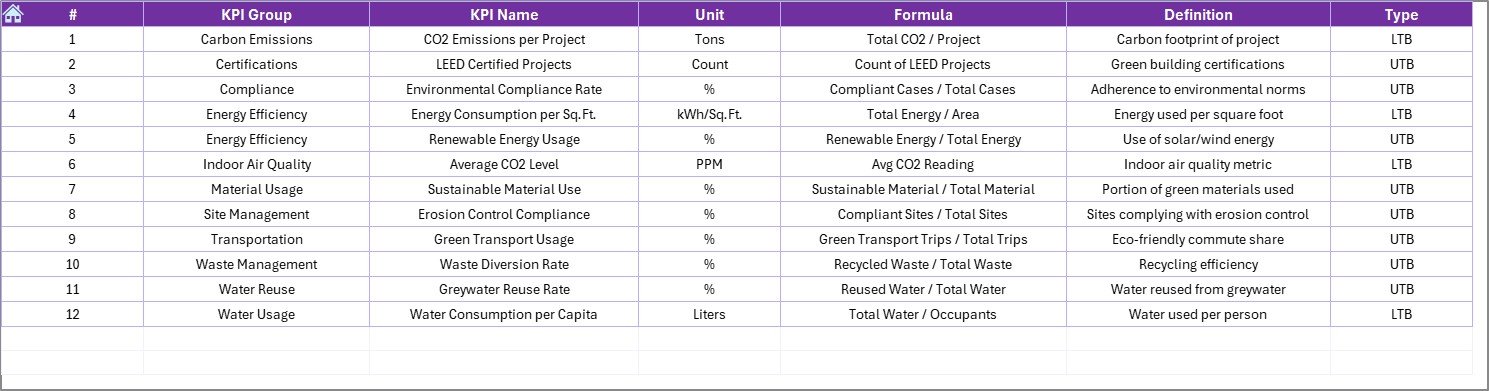
-
Acts as the control center for KPI setup.
-
Here you enter the KPI Name, Group, Unit, Formula, and Definition.
-
The dashboard and trend sheets pull the information from here.
Advantages of a Construction and Real Estate Sustainability KPI Dashboard
✅ Improves Visibility – Everything from energy to waste is visible in one place.
✅ Enables Fast Decision Making – Visual indicators and drop-downs speed up decision-making.
✅ Boosts Regulatory Compliance – Helps track KPIs that are required for local and international standards.
✅ Compares Past vs Present – Previous year comparison makes it easier to evaluate progress.
✅ Enhances Accountability – Each KPI is clearly defined with a responsible unit.
✅ Reduces Complexity – No need for multiple spreadsheets; one structured file does all the work.
How to Use the KPI Dashboard Step-by-Step
Step 1: Define Your KPIs Clearly
Start by listing the most relevant sustainability KPIs for your projects. For example, Electricity Usage, Water Consumption, Renewable Energy Rate, or GHG Emission.
Step 2: Input KPI Details
Fill up the KPI Definition sheet with:
-
KPI Name
-
KPI Group
-
Unit of Measurement
-
Short Formula
-
Definition
-
Type (LTB or UTB)
Step 3: Set Targets
On the Target sheet, enter your MTD and YTD targets for each KPI for each month.
Step 4: Enter Actual Data
Use the Actual Numbers Input sheet to enter the real performance data every month.
Step 5: Add Previous Year Data
Copy or enter the baseline values from last year on the Previous Year Number sheet.
Step 6: Analyse the Dashboard
Go to the Dashboard sheet, select a month, and review the numbers.
Use arrows, gaps, and charts to understand what needs improvement.
Step 7: Explore the Trend Charts
Visit the KPI Trend sheet and explore MTD and YTD trends for each KPI.
Each chart tells a story about how that KPI has evolved over the year.
Best Practices for Using the Sustainability KPI Dashboard
-
Update data regularly → input Actuals and Targets each month without delay.
-
Use realistic targets → align them with industry benchmarks and internal capabilities.
-
Review trends, not just numbers → use the Trend sheet to see longer patterns.
-
Engage all departments → assign one owner per KPI for accountability.
-
Keep KPI definitions up to date → update the KPI Definition sheet when business strategies change.
-
Compare with baseline → use the Previous Year numbers to measure real progress.
Opportunities for Improvement in Sustainability Dashboards
-
Include automated data imports from external systems using Power Query.
-
Add department-level drill-downs for deeper insights.
-
Introduce alerts when a KPI drops below a threshold.
-
Add comments and notes section to explain sudden drops or rises.
-
Connect the Excel dashboard with Power BI to enhance sharing and reporting.
Conclusion
A Construction and Real Estate Sustainability KPI Dashboard in Excel is a simple, practical, and powerful tool. It helps organizations measure and improve their environmental impact with real-time data and clear performance visualizations. The dashboard’s structure – from the KPI Definition sheet to the Trend charts – creates a smooth workflow for tracking, updating, and reporting sustainability KPIs.
When used consistently, this dashboard drives continuous improvement and helps meet regulatory requirements, client expectations, and internal goals. In short, it turns sustainability from a concept into a measurable daily practice.
Frequently Asked Questions (FAQ)
Q1. What KPIs should I include in my Sustainability Dashboard?
Start with energy usage, water consumption, recycling rate, carbon emissions, and waste generation. You can also include renewable energy usage, employee training hours, and green building certifications.
Q2. Can I use this dashboard for multiple projects?
Yes, you can. You may add a “Project Name” column in the Actual Numbers sheet and use slicers or filters to switch between projects.
Q3. How often should I update the dashboard?
Update it monthly to maintain accurate MTD and YTD performance. Some companies update certain KPIs weekly for better monitoring.
Q4. Can I customize the KPI list?
Absolutely. The KPI Definition sheet lets you add, remove, or edit KPIs according to your needs.
Q5. Do I need any advanced Excel knowledge?
No. The dashboard works with simple drop-downs and standard formats. Basic Excel knowledge is enough to run and maintain the dashboard.
Visit our YouTube channel to learn step-by-step video tutorials
Click to Purchases Construction and Real Estate Sustainability KPI Dashboard in Excel
Watch the step-by-step video tutorial: