Content Creator Revenue Dashboard in Excel is a premium, interactive analytics template built specifically for YouTubers, bloggers, podcasters, social media influencers, and digital content creators who want to track their revenue, views, subscribers, and profitability across multiple platforms — all inside Microsoft Excel. Whether you are a solo creator earning from YouTube ads and sponsorships, or a content agency managing multiple creators, this dashboard gives you a complete financial and performance picture of your content business in one powerful Excel file.
This dashboard includes 5 interactive analysis pages — Overview, Revenue Trend, Platform Analysis, Creator Performance, and Content Insights — plus a dedicated Data Sheet for easy data entry and a Support Sheet with pivot tables that power the entire dashboard automatically. It tracks 5 key performance indicators including Total Revenue, Net Profit, Total Views, Total Subscribers, and Total Posts, and visualizes them through 16+ interactive charts across multiple dimensions such as platform, category, creator, region, and revenue source.
👉 Click here to Purchase Content Creator Revenue Dashboard in Excel
Key Features of Content Creator Revenue Dashboard in Excel
The Content Creator Revenue Dashboard in Excel is packed with features designed for serious content creators who want data-driven insights into their business performance. Here are the standout features that make this template an essential tool for any content creator:
- 5 Interactive Dashboard Pages — Overview, Revenue Trend, Platform Analysis, Creator Performance, and Content Insights provide a 360-degree view of your content business
- 5 KPI Summary Cards — Track Total Revenue, Net Profit, Total Views, Total Subscribers, and Total Posts at the top of the Overview page
- 16+ Interactive Charts — Visualize revenue trends, platform comparisons, creator benchmarks, and content performance across multiple dimensions
- Dynamic Slicer Filters — Filter all dashboard pages by platform, category, creator, time period, and other dimensions with a single click
- Revenue Per Mile (RPM) Tracking — Understand how efficiently your content monetizes per thousand views across platforms and over time
- Profit Margin Analysis — See overall and platform-level profit margins to identify your most profitable content channels
- Production Cost Comparison — Compare revenue against production costs to calculate true content ROI
- Multi-Platform Support — Track performance across YouTube, Instagram, TikTok, blogs, podcasts, and any other content platform
- Pivot Table Powered — All charts auto-update when you refresh data in Excel, no VBA or macros needed
- Plug-and-Play Data Sheet — Replace sample data with your own and click Refresh All to see your personalized dashboard
Dashboard Pages Explanation
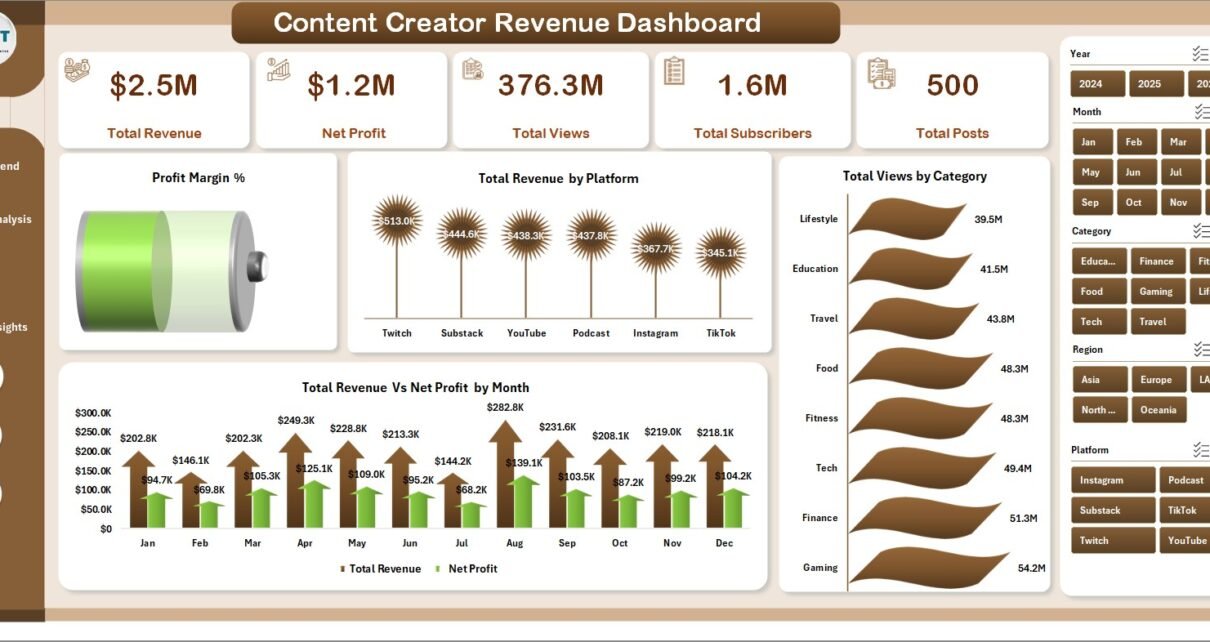
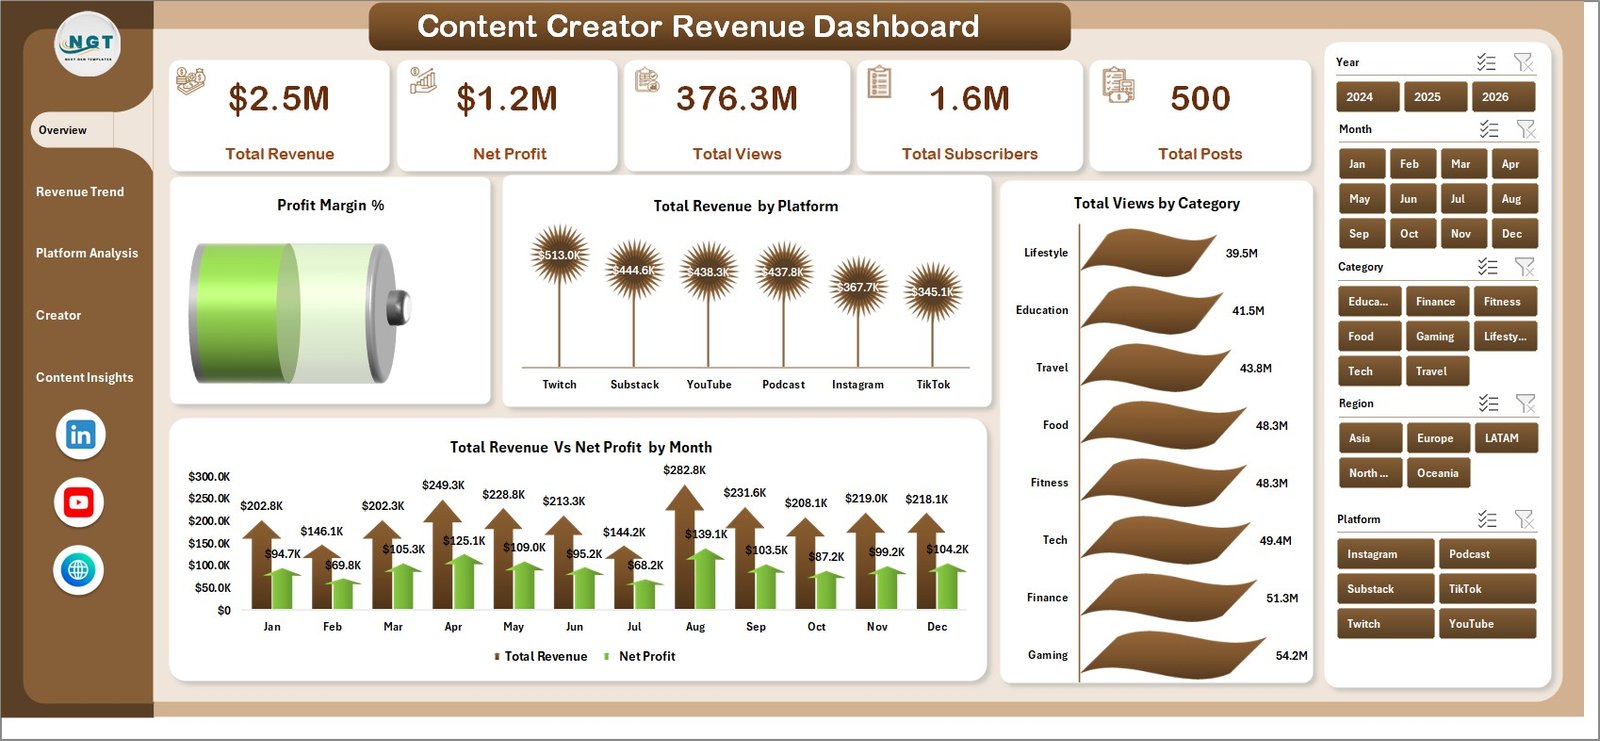
1 — Overview Page
The Overview page serves as the main command center of the Content Creator Revenue Dashboard in Excel. At the top, you will find 5 high-level KPI cards displaying Total Revenue, Net Profit, Total Views, Total Subscribers, and Total Posts. Below the cards, the page features four key charts: Profit Margin % by Overall gives you an instant health check of your content business profitability; Total Revenue by Platform shows which channels generate the most income; Total Views by Category reveals which content categories attract the most audience; and Total Revenue Vs Net Profit by Month tracks your monthly financial performance trend. Multiple slicer filters are available so you can quickly drill down into the data by platform, category, creator, or time period.
Content Creator Revenue Dashboard in Excel2 — Revenue Trend
The Revenue Trend page focuses on time-based analysis to help you understand how your content business performs over time. This page includes four powerful charts: Total Views Vs Total Subscribers by Month shows whether your audience growth correlates with viewership; Total Revenue Vs Net Profit by Year provides a long-term profitability view; Revenue Per Mile by Month tracks how efficiently your content monetizes per thousand views over time; and Total Revenue Vs Total Production Cost by Month reveals your true content ROI by comparing what you earn against what you spend on production.
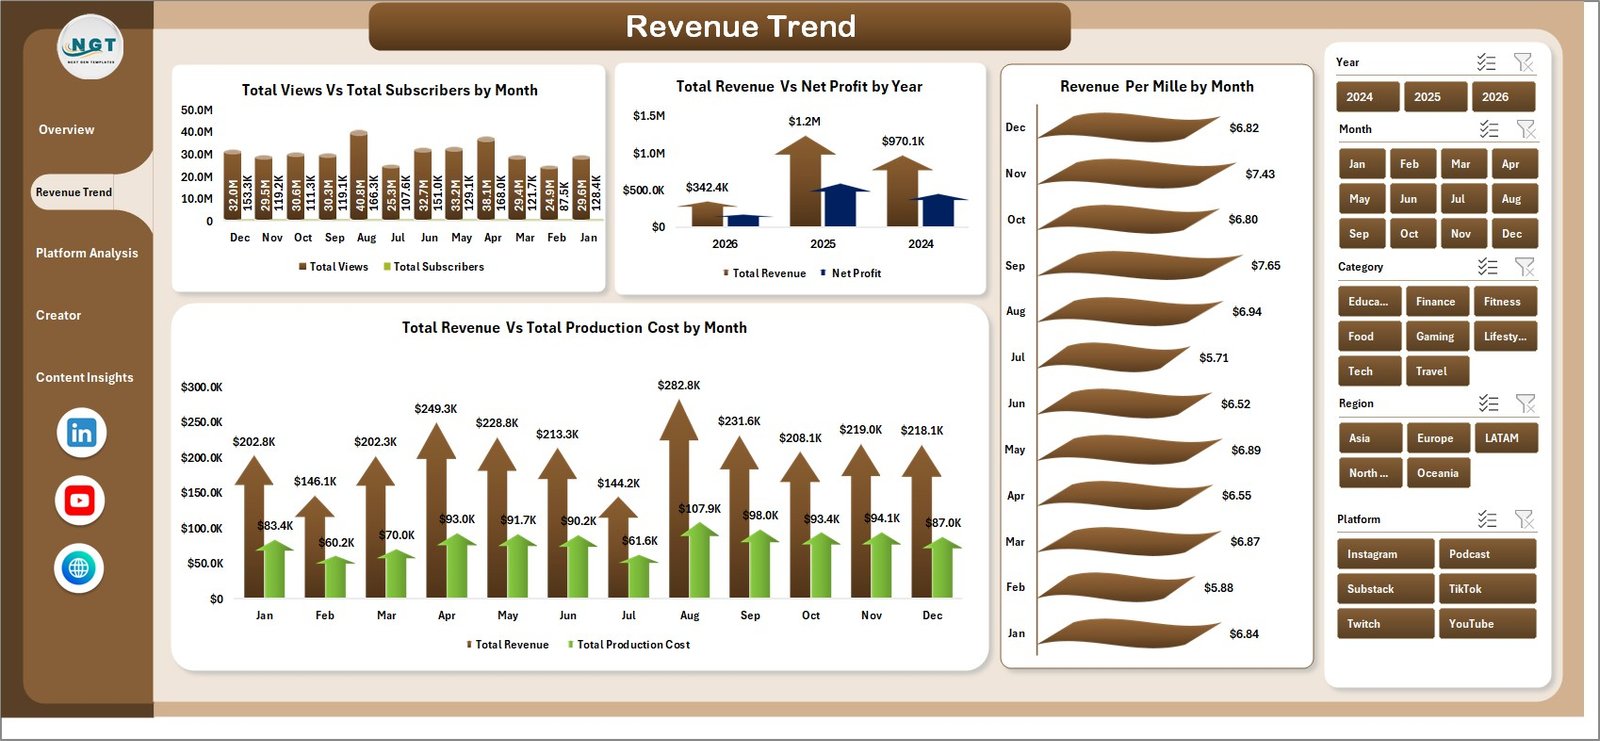 Revenue Trend
3 — Platform Analysis
The Platform Analysis page is essential for creators who publish across multiple platforms. It features four charts: Total Revenue Vs Total Ad Spend by Platform helps you see which platforms deliver the best return on your advertising investment; Total Views by Platform shows where your audience is most engaged; Revenue Per Mile by Platform compares monetization efficiency across channels; and Profit Margin % by Platform reveals which platforms are most profitable after accounting for all costs. This page helps you make informed decisions about where to focus your content creation efforts.
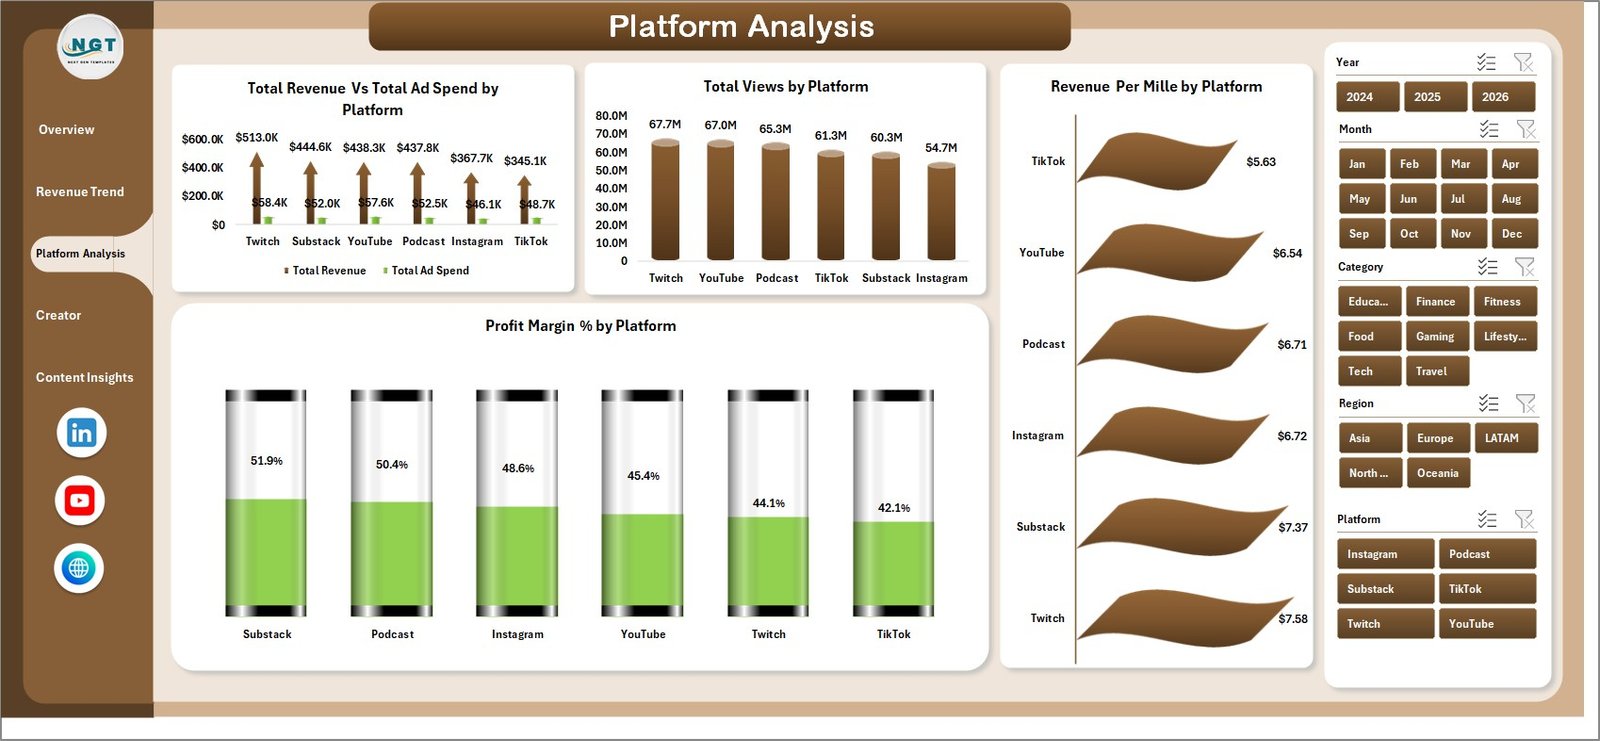 Platform Analysis
4 — Creator Performance
The Creator Performance page is designed for content teams, agencies, and multi-creator brands. It includes four comparison charts: Total Subscribers by Creator benchmarks audience size across team members; Total Views by Creator shows who generates the most viewership; Avg Engagement Score by Creator measures audience interaction quality; and Total Revenue Vs Net Profit by Creator reveals who contributes the most to the bottom line. This page makes it easy to identify top performers and areas for improvement.
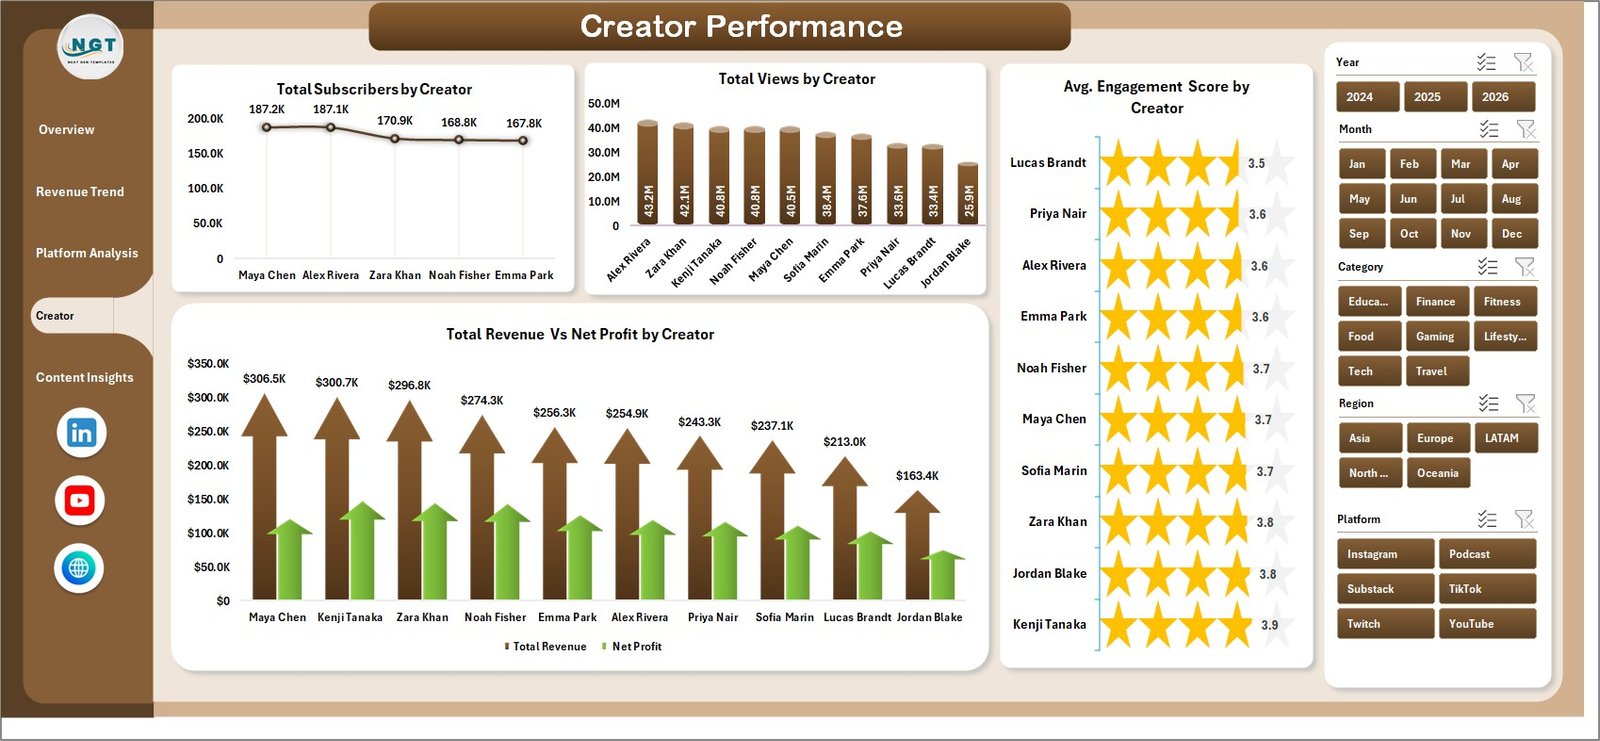 Creator Performance
5 — Content Insights
The Content Insights page helps you understand what content drives the most results. It features four analytical charts: Total Revenue Vs Total Views by Content shows the relationship between audience reach and revenue generation for each piece of content; Total Revenue by Revenue Source breaks down your income between ads, sponsorships, merchandise, and other streams; Total Revenue by Region reveals your geographic revenue distribution; and Total Revenue Vs Net Profit by Category identifies which content categories are most profitable.
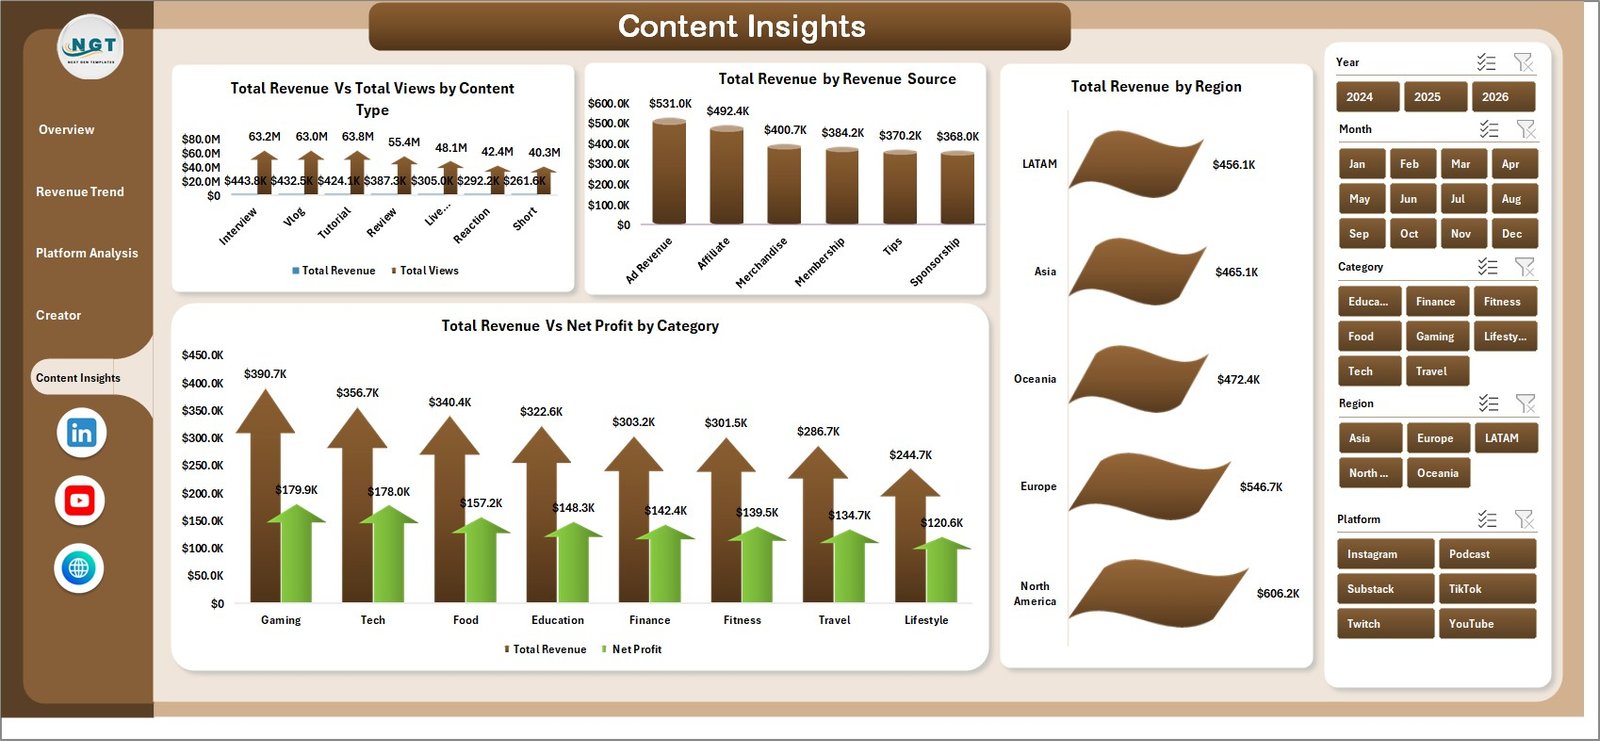 Content Insights
6 — Data Sheet
The Data Sheet is where you add your content creator data. Simply paste your data in the same format as the sample data provided. The sheet contains all the raw data fields needed for the dashboard including platform, category, creator name, revenue, production cost, views, subscribers, engagement score, region, revenue source, and more.
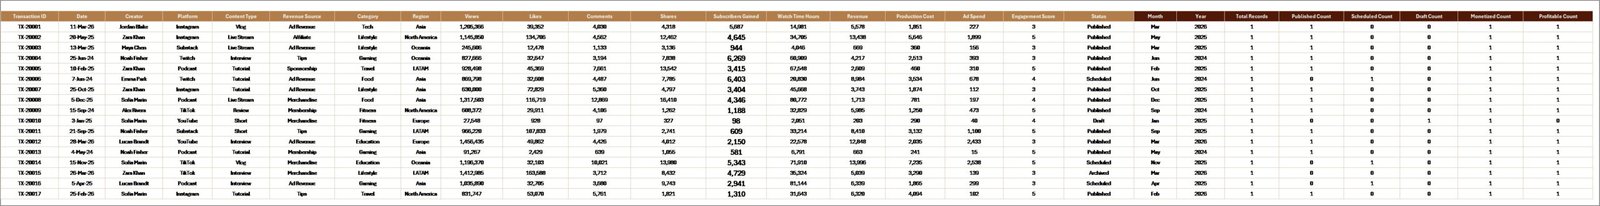 Data Sheet Tab
7 — Support Sheet
The Support Sheet contains all the pivot tables that power the entire dashboard dynamically. After updating the data in the Data Sheet, go to the Data tab in the Excel Ribbon and click Refresh All. All the pivot tables will be refreshed and all the charts will update automatically. You can keep this sheet hidden for a cleaner dashboard view.
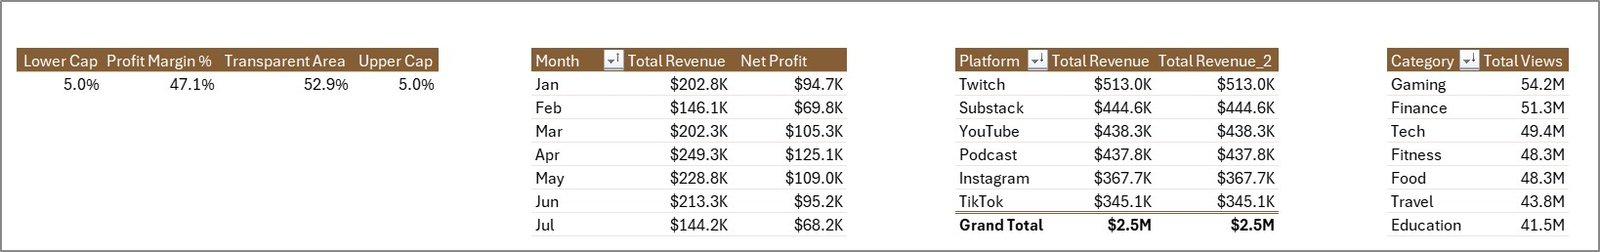 Support Sheet Tab
Advantages of Content Creator Revenue Dashboard in Excel
This dashboard offers several distinct advantages over generic analytics tools. First, it consolidates data from multiple platforms into a single view, eliminating the need to switch between YouTube Studio, Instagram Insights, and other platform-specific dashboards. Second, the Profit Margin and RPM metrics provide financial clarity that most free analytics tools do not offer. Third, the Creator Performance page enables team-level benchmarking that is not available in standard platform analytics. Fourth, the pivot-table architecture means the dashboard is infinitely scalable — you can add thousands of records and everything will still work perfectly after a simple refresh. Finally, since it runs in Excel, you have full control over your data without relying on third-party cloud services.
Opportunities for Improvement
👉 Click here to Purchase Content Creator Revenue Dashboard in Excel
While the Content Creator Revenue Dashboard in Excel covers most content creator analytics needs, there are a few areas where creators might want to extend the template. Adding a dedicated social media engagement page with metrics like shares, comments, and saves per platform could provide deeper audience interaction insights. Integrating a monthly budget planning sheet alongside the actual data would enable budget vs actual comparison. Additionally, creators managing very large datasets (10,000+ records) might benefit from Power Query integration for automated data transformation. These enhancements can be easily added by users with intermediate Excel skills.
Best Practices
To get the most value from this dashboard, follow these recommended practices. Update your data weekly or monthly to maintain accurate trend analysis. Use consistent naming conventions for platforms, categories, and creator names to ensure proper grouping in pivot tables. Always click Refresh All from the Data tab after adding new data to update all charts and KPI cards. Take advantage of the slicer filters to create focused views for specific platforms, time periods, or creators. Export filtered views as PDF reports for stakeholder presentations. Back up your file regularly, especially before major data updates.
Explore Relevant Templates
If you are interested in more content creator and marketing analytics tools, check out these related templates from NextGenTemplates:
- YouTube Channel Analytics Dashboard in Excel — A dedicated YouTube analytics dashboard tracking views, revenue, subscribers, and audience insights across 5 interactive pages
- YouTube Channel Analytics Dashboard in Power BI — Advanced YouTube analytics with Power BI interactivity and DAX-powered calculations
- YouTube Channel Analytics Dashboard in HTML — Browser-based YouTube analytics that runs without any software installation
- YouTube Channel Analytics Dashboard in Google Sheets — Cloud-based YouTube analytics accessible from any device via Google Drive
Frequently Asked Questions
What KPIs does the Content Creator Revenue Dashboard in Excel track?
The Content Creator Revenue Dashboard in Excel tracks 5 key performance indicators: Total Revenue, Net Profit, Total Views, Total Subscribers, and Total Posts. It also calculates derived metrics including Profit Margin %, Revenue Per Mile (RPM), and Average Engagement Score across 5 interactive analysis pages with 16+ charts.
Do I need advanced Excel skills to use this content creator dashboard?
No. Simply replace the sample data in the Data Sheet with your own content creator revenue data and click Refresh All from the Data tab in the Excel Ribbon. All pivot tables, charts, and KPI cards update automatically. No VBA, macros, or formula editing required.
Can I track revenue from multiple platforms like YouTube, Instagram, and TikTok?
Yes. The dashboard includes a dedicated Platform Analysis page that breaks down Total Revenue, Total Views, Revenue Per Mile, and Profit Margin % by each platform. You can add data for YouTube, Instagram, TikTok, blogs, podcasts, or any other content platform in the Data Sheet.
What is the best Excel dashboard template for content creators?
👉 Click here to Purchase Content Creator Revenue Dashboard in Excel
The Content Creator Revenue Dashboard in Excel by NextGenTemplates is one of the most comprehensive content creator analytics templates available. It includes 5 interactive pages covering revenue trends, platform analysis, creator performance, and content insights — all powered by pivot tables for automatic updates with no coding required.
Can I compare performance across multiple content creators?
Yes. The Creator Performance page includes comparison charts for Total Subscribers by Creator, Total Views by Creator, Avg Engagement Score by Creator, and Total Revenue Vs Net Profit by Creator — making it perfect for content teams, agencies, and multi-creator brands.
How do I update the dashboard with new data?
Go to the Data Sheet tab and paste your new content creator data in the same format as the sample data. Then go to the Data tab in the Excel Ribbon and click Refresh All. All pivot tables in the Support Sheet will refresh and all charts across all 5 dashboard pages will update automatically.
Conclusion
The Content Creator Revenue Dashboard in Excel is an essential tool for any content creator who takes their business seriously. With 5 interactive analysis pages, 16+ charts, and pivot-table-powered automation, it transforms raw content data into actionable insights about revenue, profitability, platform performance, and creator benchmarking. Whether you are a solo YouTuber or a content agency managing a roster of creators, this template provides the analytics foundation you need to grow your content business strategically.
👉 Click here to Purchase Content Creator Revenue Dashboard in Excel
🎥 Visit our YouTube channel to learn step-by-step video tutorials
👉 Youtube.com/@PK-AnExcelExpert