Managing content licensing is no longer a simple accounting task. Today, media companies, publishers, OTT platforms, digital agencies, and content aggregators deal with multiple content types, platforms, regions, royalty structures, and contracts at the same time. Because of this complexity, tracking performance manually becomes slow, confusing, and risky.
That is exactly why a Content Licensing Dashboard in Excel becomes a powerful and practical solution.
In this detailed guide, you will learn what a Content Licensing Dashboard in Excel is, why organizations need it, how it works, its page-wise structure, key advantages, best practices, and frequently asked questions. By the end of this article, you will clearly understand how this dashboard helps you control licensing costs, maximize revenue, and improve profitability—without complicated software.
Click to Purchases Content Licensing Dashboard in Excel
What Is a Content Licensing Dashboard in Excel?
A Content Licensing Dashboard in Excel is a ready-to-use, interactive reporting and analytics tool designed to track and analyze financial and operational performance related to licensed content.
Instead of using multiple spreadsheets, emails, and manual reports, this dashboard brings all key licensing metrics into one structured Excel file. As a result, decision-makers can quickly understand costs, revenues, royalties, margins, and trends.
Moreover, because the dashboard runs entirely in Excel, it remains easy to update, flexible to customize, and accessible to both technical and non-technical users.
Why Do Businesses Need a Content Licensing Dashboard?
Content licensing involves many moving parts. Therefore, without a centralized dashboard, organizations face frequent challenges.
Common Challenges Without a Dashboard
-
Licensing costs scattered across multiple sheets
-
Difficulty tracking revenue recognition
-
No clear visibility into profit margins
-
Manual royalty calculations causing errors
-
Delayed monthly and quarterly reporting
-
Limited insight by content type, platform, or region
Because of these issues, teams often react too late. However, when you use a Content Licensing Dashboard in Excel, you move from reactive reporting to proactive decision-making.
How Does a Content Licensing Dashboard in Excel Work?
The dashboard follows a simple yet powerful workflow.
-
Enter Data in the Data Sheet
You record licensing costs, delivery costs, marketing expenses, royalty rates, revenue recognized, content type, platform, region, and dates. -
Automated Calculations Run in the Background
Excel formulas calculate total cost, profit, profit margin, and average royalty rate automatically. -
Interactive Pages Update Instantly
When you apply slicers, charts and KPIs update in real time. -
Clear Insights Support Decisions
You quickly identify profitable content, high-cost platforms, and underperforming regions.
As a result, the dashboard saves time while improving accuracy and visibility.
Click to Purchases Content Licensing Dashboard in Excel
Key Features of the Content Licensing Dashboard in Excel
Before diving into each page, let us understand the core features that make this dashboard effective.
Page Navigator for Easy Navigation
The dashboard includes a Page Navigator located on the left side. Because of this feature, users can move between pages instantly without scrolling or confusion.
Interactive Slicers
Each analytical page includes right-side slicers. These slicers allow you to filter data by content type, platform, region, or time period.
Automated KPI Cards
The dashboard displays key performance indicators at the top of relevant pages. These KPIs provide instant clarity without manual calculations.
Clean and Professional Visuals
The charts use clear labels and logical grouping. Therefore, even non-finance users can understand the insights quickly.
Click to Purchases Content Licensing Dashboard in Excel
What Pages Are Included in the Content Licensing Dashboard in Excel?
This dashboard contains five structured analytical pages, along with support and data sheets.
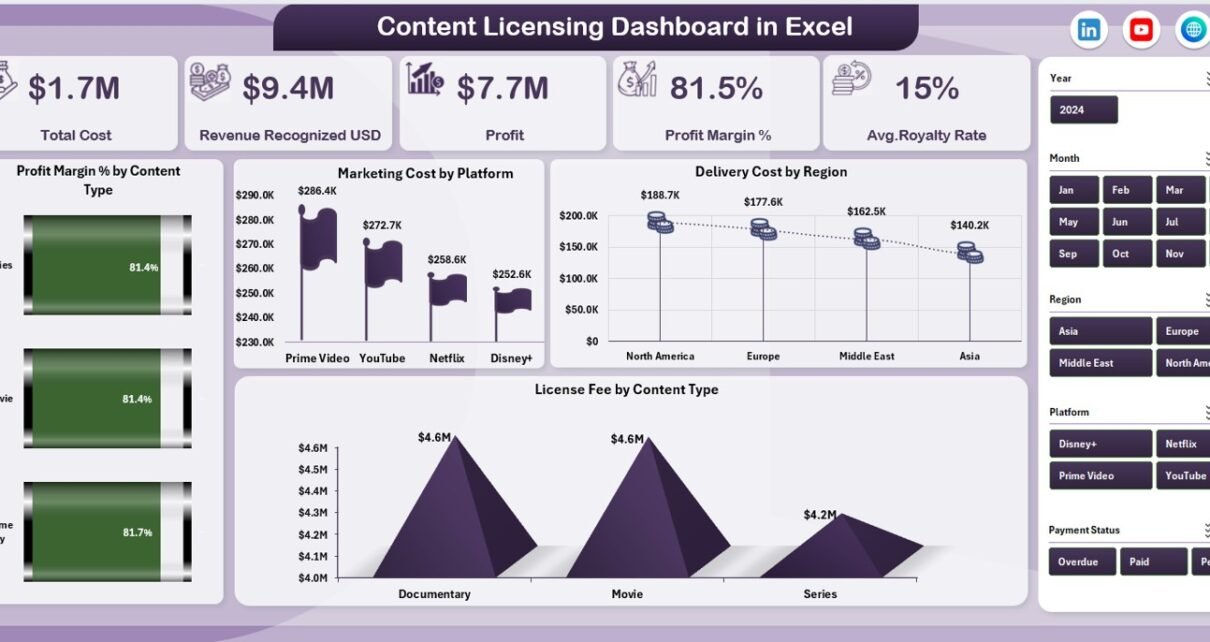
1. Overview Page: What Is Happening Across All Licensed Content?
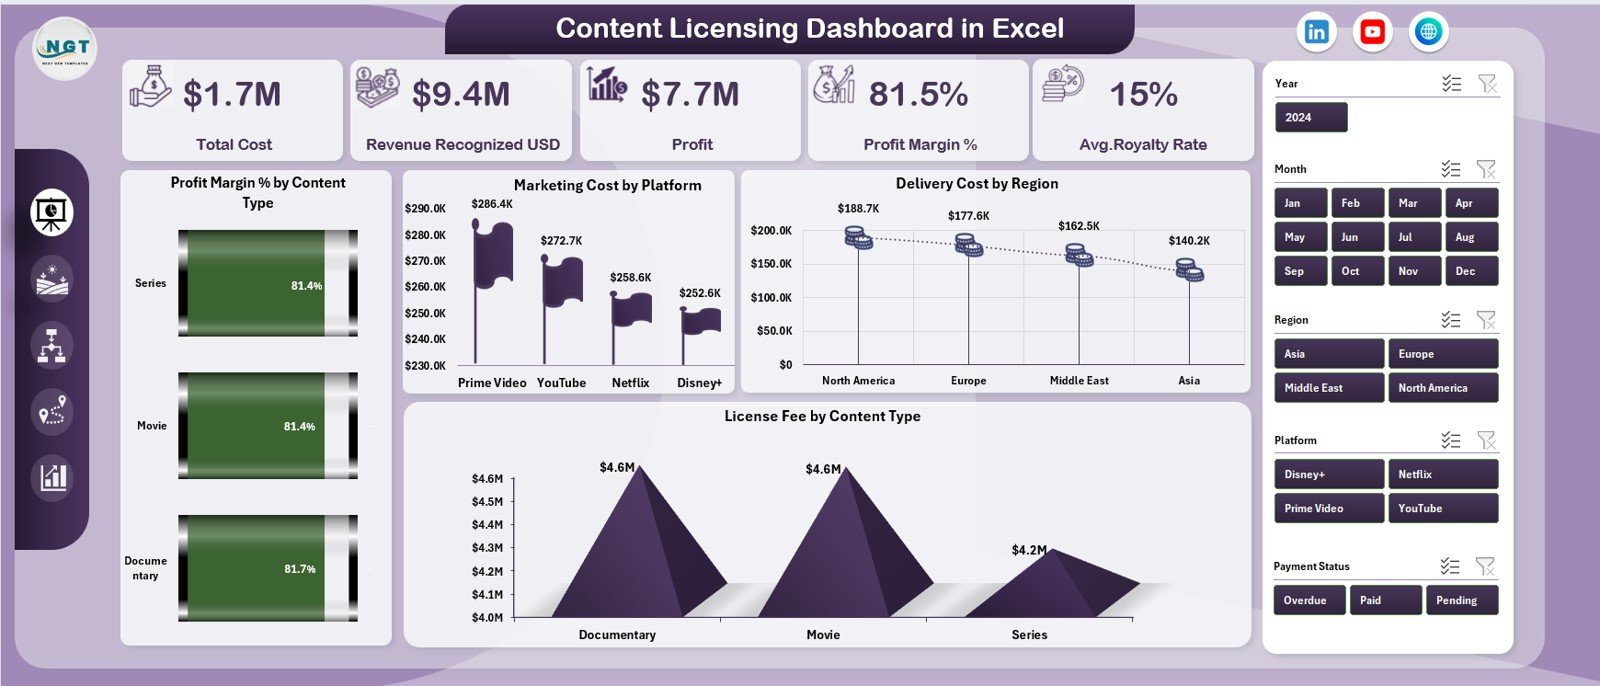
The Overview Page acts as the executive summary of the entire dashboard. Because it consolidates all key metrics, decision-makers can understand performance at a glance.
KPI Cards on the Overview Page
The Overview Page includes five KPI cards:
-
Total Cost – Displays the combined licensing, delivery, marketing, and royalty costs
-
Revenue Recognized (USD) – Shows total revenue earned from licensed content
-
Profit – Calculates revenue minus total cost
-
Profit Margin (%) – Indicates profitability efficiency
-
Average Royalty Rate – Highlights the average royalty paid across content
These KPIs help leadership quickly assess whether the licensing portfolio performs well or needs corrective action.
Charts on the Overview Page
The Overview Page includes four high-impact charts:
-
Profit Margin % by Content Type
-
Marketing Cost by Platform
-
Delivery Cost by Region
-
License Fee by Content Type
Because these visuals show patterns instantly, users can identify risk areas and growth opportunities without drilling into raw data.
2. Content Type Analysis: Which Content Types Perform Best?

The Content Type Analysis Page focuses on performance across different content categories such as movies, series, documentaries, music, or digital assets.
Why Analyze by Content Type?
Different content types carry different cost structures, royalty models, and audience appeal. Therefore, analyzing them separately improves licensing strategy.
Charts on the Content Type Analysis Page
This page includes four focused charts:
-
Marketing Cost by Content Type
-
Profit by Content Type
-
Total Cost by Content Type
-
Royalty Paid by Content Type
Because these charts work together, users can quickly compare costs versus returns for each content category.
Click to Purchases Content Licensing Dashboard in Excel
3. Platform Analysis: Which Platforms Drive Profit or Loss?
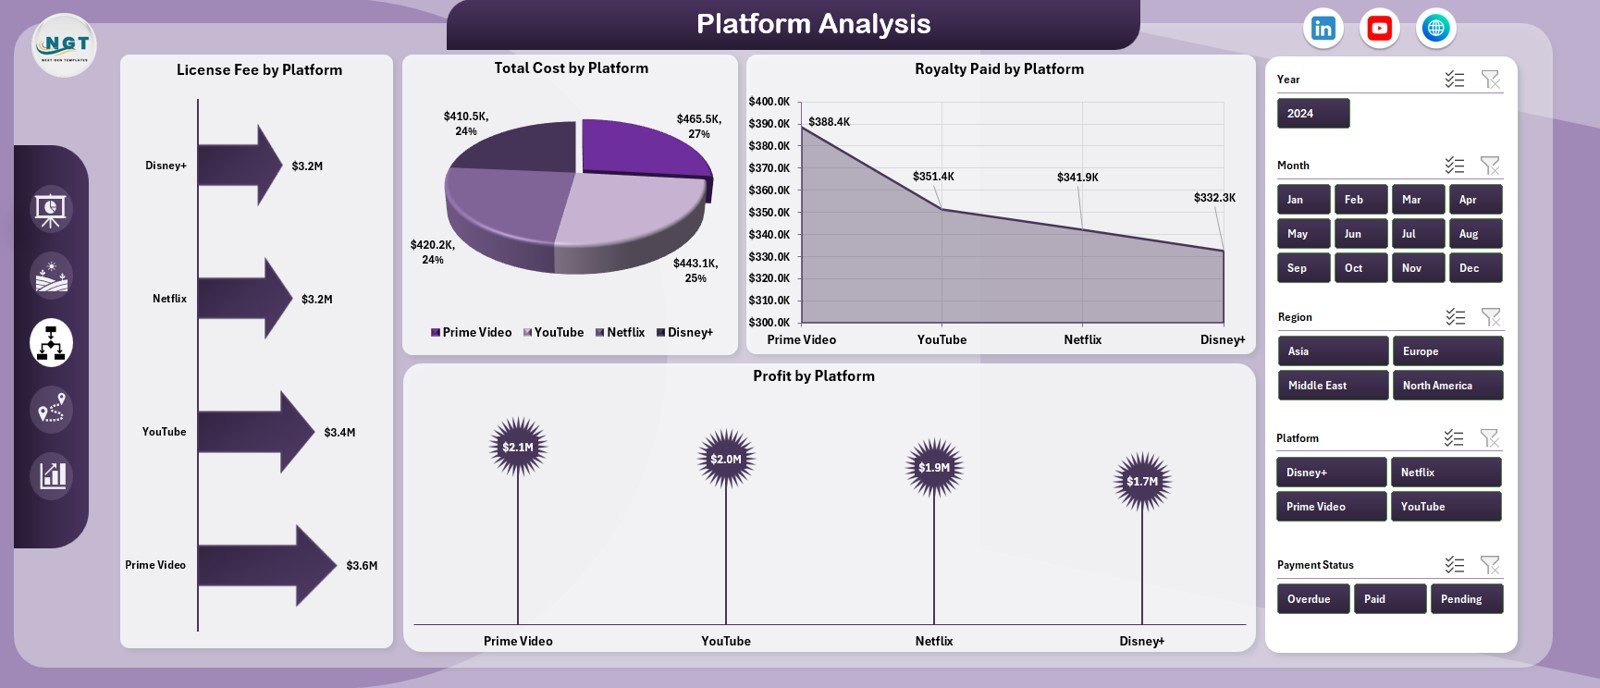
The Platform Analysis Page helps you understand how each distribution platform performs financially.
Why Platform-Level Analysis Matters
Each platform may have different licensing terms, revenue-sharing models, and audience behavior. As a result, profitability can vary widely.
Charts on the Platform Analysis Page
This page includes four platform-focused visuals:
-
License Fee by Platform
-
Total Cost by Platform
-
Royalty Paid by Platform
-
Profit by Platform
With these insights, teams can renegotiate contracts, reallocate budgets, or prioritize high-performing platforms.
4. Region Analysis: How Does Performance Vary by Geography?
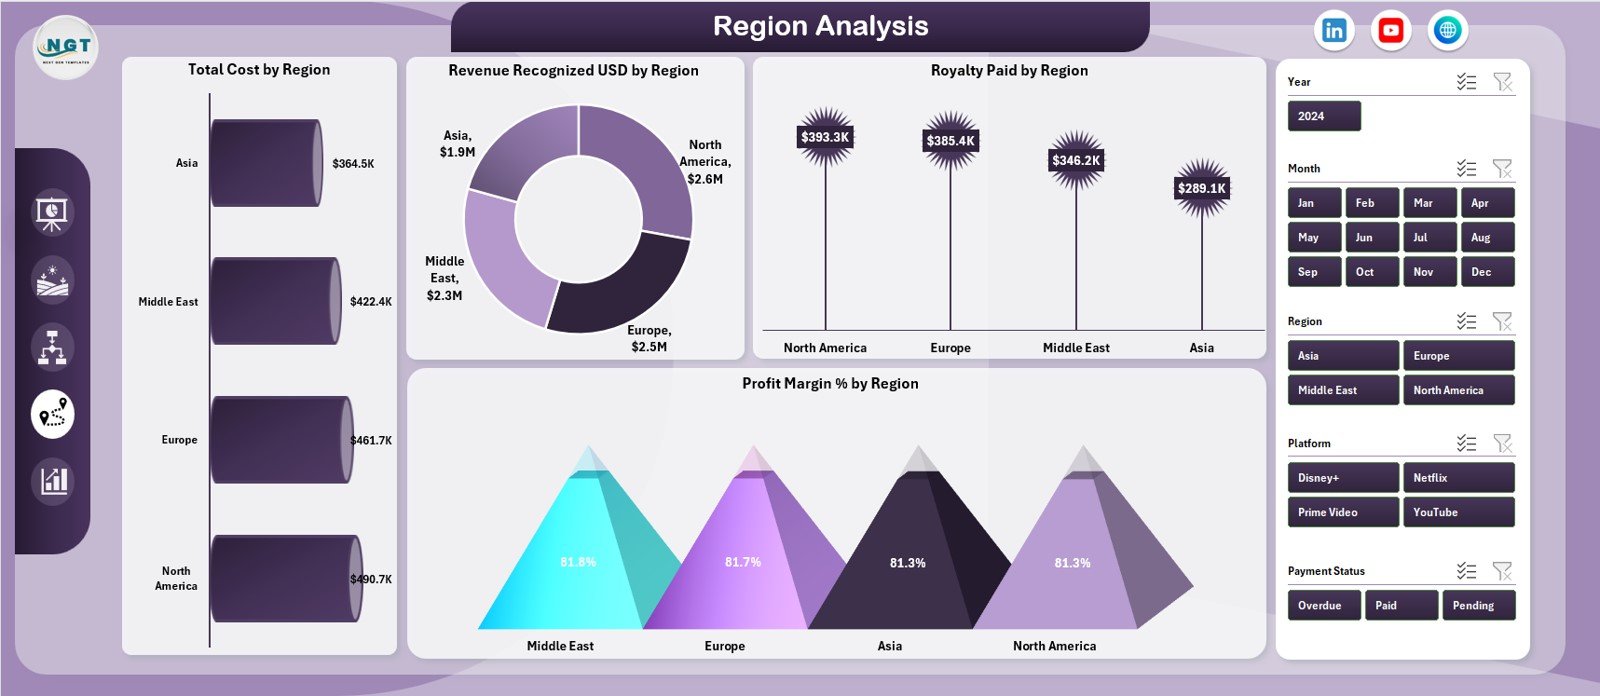
The Region Analysis Page provides geographic visibility into content licensing performance.
Why Region-Level Insights Are Critical
Content performance often varies by region due to audience preferences, pricing models, and operational costs. Therefore, regional analysis improves global licensing decisions.
Charts on the Region Analysis Page
This page includes four region-based charts:
-
Total Cost by Region
-
Revenue Recognized (USD) by Region
-
Royalty Paid by Region
-
Profit Margin % by Region
Because these charts show regional profitability clearly, organizations can optimize expansion and localization strategies.
5. Monthly Trends: How Is Performance Changing Over Time?
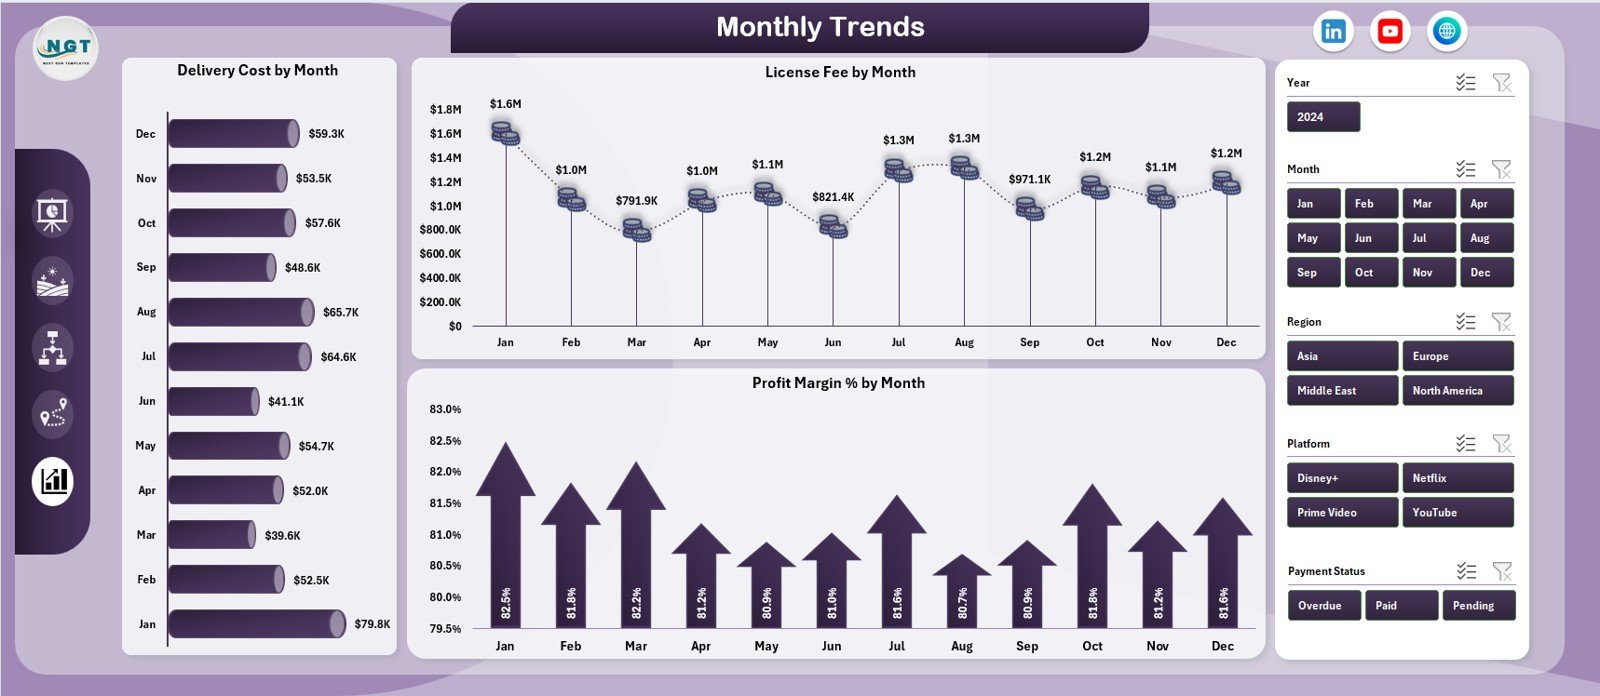
The Monthly Trends Page focuses on time-based analysis.
Why Monthly Trend Analysis Matters
Trends reveal patterns that static reports miss. Therefore, monthly analysis helps identify seasonality, cost spikes, and revenue momentum.
Charts on the Monthly Trends Page
This page includes three trend-focused charts:
-
Delivery Cost by Month
-
License Fee by Month
-
Profit Margin % by Month
With these insights, teams can forecast performance and plan budgets more accurately.
Support Sheet: Why Is It Important?
The Support Sheet stores helper calculations, lookup tables, and intermediate values. Because of this separation, the dashboard remains clean and user-friendly.
Data Sheet: Where Does the Dashboard Get Its Power?
The Data Sheet serves as the foundation of the dashboard. Users enter all transactional data here, including:
-
Content type
-
Platform
-
Region
-
License fee
-
Delivery cost
-
Marketing cost
-
Royalty rate
-
Revenue recognized
-
Month and year
Because all visuals link directly to this data, updating numbers automatically refreshes the dashboard.
Click to Purchases Content Licensing Dashboard in Excel
Advantages of a Content Licensing Dashboard in Excel
Using a Content Licensing Dashboard in Excel offers several strategic benefits.
Centralized Performance View
You see all licensing metrics in one place instead of multiple files.
Faster Decision-Making
Because visuals update instantly, teams respond quickly to performance changes.
Improved Accuracy
Automated calculations reduce manual errors.
Cost and Profit Visibility
You clearly understand where money flows and where margins shrink.
Easy Adoption
Excel familiarity ensures quick adoption across teams.
Scalable and Customizable
You can easily add new content types, platforms, or regions.
Best Practices for the Content Licensing Dashboard in Excel
To get the maximum value from your dashboard, follow these best practices.
Keep Data Entry Consistent
Use standardized naming for content types, platforms, and regions.
Update Data Regularly
Update the Data Sheet weekly or monthly to maintain accuracy.
Review KPIs First
Always start with the Overview Page before drilling into details.
Use Slicers Wisely
Apply slicers to focus on specific content, platforms, or periods.
Monitor Trends Monthly
Use the Monthly Trends Page to catch issues early.
Validate Royalty Calculations
Double-check royalty rates to ensure correct profit calculations.
Click to Purchases Content Licensing Dashboard in Excel
Who Can Benefit from a Content Licensing Dashboard in Excel?
This dashboard serves a wide range of professionals and organizations.
-
Media and entertainment companies
-
OTT and streaming platforms
-
Digital publishers
-
Music licensing firms
-
Content aggregators
-
Finance and accounting teams
-
Licensing and contract managers
-
Strategy and business analytics teams
How Does This Dashboard Improve Strategic Licensing Decisions?
Because the dashboard provides clarity, teams make smarter decisions. They invest in profitable content, renegotiate costly contracts, and exit underperforming markets confidently.
Moreover, leadership gains transparency. As a result, discussions shift from opinions to data-backed strategies.
Conclusion: Why Should You Use a Content Licensing Dashboard in Excel?
Content licensing grows more complex every year. Therefore, relying on manual reports slows teams down and increases risk. A Content Licensing Dashboard in Excel solves this problem by providing a centralized, interactive, and easy-to-use analytics solution.
Because it tracks costs, revenues, royalties, margins, platforms, regions, and trends in one place, the dashboard empowers organizations to stay profitable and competitive.
If you manage licensed content, this dashboard is no longer optional—it is essential.
Frequently Asked Questions (FAQs)
What is a Content Licensing Dashboard in Excel used for?
It tracks costs, revenue, royalties, profit, and trends related to licensed content in one interactive Excel file.
Who should use a Content Licensing Dashboard?
Media companies, OTT platforms, publishers, licensing teams, and finance professionals benefit the most.
Do I need advanced Excel skills to use this dashboard?
No. Basic Excel knowledge is enough to update data and use slicers.
Can I customize the dashboard?
Yes. You can add new content types, platforms, regions, or KPIs easily.
How often should I update the data?
Monthly updates work best, although weekly updates offer more control.
Does the dashboard support profitability analysis?
Yes. It calculates profit and profit margin automatically.
Can this dashboard replace licensing software?
While it does not replace enterprise systems, it offers a powerful and cost-effective analytics alternative.
Click to Purchases Content Licensing Dashboard in Excel
Visit our YouTube channel to learn step-by-step video tutorials