Corporate compliance sits at the heart of strong governance, risk control, and long-term business sustainability. Every organization must track policies, regulations, audits, and internal controls continuously. However, when teams rely on spreadsheets, emails, or static reports, compliance visibility drops quickly. As a result, risks grow silently, deadlines slip, and leadership reacts too late.
That is exactly where a Corporate Compliance Dashboard in Power BI creates a measurable impact.
In this in-depth, SEO-friendly guide, you will learn what a Corporate Compliance Dashboard in Power BI is, why organizations need it, how it works, and how each dashboard page supports compliance teams. Moreover, you will explore its advantages, best practices, and frequently asked questions so you can confidently use or implement this dashboard in your organization.
Click to buy Corporate Compliance Dashboard in Power BI
What Is a Corporate Compliance Dashboard in Power BI?
A Corporate Compliance Dashboard in Power BI is an interactive analytics solution designed to monitor, track, and analyze compliance activities across an organization in real time.
Instead of reviewing multiple files or chasing updates from departments, compliance teams view everything in one centralized dashboard. As a result, decision-makers gain clarity, control, and confidence.
This dashboard typically tracks:
- Compliance items and obligations
- Risk levels and non-compliant cases
- Completion status and overdue cases
- Departmental and individual accountability
- Location-wise compliance performance
Because Power BI delivers interactive visuals, slicers, and drill-downs, users can move from a high-level overview to granular insights instantly.
Why Do Organizations Need a Corporate Compliance Dashboard?
Organizations operate in a complex regulatory environment. Therefore, they must demonstrate compliance at all times. However, manual tracking creates blind spots and delays.
A Corporate Compliance Dashboard in Power BI solves these challenges effectively.
Key Reasons Organizations Use This Dashboard
- Compliance data lives in one place
- Leadership gets real-time compliance visibility
- High-risk cases stand out immediately
- Accountability improves across departments
- Audit preparation becomes easier and faster
Moreover, the dashboard helps teams shift from reactive compliance management to proactive risk prevention.
How Does a Corporate Compliance Dashboard in Power BI Work?
The dashboard connects compliance data from Excel files, databases, or other systems into Power BI. After that, Power BI transforms raw records into structured visuals.
Because Power BI updates automatically, users always see the latest compliance status.
Typical Workflow
- Compliance data gets recorded in structured tables
- Power BI imports and refreshes the data
- KPIs, charts, and tables update automatically
- Users apply filters for department, location, or person
- Leadership reviews insights and takes action
This process ensures accuracy, speed, and transparency.
What Pages Does the Corporate Compliance Dashboard in Power BI Include?
This dashboard includes five powerful pages, each designed to answer a specific compliance question. Together, they create a complete compliance monitoring system.
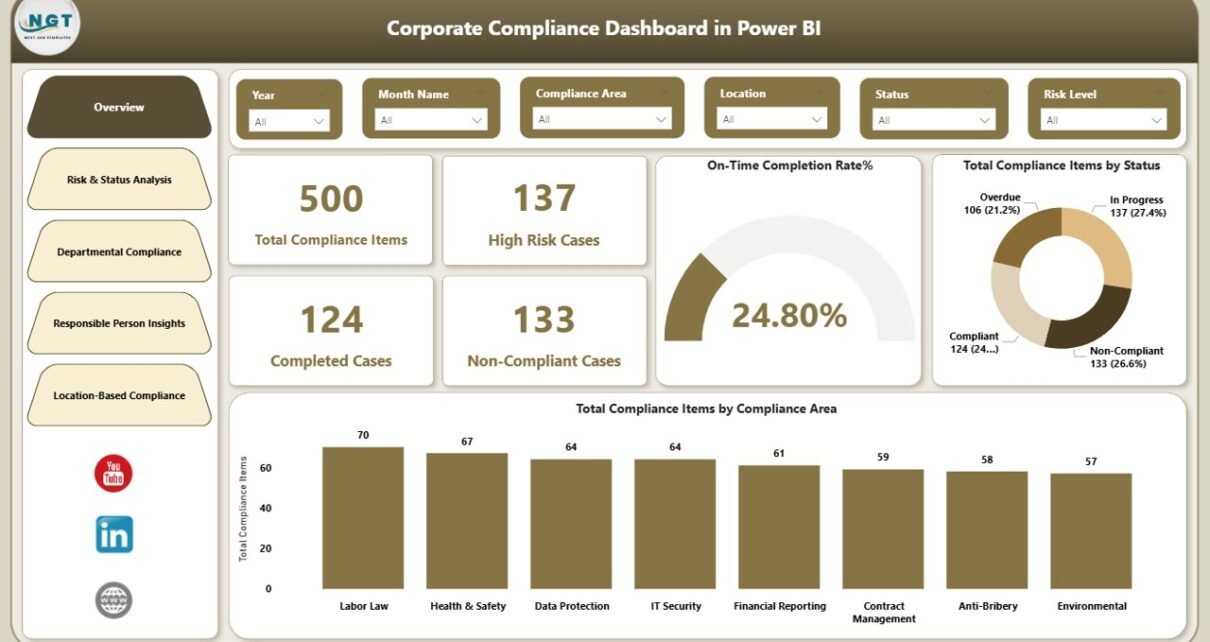
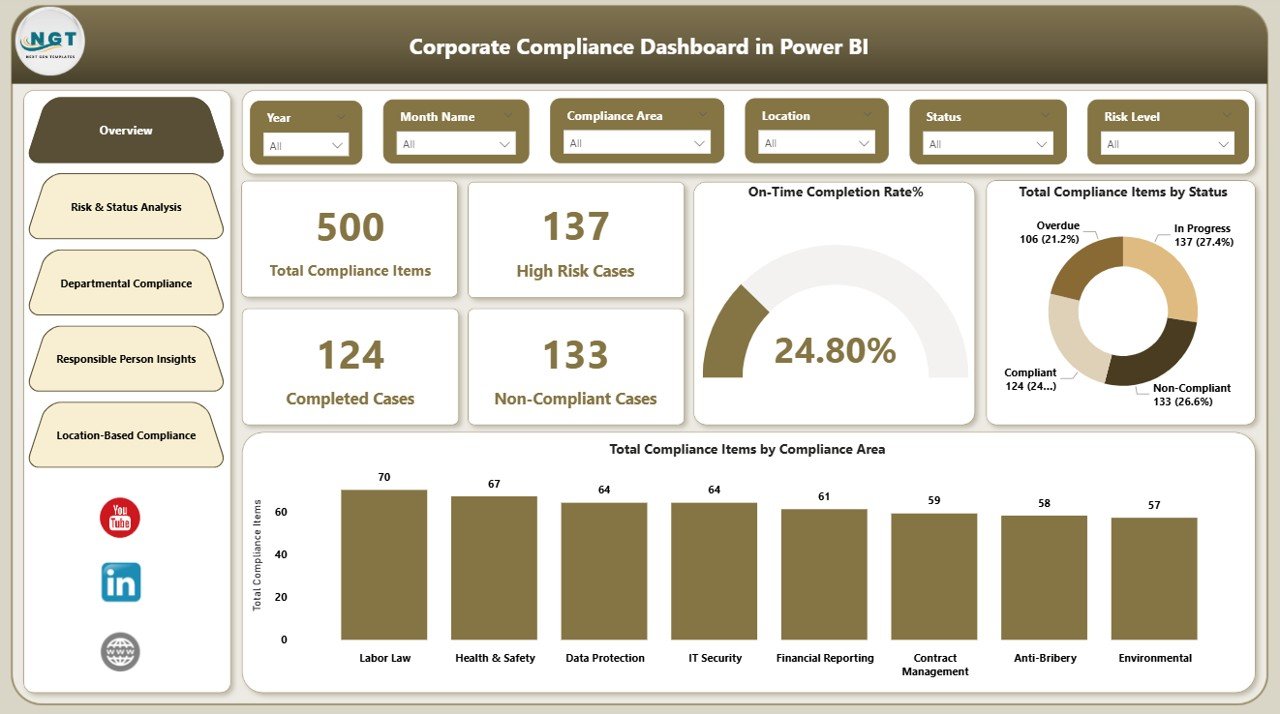
Overview Page – How Is Overall Compliance Performing?
The Overview page delivers a snapshot of organizational compliance performance. It helps leadership understand the big picture instantly.
Key Metrics on the Overview Page
- Total Compliance Items
- High-Risk Cases
- Completed Cases
- Non-Compliant Cases
- On-Time Completion Rate (%)
Visual Insights Included
- Total compliance items by status
- Total compliance items by compliance area
Because this page summarizes performance clearly, leaders can identify red flags within seconds.
Click to buy Corporate Compliance Dashboard in Power BI
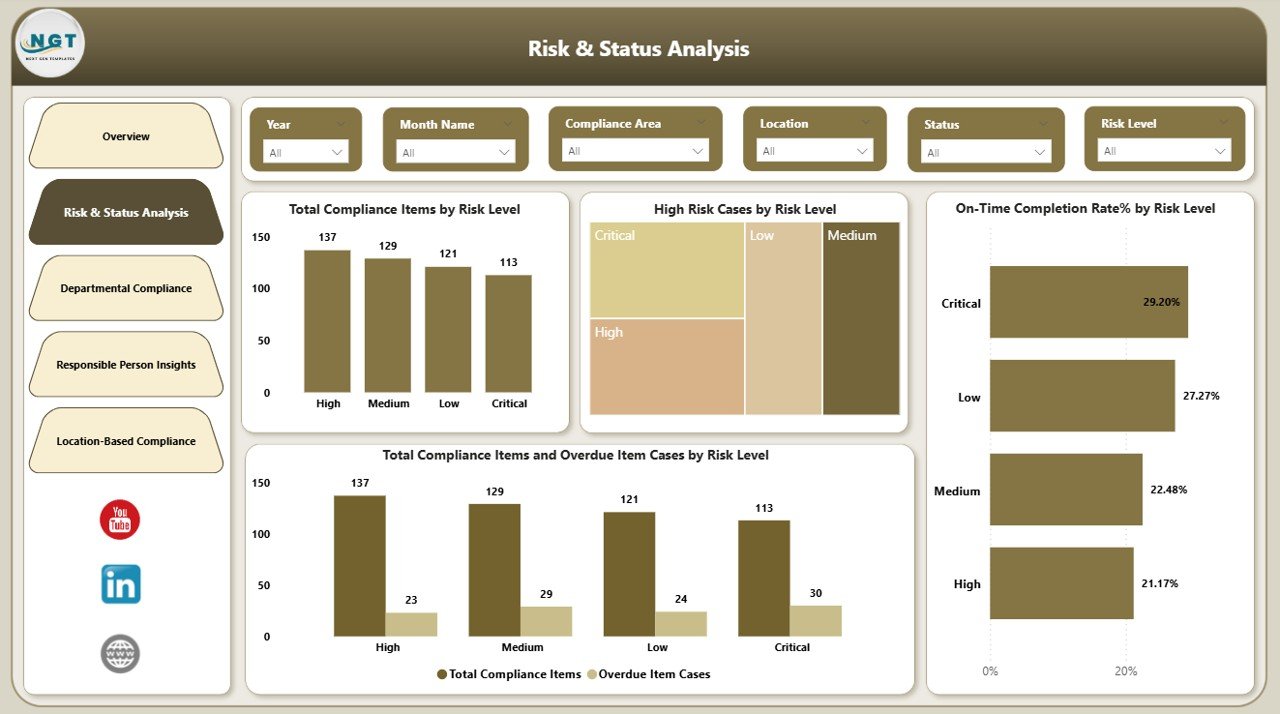
Risk & Status Analysis – Where Are the Highest Compliance Risks?
The Risk & Status Analysis page focuses on risk exposure. It helps compliance teams prioritize what matters most.
Key Insights on This Page
- Total compliance items by risk level
- High-risk cases by risk level
- On-time completion percentage by risk level
- Total and overdue compliance items by risk level
Because risk drives urgency, this page ensures teams address critical issues before minor ones.
Click to buy Corporate Compliance Dashboard in Power BI
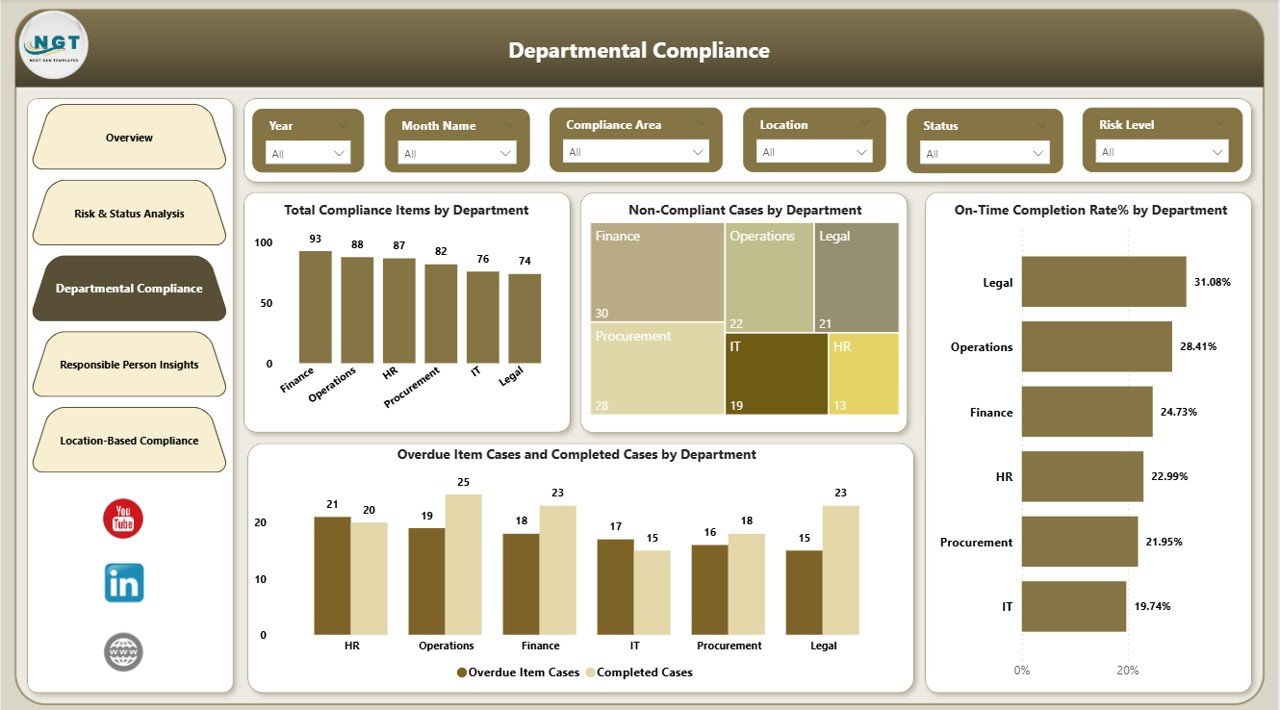
Departmental Compliance – Which Departments Need Attention?
The Departmental Compliance page highlights accountability across business units. It clearly shows which departments meet compliance requirements and which ones struggle.
Metrics Covered
- Total compliance items by department
- Non-compliant cases by department
- On-time completion rate (%) by department
- Overdue vs completed compliance items by department
As a result, leadership can engage specific departments with data-driven discussions instead of assumptions.
Click to buy Corporate Compliance Dashboard in Power BI
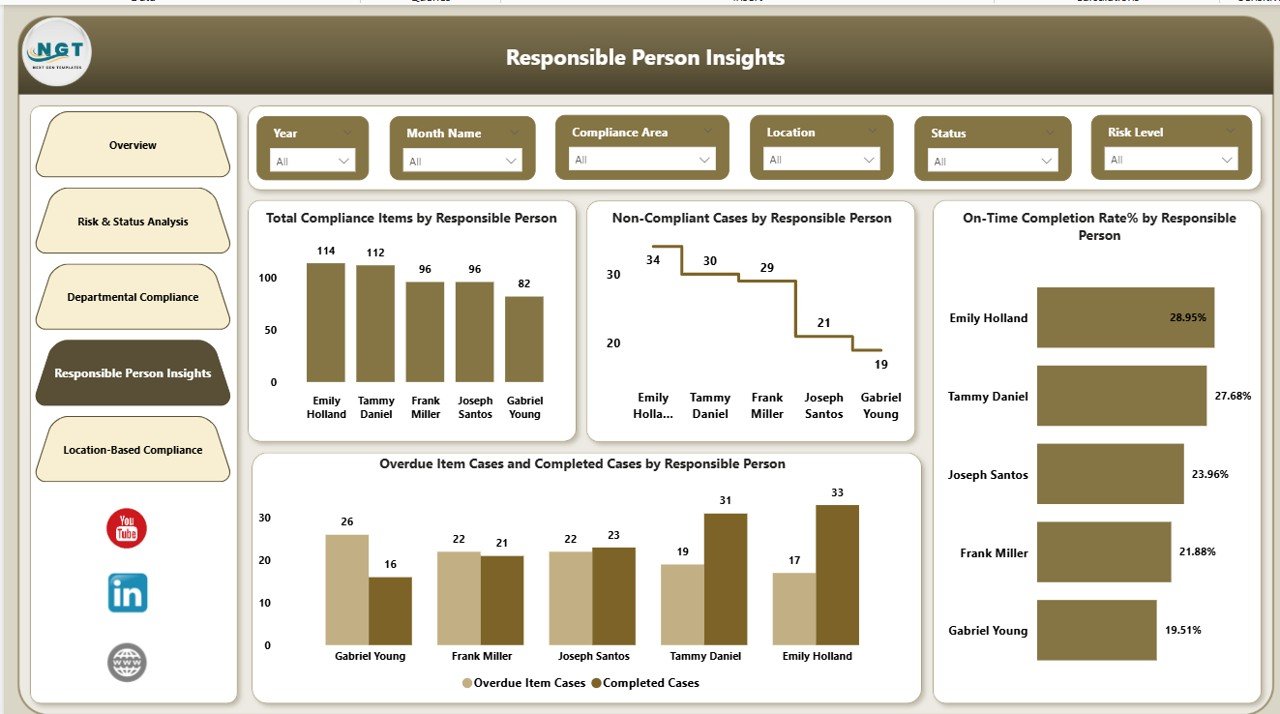
Responsible Person Insights – Who Owns Compliance Actions?
Compliance succeeds only when individuals take ownership. The Responsible Person Insights page ensures transparency at the individual level.
What This Page Shows
- Total compliance items by responsible person
- Non-compliant cases by responsible person
- On-time completion rate (%) by responsible person
- Overdue vs completed items by responsible person
Because accountability becomes visible, performance improves naturally.
Click to buy Corporate Compliance Dashboard in Power BI
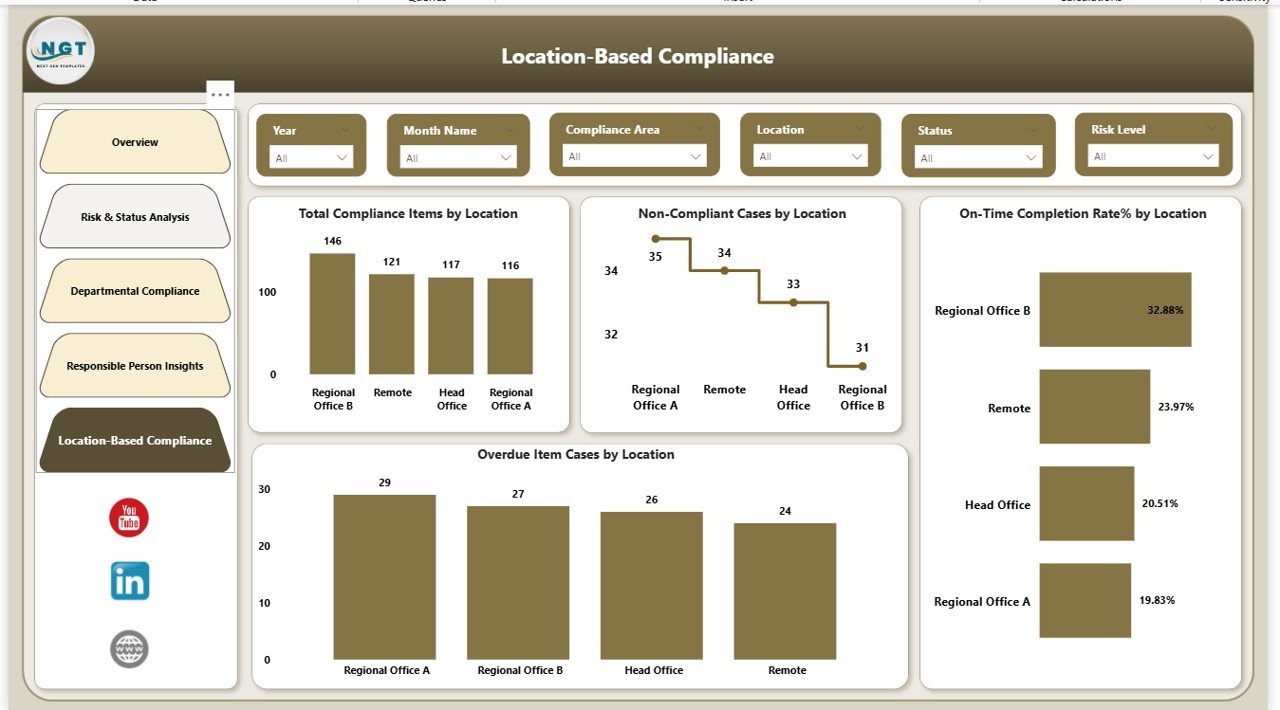
Location-Based Compliance – How Do Locations Compare?For organizations operating across regions, compliance performance often varies by location. The Location-Based Compliance page addresses this challenge directly.
Key Location-Wise Metrics
- Total compliance items by location
- Non-compliant cases by location
- On-time completion rate (%) by location
- Overdue compliance items by location
This page helps leaders spot regional compliance gaps and standardize practices.
Click to buy Corporate Compliance Dashboard in Power BI
What KPIs Does a Corporate Compliance Dashboard Track?
A strong compliance dashboard focuses on meaningful KPIs rather than vanity metrics.
Key Advantages
- Centralized Visibility
All compliance data appears in one place, which reduces confusion. - Real-Time Monitoring
Dashboards update automatically, so teams always work with current data. - Risk Prioritization
High-risk cases stand out clearly, which improves response time. - Improved Accountability
Departments and individuals see their performance transparently. - Faster Audits
Auditors access structured data without manual preparation. - Better Decision-Making
Leadership relies on data, not assumptions.
Because of these advantages, compliance teams work proactively instead of reactively.
Best Practices for the Corporate Compliance Dashboard in Power BI
To get maximum value from your dashboard, follow proven best practices.
- Define Clear Compliance KPIs
First, select KPIs that align with regulations and internal policies. Avoid unnecessary metrics.
- Standardize Compliance Data
Next, ensure all departments use the same definitions, formats, and timelines.
- Use Risk-Based Views
Then, prioritize high-risk compliance items so teams focus on what matters most.
- Assign Clear Ownership
After that, assign responsible persons for every compliance item.
- Review the Dashboard Regularly
Schedule weekly or monthly compliance reviews using the dashboard.
- Automate Data Refresh
Finally, enable automatic refresh to keep insights accurate and timely.
By following these practices, organizations strengthen governance and reduce compliance failures.
Who Can Use a Corporate Compliance Dashboard in Power BI?
This dashboard supports a wide range of users across industries.
Typical Users
- Compliance officers
- Risk management teams
- Internal audit teams
- Legal and governance teams
- Senior leadership
- Department heads
Because the dashboard remains intuitive, both technical and non-technical users can benefit.
How Does This Dashboard Improve Compliance Culture?
A strong compliance culture depends on visibility and accountability. This dashboard reinforces both.
Because performance becomes transparent, teams take ownership naturally. Moreover, leaders can recognize compliant behavior and correct issues early. Over time, compliance shifts from a burden to a shared responsibility.
Conclusion
A Corporate Compliance Dashboard in Power BI transforms how organizations manage compliance, risk, and accountability. Instead of relying on manual tracking and delayed reports, teams gain real-time insights across departments, individuals, and locations.
By using this dashboard, organizations improve governance, reduce risk exposure, and strengthen audit readiness. Moreover, leadership gains confidence because decisions rely on accurate, visual data.
If your organization wants proactive compliance management, this dashboard delivers exactly that.
Frequently Asked Questions (FAQs)
What is a Corporate Compliance Dashboard in Power BI?
A Corporate Compliance Dashboard in Power BI is an interactive reporting tool that tracks compliance obligations, risks, and performance metrics in real time.
Can this dashboard track multiple compliance areas?
Yes. The dashboard tracks compliance items by compliance area, department, responsible person, and location.
Does the dashboard support risk-based compliance monitoring?
Absolutely. It includes detailed risk-level analysis, including high-risk cases and overdue items.
Can non-technical users use this dashboard?
Yes. Power BI visuals remain intuitive, so business users can navigate the dashboard easily.
How often does the data update?
Data updates based on the refresh schedule you set. Many organizations refresh daily or in real time.
Is this dashboard suitable for audits?
Yes. Auditors can review compliance performance, history, and accountability directly from the dashboard.
Click to buy Corporate Compliance Dashboard in Power BI
Visit our YouTube channel to learn step-by-step video tutorials